
Reports
Reports
Analysts’ viewpoint on Market Scenario
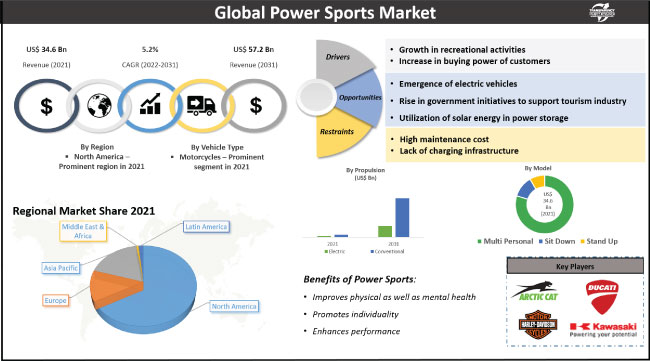
Growth in recreational activities and rise in disposable income of consumers across the globe are anticipated to drive the global power sports market during the forecast period. Power sports vehicles are designed to fulfill the needs of recreational and adventurous activities. They are highly precise vehicles that are not affected by different kind of road/terrain and rough riding.
Arctic Cat Inc., Ducati Motor Holding S.p.A., Harley-Davidson Inc., Hisun Motors Corp., and Honda Motor Company Ltd., are some of the major players operating in the market. These players are focusing on the development of eco-friendly and fuel-efficient electric power sports vehicles in order to gain revenue benefits. Key manufacturers are also tapping into incremental opportunities in the global market to empower the future of the power sports sector.
Power sports are a sub-category of motorsports that generally includes vehicles such as motorcycles, snowmobiles, all-terrain vehicles (ATVs), personal watercraft, and scooters. Power sports vehicles are designed for sports, racing, and recreational activities. These vehicles are typically powered by a high-efficiency engine and controlled with a handlebar. The global power sports market industry is projected to grow at a decent growth rate during the forecast period, owing to increased popularity of recreational activities and rise in spending power of customers.
In developed countries, people are more prosperous and have higher average incomes. These people are more likely to spend money on sports and leisure activities and recreational activities. Increase in popularity of recreational activities is majorly due to the rise in disposable income of consumers in developed countries. People are spending their time and money on adventure sports, etc., for entertainment purposes and wind down and relax from their busy lifestyles. Rise is participation of people in leisure and recreational activities, intensive sports, off-road motorcycle racing, etc., is expected to aid market expansion during the forecast period.
People, especially young individuals, are more inclined toward various sports and recreational activities de-stress and improve work-life balance. Rise in awareness about physical as well as mental fitness is driving the demand for recreational activities across the globe. This is likely to fuel the global power sports market progress during the forecast period.
People are continuously participating in various adventurous activities including motor racing, formula racing, etc. Rise in government initiatives to support the tourism sector by arranging recreational activities in several regions is anticipated to contribute toward market development in the near future.
Based on vehicle type, the motorcycles segment held major share of the market in 2021, owing to increased adoption among younger buyers. Additionally, affordability, low maintenance costs, and convenience are key factors that are expected to fuel the demand for motorcycles in the next few years. Therefore, the motorcycles segment is likely to hold a prominent share of the power sports business during the forecast period. However, sales of motorcycles with large engines (600cc and above) have been declining for the last few years due to a shift in consumer preferences (largely attributed to younger buyers) toward more accessible, fuel-efficient, lightweight, and eco-friendly motorcycles. A personal watercraft (watersports) is also highly popular vehicle option for recreational activities.
In terms of application, the power sports market bifurcated into two categories off-road and on-road. The off-road segment holds the largest share of the global power sports market in 2021. ATVs and utility terrain vehicles are sub-categories of power sport vehicles that can travel over rocky, uneven, and steep trails while still delivering excellent performance.
They have quick handling, are small, and can readily operate in dense areas like crowded forests and snowmobile paths. These are some of the key elements that are projected to boost the growth of the off-road segment over the forecast period. Due to the increase in demand for personal transportation vehicles and other factors, the on-road category is anticipated to grow steadily over the next few years.
In regional perspective, North America dominated the global power sports market in 2021, owing to the presence of higher income level population and appropriate outdoor temperature for exploring the recreational activities. On the other hand, there are several other players who have established their dominance in the power sports business. Textron Inc., Yamaha Motor Corporation, Arctic Cat, and Polaris are enhancing the power sports business in North America. Furthermore, state and federal governments in the region help the tourism industry to boost revenues through adventure activities.
Rise in number of recreational centers and regional organizations that consistently promote recreational, leisure, and off-road activities is expected to aid market development in Europe. Consequently, the Europe market is likely to grow significantly during the forecast period.
Asia Pacific is anticipated to witness considerable growth of the market, owing to a rise in buying power of an individuals as well as increase in trend of recreational activities in the region due to emergence of highly advanced technologies that ensure compliance of safety parameters as well. Rise in demand for motorcycles and ATVs in the region is expected to propel the power sports industry in Asia Pacific significantly during the forecast period.
The global market is fairly consolidated, with the largest players controlling majority of the share. Most of the firms are investing significantly in comprehensive research and development activities, primarily to develop highly efficient products to enhance the future of power sports vehicles. Expansion of product portfolios and mergers & acquisitions are notable strategies adopted by key manufacturers.
Arctic Cat Inc., Ducati Motor Holding S.p.A., Harley-Davidson Inc., Hisun Motors Corp., Honda Motor Company Ltd., John Deere, Kawasaki Heavy Industries Ltd., Kubota Corporation, Kymco, Polaris Inc., Suzuki Motor Corporation, Textron Inc., Triumph Motorcycles Ltd, Yamaha Motor Co. Ltd., and Zero Motorcycles Inc. are the prominent entities operating in the global power sports industry.
Key players have been profiled in the market research report based on parameters such as company overview, financial overview, product portfolio, business strategies, business segments, and recent developments.
|
Attribute |
Detail |
|
Market Size Value in 2021 (Base Year) |
US$ 34.6 Bn |
|
Market Forecast Value in 2031 |
US$ 57.2 Bn |
|
Growth Rate (CAGR) |
5.2% |
|
Forecast Period |
2022-2031 |
|
Quantitative Units |
US$ Bn for Value and Units for Volume |
|
Market Analysis |
It includes cross segment analysis at global as well as regional level. Furthermore, qualitative analysis includes drivers, restraints, opportunities, key trends, Porter’s Five Forces analysis, value chain analysis, and key trend analysis. |
|
Competition Landscape |
|
|
Format |
Electronic (PDF) + Excel |
|
Market Segmentation |
|
|
Regions Covered |
|
|
Countries Covered |
|
|
Companies Profiled |
|
|
Customization Scope |
Available upon Request |
|
Pricing |
Available upon Request |
The global market was valued at US$ 34.6 Bn in 2021.
It is expected to grow at a CAGR of 5.2% during the forecast period.
The global market would be worth US$ 57.2 Bn in 2031.
Growth in recreational activities and increase in buying power of customers.
The motorcycles segment held largest share of the market in 2021.
Advanced riding assistance features and electric vehicle technology.
North America is the most lucrative region of the global market.
Arctic Cat Inc., Ducati Motor Holding S.p.A., Harley-Davidson Inc., Hisun Motors Corp., Honda Motor Company Ltd., John Deere, Kawasaki Heavy Industries Ltd., Kubota Corporation, Kymco, Polaris Inc., Suzuki Motor Corporation, Textron Inc., Triumph Motorcycles Ltd, Yamaha Motor Co. Ltd., and Zero Motorcycles Inc.
1. Executive Summary
1.1. Global Market Outlook
1.1.1. Market Size, Units, US$ Bn, 2017-2031
1.2. TMR Analysis and Recommendations
1.3. Competitive Dashboard Analysis
2. Market Overview
2.1. Market Coverage / Taxonomy
2.2. Market Definition / Scope / Limitations
2.3. Market Dynamics
2.3.1. Drivers
2.3.2. Restraints
2.3.3. Opportunity
2.4. Market Factor Analysis
2.4.1. Porter’s Five Force Analysis
2.4.2. SWOT Analysis
2.5. Regulatory Scenario
2.6. Key Trend Analysis
2.7. Value Chain Analysis
2.8. Cost Structure Analysis
2.9. Profit Margin Analysis
3. COVID-19 Impact Analysis – Power Sports Market
4. Global Power Sports Market, By Vehicle Type
4.1. Market Snapshot
4.1.1. Introduction, Definition, and Key Findings
4.1.2. Market Growth & Y-o-Y Projections
4.1.3. Base Point Share Analysis
4.2. Global Power Sports Market Size Analysis & Forecast, 2017-2031, by Vehicle Type
4.2.1. Motorcycles
4.2.2. Scooters & Mopeds
4.2.3. ATVs (All Terrain Vehicles) & Quads
4.2.4. Golf Carts
4.2.5. Watersports
4.2.6. Snowmobiles
4.2.7. UTVs (Utility Terrain Vehicles)
4.2.8. Lawn Mowers
5. Global Power Sports Market, By Model
5.1. Market Snapshot
5.1.1. Introduction, Definition, and Key Findings
5.1.2. Market Growth & Y-o-Y Projections
5.1.3. Base Point Share Analysis
5.2. Global Power Sports Market Size Analysis & Forecast, 2017-2031, by Model
5.2.1. Multi Personal
5.2.2. Sit Down
5.2.3. Stand Up
6. Global Power Sports Market, By Propulsion
6.1. Market Snapshot
6.1.1. Introduction, Definition, and Key Findings
6.1.2. Market Growth & Y-o-Y Projections
6.1.3. Base Point Share Analysis
6.2. Global Power Sports Market Size Analysis & Forecast, 2017-2031, by Propulsion
6.2.1. Conventional
6.2.2. Electric
7. Global Power Sports Market, By Application
7.1. Market Snapshot
7.1.1. Introduction, Definition, and Key Findings
7.1.2. Market Growth & Y-o-Y Projections
7.1.3. Base Point Share Analysis
7.2. Global Power Sports Market Size Analysis & Forecast, 2017-2031, by Application
7.2.1. On-road
7.2.2. Off-road
8. Global Power Sports Market, by Region
8.1. Market Snapshot
8.1.1. Introduction, Definition, and Key Findings
8.1.2. Market Growth & Y-o-Y Projections
8.1.3. Base Point Share Analysis
8.2. Global Power Sports Market Size (Units), Revenue (US$ Bn) Analysis & Forecast, 2017-2031, by Region
8.2.1. North America
8.2.2. Europe
8.2.3. Asia Pacific
8.2.4. Middle East & Africa
8.2.5. South America
9. North America Power Sports Market
9.1. Market Snapshot
9.2. Power Sports Market Size Analysis & Forecast, 2017-2031, by Vehicle Type
9.2.1. Motorcycles
9.2.2. Scooters & Mopeds
9.2.3. ATVs (All Terrain Vehicles) & Quads
9.2.4. Golf Carts
9.2.5. Watersports
9.2.6. Snowmobiles
9.2.7. UTVs (Utility Terrain Vehicles)
9.2.8. Lawn Mowers
9.3. Power Sports Market Size Analysis & Forecast, 2017-2031, by Model
9.3.1. Multi Personal
9.3.2. Sit Down
9.3.3. Stand Up
9.4. Power Sports Market Size Analysis & Forecast, 2017-2031, by Propulsion
9.4.1. Conventional
9.4.2. Electric
9.5. Power Sports Market Size Analysis & Forecast, 2017-2031, by Application
9.5.1. On-road
9.5.2. Off-road
9.6. Key Country Analysis – North America Power Sports Market Size Analysis & Forecast, 2017-2031, by Country
9.6.1. The U. S.
9.6.2. Canada
9.6.3. Mexico
10. Europe Power Sports Market
10.1. Market Snapshot
10.2. Market Snapshot
10.3. Power Sports Market Size Analysis & Forecast, 2017-2031, by Vehicle Type
10.3.1. Motorcycles
10.3.2. Scooters & Mopeds
10.3.3. ATVs (All Terrain Vehicles) & Quads
10.3.4. Golf Carts
10.3.5. Watersports
10.3.6. Snowmobiles
10.3.7. UTVs (Utility Terrain Vehicles)
10.3.8. Lawn Mowers
10.4. Power Sports Market Size Analysis & Forecast, 2017-2031, by Model
10.4.1. Multi Personal
10.4.2. Sit Down
10.4.3. Stand Up
10.5. Power Sports Market Size Analysis & Forecast, 2017-2031, by Propulsion
10.5.1. Conventional
10.5.2. Electric
10.6. Power Sports Market Size Analysis & Forecast, 2017-2031, by Application
10.6.1. On-road
10.6.2. Off-road
10.7. Key Country Analysis – Europe Power Sports Market Size Analysis & Forecast, 2017-2031, by Country
10.7.1. Germany
10.7.2. U. K.
10.7.3. France
10.7.4. Italy
10.7.5. Spain
10.7.6. Nordic Countries
10.7.7. Russia & CIS
10.7.8. Rest of Europe
11. Asia Pacific Power Sports Market
11.1. Market Snapshot
11.2. Market Snapshot
11.3. Power Sports Market Size Analysis & Forecast, 2017-2031, by Vehicle Type
11.3.1. Motorcycles
11.3.2. Scooters & Mopeds
11.3.3. ATVs (All Terrain Vehicles) & Quads
11.3.4. Golf Carts
11.3.5. Watersports
11.3.6. Snowmobiles
11.3.7. UTVs (Utility Terrain Vehicles)
11.3.8. Lawn Mowers
11.4. Power Sports Market Size Analysis & Forecast, 2017-2031, by Model
11.4.1. Multi Personal
11.4.2. Sit Down
11.4.3. Stand Up
11.5. Power Sports Market Size Analysis & Forecast, 2017-2031, by Propulsion
11.5.1. Conventional
11.5.2. Electric
11.6. Power Sports Market Size Analysis & Forecast, 2017-2031, by Application
11.6.1. On-road
11.6.2. Off-road
11.7. Key Country Analysis – Asia Pacific Power Sports Market Size Analysis & Forecast, 2017-2031, by Country
11.7.1. China
11.7.2. India
11.7.3. Japan
11.7.4. ASEAN Countries
11.7.5. South Korea
11.7.6. ANZ
11.7.7. Rest of Asia Pacific
12. Middle East & Africa Power Sports Market
12.1. Market Snapshot
12.2. Market Snapshot
12.3. Power Sports Market Size Analysis & Forecast, 2017-2031, by Vehicle Type
12.3.1. Motorcycles
12.3.2. Scooters & Mopeds
12.3.3. ATVs (All Terrain Vehicles) & Quads
12.3.4. Golf Carts
12.3.5. Watersports
12.3.6. Snowmobiles
12.3.7. UTVs (Utility Terrain Vehicles)
12.3.8. Lawn Mowers
12.4. Power Sports Market Size Analysis & Forecast, 2017-2031, by Model
12.4.1. Multi Personal
12.4.2. Sit Down
12.4.3. Stand Up
12.5. Power Sports Market Size Analysis & Forecast, 2017-2031, by Propulsion
12.5.1. Conventional
12.5.2. Electric
12.6. Power Sports Market Size Analysis & Forecast, 2017-2031, by Application
12.6.1. On-road
12.6.2. Off-road
12.7. Key Country Analysis – Middle East & Africa Power Sports Market Size Analysis & Forecast, 2017-2031, by Country
12.7.1. GCC
12.7.2. South Africa
12.7.3. Turkey
12.7.4. Rest of Middle East & Africa
13. South America Power Sports Market
13.1. Market Snapshot
13.2. Market Snapshot
13.3. Power Sports Market Size Analysis & Forecast, 2017-2031, by Vehicle Type
13.3.1. Motorcycles
13.3.2. Scooters & Mopeds
13.3.3. ATVs (All Terrain Vehicles) & Quads
13.3.4. Golf Carts
13.3.5. Watersports
13.3.6. Snowmobiles
13.3.7. UTVs (Utility Terrain Vehicles)
13.3.8. Lawn Mowers
13.4. Power Sports Market Size Analysis & Forecast, 2017-2031, by Model
13.4.1. Multi Personal
13.4.2. Sit Down
13.4.3. Stand Up
13.5. Power Sports Market Size Analysis & Forecast, 2017-2031, by Propulsion
13.5.1. Conventional
13.5.2. Electric
13.6. Power Sports Market Size Analysis & Forecast, 2017-2031, by Application
13.6.1. On-road
13.6.2. Off-road
13.7. Key Country Analysis – South America Power Sports Market Size Analysis & Forecast, 2017-2031, by Country
13.7.1. Brazil
13.7.2. Argentina
13.7.3. Rest of South America
14. Competitive Landscape
14.1. Company Share Analysis/ Brand Share Analysis, 2021
14.2. Company Analysis for each player(Company Overview, Company Footprints, Production Locations, Product Portfolio, Competitors & Customers, Subsidiaries & Parent Organization, Recent Developments, Financial Analysis, Profitability, Revenue Share)
15. Company Profile/ Key Players
15.1. Arctic Cat Inc.
15.1.1. Company Overview
15.1.2. Company Footprints
15.1.3. Production Locations
15.1.4. Product Portfolio
15.1.5. Competitors & Customers
15.1.6. Subsidiaries & Parent Organization
15.1.7. Recent Developments
15.1.8. Financial Analysis
15.1.9. Profitability
15.1.10. Revenue Share
15.2. Ducati Motor Holding S.p.A.
15.2.1. Company Overview
15.2.2. Company Footprints
15.2.3. Production Locations
15.2.4. Product Portfolio
15.2.5. Competitors & Customers
15.2.6. Subsidiaries & Parent Organization
15.2.7. Recent Developments
15.2.8. Financial Analysis
15.2.9. Profitability
15.2.10. Revenue Share
15.3. Harley-Davidson Inc.
15.3.1. Company Overview
15.3.2. Company Footprints
15.3.3. Production Locations
15.3.4. Product Portfolio
15.3.5. Competitors & Customers
15.3.6. Subsidiaries & Parent Organization
15.3.7. Recent Developments
15.3.8. Financial Analysis
15.3.9. Profitability
15.3.10. Revenue Share
15.4. Hisun Motors Corp.
15.4.1. Company Overview
15.4.2. Company Footprints
15.4.3. Production Locations
15.4.4. Product Portfolio
15.4.5. Competitors & Customers
15.4.6. Subsidiaries & Parent Organization
15.4.7. Recent Developments
15.4.8. Financial Analysis
15.4.9. Profitability
15.4.10. Revenue Share
15.5. Honda Motor Company Ltd.
15.5.1. Company Overview
15.5.2. Company Footprints
15.5.3. Production Locations
15.5.4. Product Portfolio
15.5.5. Competitors & Customers
15.5.6. Subsidiaries & Parent Organization
15.5.7. Recent Developments
15.5.8. Financial Analysis
15.5.9. Profitability
15.5.10. Revenue Share
15.6. John Deere
15.6.1. Company Overview
15.6.2. Company Footprints
15.6.3. Production Locations
15.6.4. Product Portfolio
15.6.5. Competitors & Customers
15.6.6. Subsidiaries & Parent Organization
15.6.7. Recent Developments
15.6.8. Financial Analysis
15.6.9. Profitability
15.6.10. Revenue Share
15.7. Kawasaki Heavy Industries Ltd.
15.7.1. Company Overview
15.7.2. Company Footprints
15.7.3. Production Locations
15.7.4. Product Portfolio
15.7.5. Competitors & Customers
15.7.6. Subsidiaries & Parent Organization
15.7.7. Recent Developments
15.7.8. Financial Analysis
15.7.9. Profitability
15.7.10. Revenue Share
15.8. Kubota Corporation
15.8.1. Company Overview
15.8.2. Company Footprints
15.8.3. Production Locations
15.8.4. Product Portfolio
15.8.5. Competitors & Customers
15.8.6. Subsidiaries & Parent Organization
15.8.7. Recent Developments
15.8.8. Financial Analysis
15.8.9. Profitability
15.8.10. Revenue Share
15.9. Kymco
15.9.1. Company Overview
15.9.2. Company Footprints
15.9.3. Production Locations
15.9.4. Product Portfolio
15.9.5. Competitors & Customers
15.9.6. Subsidiaries & Parent Organization
15.9.7. Recent Developments
15.9.8. Financial Analysis
15.9.9. Profitability
15.9.10. Revenue Share
15.10. Polaris Inc.
15.10.1. Company Overview
15.10.2. Company Footprints
15.10.3. Production Locations
15.10.4. Product Portfolio
15.10.5. Competitors & Customers
15.10.6. Subsidiaries & Parent Organization
15.10.7. Recent Developments
15.10.8. Financial Analysis
15.10.9. Profitability
15.10.10. Revenue Share
15.11. Suzuki Motor Corporation
15.11.1. Company Overview
15.11.2. Company Footprints
15.11.3. Production Locations
15.11.4. Product Portfolio
15.11.5. Competitors & Customers
15.11.6. Subsidiaries & Parent Organization
15.11.7. Recent Developments
15.11.8. Financial Analysis
15.11.9. Profitability
15.11.10. Revenue Share
15.12. Textron Inc.
15.12.1. Company Overview
15.12.2. Company Footprints
15.12.3. Production Locations
15.12.4. Product Portfolio
15.12.5. Competitors & Customers
15.12.6. Subsidiaries & Parent Organization
15.12.7. Recent Developments
15.12.8. Financial Analysis
15.12.9. Profitability
15.12.10. Revenue Share
15.13. Triumph Motorcycles Ltd
15.13.1. Company Overview
15.13.2. Company Footprints
15.13.3. Production Locations
15.13.4. Product Portfolio
15.13.5. Competitors & Customers
15.13.6. Subsidiaries & Parent Organization
15.13.7. Recent Developments
15.13.8. Financial Analysis
15.13.9. Profitability
15.13.10. Revenue Share
15.14. Yamaha Motor Co. Ltd.
15.14.1. Company Overview
15.14.2. Company Footprints
15.14.3. Production Locations
15.14.4. Product Portfolio
15.14.5. Competitors & Customers
15.14.6. Subsidiaries & Parent Organization
15.14.7. Recent Developments
15.14.8. Financial Analysis
15.14.9. Profitability
15.14.10. Revenue Share
15.15. Zero Motorcycles Inc.
15.15.1. Company Overview
15.15.2. Company Footprints
15.15.3. Production Locations
15.15.4. Product Portfolio
15.15.5. Competitors & Customers
15.15.6. Subsidiaries & Parent Organization
15.15.7. Recent Developments
15.15.8. Financial Analysis
15.15.9. Profitability
15.15.10. Revenue Share
15.16. Other Key Players
15.16.1. Company Overview
15.16.2. Company Footprints
15.16.3. Production Locations
15.16.4. Product Portfolio
15.16.5. Competitors & Customers
15.16.6. Subsidiaries & Parent Organization
15.16.7. Recent Developments
15.16.8. Financial Analysis
15.16.9. Profitability
15.16.10. Revenue Share
List of Tables
Table 1: Global Power Sports Market Volume (Units) Forecast, by Vehicle Type, 2017‒2031
Table 2: Global Power Sports Market Value (US$ Bn) Forecast, by Vehicle Type, 2017‒2031
Table 3: Global Power Sports Market Volume (Units) Forecast, by Model, 2017‒2031
Table 4: Global Power Sports Market Value (US$ Bn) Forecast, by Model, 2017‒2031
Table 5: Global Power Sports Market Volume (Units) Forecast, by Propulsion, 2017‒2031
Table 6: Global Power Sports Market Value (US$ Bn) Forecast, by Propulsion, 2017‒2031
Table 7: Global Power Sports Market Volume (Units) Forecast, by Application, 2017‒2031
Table 8: Global Power Sports Market Value (US$ Bn) Forecast, by Application, 2017‒2031
Table 9: Global Power Sports Market Volume (Units) Forecast, by Region, 2017‒2031
Table 10: Global Power Sports Market Value (US$ Bn) Forecast, by Region, 2017‒2031
Table 11: North America Power Sports Market Volume (Units) Forecast, by Vehicle Type, 2017‒2031
Table 12: North America Power Sports Market Value (US$ Bn) Forecast, by Vehicle Type, 2017‒2031
Table 13: North America Power Sports Market Volume (Units) Forecast, by Model, 2017‒2031
Table 14: North America Power Sports Market Value (US$ Bn) Forecast, by Model, 2017‒2031
Table 15: North America Power Sports Market Volume (Units) Forecast, by Propulsion, 2017‒2031
Table 16: North America Power Sports Market Value (US$ Bn) Forecast, by Propulsion, 2017‒2031
Table 17: North America Power Sports Market Volume (Units) Forecast, by Application, 2017‒2031
Table 18: North America Power Sports Market Value (US$ Bn) Forecast, by Application, 2017‒2031
Table 19: North America Power Sports Market Volume (Units) Forecast, by Country, 2017‒2031
Table 20: North America Power Sports Market Value (US$ Bn) Forecast, by Country, 2017‒2031
Table 21: Europe Power Sports Market Volume (Units) Forecast, by Vehicle Type, 2017‒2031
Table 22: Europe Power Sports Market Value (US$ Bn) Forecast, by Vehicle Type, 2017‒2031
Table 23: Europe Power Sports Market Volume (Units) Forecast, by Model, 2017‒2031
Table 24: Europe Power Sports Market Value (US$ Bn) Forecast, by Model, 2017‒2031
Table 25: Europe Power Sports Market Volume (Units) Forecast, by Propulsion, 2017‒2031
Table 26: Europe Power Sports Market Value (US$ Bn) Forecast, by Propulsion, 2017‒2031
Table 27: Europe Power Sports Market Volume (Units) Forecast, by Application, 2017‒2031
Table 28: Europe Power Sports Market Value (US$ Bn) Forecast, by Application, 2017‒2031
Table 29: Europe Power Sports Market Volume (Units) Forecast, by Country, 2017‒2031
Table 30: Europe Power Sports Market Value (US$ Bn) Forecast, by Country, 2017‒2031
Table 31: Asia Pacific Power Sports Market Volume (Units) Forecast, by Vehicle Type, 2017‒2031
Table 32: Asia Pacific Power Sports Market Value (US$ Bn) Forecast, by Vehicle Type, 2017‒2031
Table 33: Asia Pacific Power Sports Market Volume (Units) Forecast, by Model, 2017‒2031
Table 34: Asia Pacific Power Sports Market Value (US$ Bn) Forecast, by Model, 2017‒2031
Table 35: Asia Pacific Power Sports Market Volume (Units) Forecast, by Propulsion, 2017‒2031
Table 36: Asia Pacific Power Sports Market Value (US$ Bn) Forecast, by Propulsion, 2017‒2031
Table 37: Asia Pacific Power Sports Market Volume (Units) Forecast, by Application, 2017‒2031
Table 38: Asia Pacific Power Sports Market Value (US$ Bn) Forecast, by Application, 2017‒2031
Table 39: Asia Pacific Power Sports Market Volume (Units) Forecast, by Country, 2017‒2031
Table 40: Asia Pacific Power Sports Market Value (US$ Bn) Forecast, by Country, 2017‒2031
Table 41: Middle East & Africa Power Sports Market Volume (Units) Forecast, by Vehicle Type, 2017‒2031
Table 42: Middle East & Africa Power Sports Market Value (US$ Bn) Forecast, by Vehicle Type, 2017‒2031
Table 43: Middle East & Africa Power Sports Market Volume (Units) Forecast, by Model, 2017‒2031
Table 44: Middle East & Africa Power Sports Market Value (US$ Bn) Forecast, by Model, 2017‒2031
Table 45: Middle East & Africa Power Sports Market Volume (Units) Forecast, by Propulsion, 2017‒2031
Table 46: Middle East & Africa Power Sports Market Value (US$ Bn) Forecast, by Propulsion, 2017‒2031
Table 47: Middle East & Africa Power Sports Market Volume (Units) Forecast, by Application, 2017‒2031
Table 48: Middle East & Africa Power Sports Market Value (US$ Bn) Forecast, by Application, 2017‒2031
Table 49: Middle East & Africa Power Sports Market Volume (Units) Forecast, by Country, 2017‒2031
Table 50: Middle East & Africa Power Sports Market Value (US$ Bn) Forecast, by Country, 2017‒2031
Table 51: South America Power Sports Market Volume (Units) Forecast, by Vehicle Type, 2017‒2031
Table 52: South America Power Sports Market Value (US$ Bn) Forecast, by Vehicle Type, 2017‒2031
Table 53: South America Power Sports Market Volume (Units) Forecast, by Model, 2017‒2031
Table 54: South America Power Sports Market Value (US$ Bn) Forecast, by Model, 2017‒2031
Table 55: South America Power Sports Market Volume (Units) Forecast, by Propulsion, 2017‒2031
Table 56: South America Power Sports Market Value (US$ Bn) Forecast, by Propulsion, 2017‒2031
Table 57: South America Power Sports Market Volume (Units) Forecast, by Application, 2017‒2031
Table 58: South America Power Sports Market Value (US$ Bn) Forecast, by Application, 2017‒2031
Table 59: South America Power Sports Market Volume (Units) Forecast, by Country, 2017‒2031
Table 60: South America Power Sports Market Value (US$ Bn) Forecast, by Country, 2017‒2031
List of Figures
Figure 1: Global Power Sports Market Volume (Units) Forecast, by Vehicle Type, 2017‒2031
Figure 2: Global Power Sports Market Value (US$ Bn) Forecast, by Vehicle Type, 2017‒2031
Figure 3: Global Power Sports Market, Incremental Opportunity, by Vehicle Type, Value (US$ Bn), 2022‒2031
Figure 4: Global Power Sports Market Volume (Units) Forecast, by Model, 2017‒2031
Figure 5: Global Power Sports Market Value (US$ Bn) Forecast, by Model, 2017‒2031
Figure 6: Global Power Sports Market, Incremental Opportunity, by Model, Value (US$ Bn), 2022‒2031
Figure 7: Global Power Sports Market Volume (Units) Forecast, by Propulsion, 2017‒2031
Figure 8: Global Power Sports Market Value (US$ Bn) Forecast, by Propulsion, 2017‒2031
Figure 9: Global Power Sports Market, Incremental Opportunity, by Propulsion, Value (US$ Bn), 2022‒2031
Figure 10: Global Power Sports Market Volume (Units) Forecast, by Application, 2017‒2031
Figure 11: Global Power Sports Market Value (US$ Bn) Forecast, by Application, 2017‒2031
Figure 12: Global Power Sports Market, Incremental Opportunity, by Application, Value (US$ Bn), 2022‒2031
Figure 13: Global Power Sports Market Volume (Units) Forecast, by Region, 2017‒2031
Figure 14: Global Power Sports Market Value (US$ Bn) Forecast, by Region, 2017‒2031
Figure 15: Global Power Sports Market, Incremental Opportunity, by Region, Value (US$ Bn), 2022‒2031
Figure 16: North America Power Sports Market Volume (Units) Forecast, by Vehicle Type, 2017‒2031
Figure 17: North America Power Sports Market Value (US$ Bn) Forecast, by Vehicle Type, 2017‒2031
Figure 18: North America Power Sports Market, Incremental Opportunity, by Vehicle Type, Value (US$ Bn), 2022‒2031
Figure 19: North America Power Sports Market Volume (Units) Forecast, by Model, 2017‒2031
Figure 20: North America Power Sports Market Value (US$ Bn) Forecast, by Model, 2017‒2031
Figure 21: North America Power Sports Market, Incremental Opportunity, by Model, Value (US$ Bn), 2022‒2031
Figure 22: North America Power Sports Market Volume (Units) Forecast, by Propulsion, 2017‒2031
Figure 23: North America Power Sports Market Value (US$ Bn) Forecast, by Propulsion, 2017‒2031
Figure 24: North America Power Sports Market, Incremental Opportunity, by Propulsion, Value (US$ Bn), 2022‒2031
Figure 25: North America Power Sports Market Volume (Units) Forecast, by Application, 2017‒2031
Figure 26: North America Power Sports Market Value (US$ Bn) Forecast, by Application, 2017‒2031
Figure 27: North America Power Sports Market, Incremental Opportunity, by Application, Value (US$ Bn), 2022‒2031
Figure 28: North America Power Sports Market Volume (Units) Forecast, by Country, 2017‒2031
Figure 29: North America Power Sports Market Value (US$ Bn) Forecast, by Country, 2017‒2031
Figure 30: North America Power Sports Market, Incremental Opportunity, by Country, Value (US$ Bn), 2022‒2031
Figure 31: Europe Power Sports Market Volume (Units) Forecast, by Vehicle Type, 2017‒2031
Figure 32: Europe Power Sports Market Value (US$ Bn) Forecast, by Vehicle Type, 2017‒2031
Figure 33: Europe Power Sports Market, Incremental Opportunity, by Vehicle Type, Value (US$ Bn), 2022‒2031
Figure 34: Europe Power Sports Market Volume (Units) Forecast, by Model, 2017‒2031
Figure 35: Europe Power Sports Market Value (US$ Bn) Forecast, by Model, 2017‒2031
Figure 36: Europe Power Sports Market, Incremental Opportunity, by Model, Value (US$ Bn), 2022‒2031
Figure 37: Europe Power Sports Market Volume (Units) Forecast, by Propulsion, 2017‒2031
Figure 38: Europe Power Sports Market Value (US$ Bn) Forecast, by Propulsion, 2017‒2031
Figure 39: Europe Power Sports Market, Incremental Opportunity, by Propulsion, Value (US$ Bn), 2022‒2031
Figure 40: Europe Power Sports Market Volume (Units) Forecast, by Application, 2017‒2031
Figure 41: Europe Power Sports Market Value (US$ Bn) Forecast, by Application, 2017‒2031
Figure 42: Europe Power Sports Market, Incremental Opportunity, by Application, Value (US$ Bn), 2022‒2031
Figure 43: Europe Power Sports Market Volume (Units) Forecast, by Country, 2017‒2031
Figure 44: Europe Power Sports Market Value (US$ Bn) Forecast, by Country, 2017‒2031
Figure 45: Europe Power Sports Market, Incremental Opportunity, by Country, Value (US$ Bn), 2022‒2031
Figure 46: Asia Pacific Power Sports Market Volume (Units) Forecast, by Vehicle Type, 2017‒2031
Figure 47: Asia Pacific Power Sports Market Value (US$ Bn) Forecast, by Vehicle Type, 2017‒2031
Figure 48: Asia Pacific Power Sports Market, Incremental Opportunity, by Vehicle Type, Value (US$ Bn), 2022‒2031
Figure 49: Asia Pacific Power Sports Market Volume (Units) Forecast, by Model, 2017‒2031
Figure 50: Asia Pacific Power Sports Market Value (US$ Bn) Forecast, by Model, 2017‒2031
Figure 51: Asia Pacific Power Sports Market, Incremental Opportunity, by Model, Value (US$ Bn), 2022‒2031
Figure 52: Asia Pacific Power Sports Market Volume (Units) Forecast, by Propulsion, 2017‒2031
Figure 53: Asia Pacific Power Sports Market Value (US$ Bn) Forecast, by Propulsion, 2017‒2031
Figure 54: Asia Pacific Power Sports Market, Incremental Opportunity, by Propulsion, Value (US$ Bn), 2022‒2031
Figure 55: Asia Pacific Power Sports Market Volume (Units) Forecast, by Application, 2017‒2031
Figure 56: Asia Pacific Power Sports Market Value (US$ Bn) Forecast, by Application, 2017‒2031
Figure 57: Asia Pacific Power Sports Market, Incremental Opportunity, by Application, Value (US$ Bn), 2022‒2031
Figure 58: Asia Pacific Power Sports Market Volume (Units) Forecast, by Country, 2017‒2031
Figure 59: Asia Pacific Power Sports Market Value (US$ Bn) Forecast, by Country, 2017‒2031
Figure 60: Asia Pacific Power Sports Market, Incremental Opportunity, by Country, Value (US$ Bn), 2022‒2031
Figure 61: Middle East & Africa Power Sports Market Volume (Units) Forecast, by Vehicle Type, 2017‒2031
Figure 62: Middle East & Africa Power Sports Market Value (US$ Bn) Forecast, by Vehicle Type, 2017‒2031
Figure 63: Middle East & Africa Power Sports Market, Incremental Opportunity, by Vehicle Type, Value (US$ Bn), 2022‒2031
Figure 64: Middle East & Africa Power Sports Market Volume (Units) Forecast, by Model, 2017‒2031
Figure 65: Middle East & Africa Power Sports Market Value (US$ Bn) Forecast, by Model, 2017‒2031
Figure 66: Middle East & Africa Power Sports Market, Incremental Opportunity, by Model, Value (US$ Bn), 2022‒2031
Figure 67: Middle East & Africa Power Sports Market Volume (Units) Forecast, by Propulsion, 2017‒2031
Figure 68: Middle East & Africa Power Sports Market Value (US$ Bn) Forecast, by Propulsion, 2017‒2031
Figure 69: Middle East & Africa Power Sports Market, Incremental Opportunity, by Propulsion, Value (US$ Bn), 2022‒2031
Figure 70: Middle East & Africa Power Sports Market Volume (Units) Forecast, by Application, 2017‒2031
Figure 71: Middle East & Africa Power Sports Market Value (US$ Bn) Forecast, by Application, 2017‒2031
Figure 72: Middle East & Africa Power Sports Market, Incremental Opportunity, by Application, Value (US$ Bn), 2022‒2031
Figure 73: Middle East & Africa Power Sports Market Volume (Units) Forecast, by Country, 2017‒2031
Figure 74: Middle East & Africa Power Sports Market Value (US$ Bn) Forecast, by Country, 2017‒2031
Figure 75: Middle East & Africa Power Sports Market, Incremental Opportunity, by Country, Value (US$ Bn), 2022‒2031
Figure 76: South America Power Sports Market Volume (Units) Forecast, by Vehicle Type, 2017‒2031
Figure 77: South America Power Sports Market Value (US$ Bn) Forecast, by Vehicle Type, 2017‒2031
Figure 78: South America Power Sports Market, Incremental Opportunity, by Vehicle Type, Value (US$ Bn), 2022‒2031
Figure 79: South America Power Sports Market Volume (Units) Forecast, by Model, 2017‒2031
Figure 80: South America Power Sports Market Value (US$ Bn) Forecast, by Model, 2017‒2031
Figure 81: South America Power Sports Market, Incremental Opportunity, by Model, Value (US$ Bn), 2022‒2031
Figure 82: South America Power Sports Market Volume (Units) Forecast, by Propulsion, 2017‒2031
Figure 83: South America Power Sports Market Value (US$ Bn) Forecast, by Propulsion, 2017‒2031
Figure 84: South America Power Sports Market, Incremental Opportunity, by Propulsion, Value (US$ Bn), 2022‒2031
Figure 85: South America Power Sports Market Volume (Units) Forecast, by Application, 2017‒2031
Figure 86: South America Power Sports Market Value (US$ Bn) Forecast, by Application, 2017‒2031
Figure 87: South America Power Sports Market, Incremental Opportunity, by Application, Value (US$ Bn), 2022‒2031
Figure 88: South America Power Sports Market Volume (Units) Forecast, by Country, 2017‒2031
Figure 89: South America Power Sports Market Value (US$ Bn) Forecast, by Country, 2017‒2031
Figure 90: South America Power Sports Market, Incremental Opportunity, by Country, Value (US$ Bn), 2022‒2031
Copyright © Transparency Market Research, Inc. All Rights reserved
Trust Online

Power Sports Market