
Reports
Reports
Analysts’ Viewpoint on Portion Cup Market Scenario
The global portion cup market is anticipated to be driven by factors such as rise in environmental concerns, shift in consumer preference toward sustainability, implementation of stringent regulatory framework, and presence of favorable government policies. Introduction of portion cups is a significant step toward recycling the usage of plastics due to environmental concerns. Sustainable material-based portion cups provide several benefits including reduced carbon footprint and easy composting. This is expected to boost the market over the next few years. Companies should increase their R&D activities for the manufacture of innovative and cost-effective products.
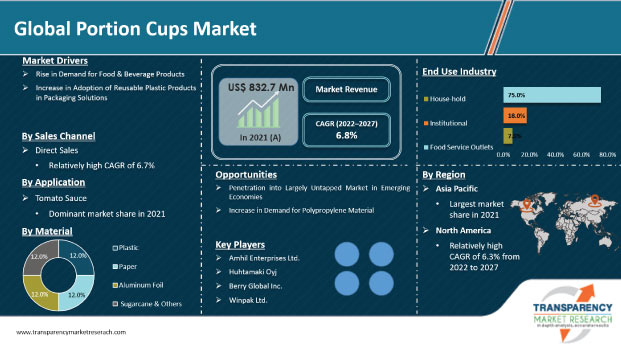
The portion cup market is expected to grow due to the rise in awareness about environmental protection and shift of consumers toward sustainable products. Increase in adoption of disposable plastics and enactment of regulatory frameworks by government agencies to curb plastic pollution are also likely to drive the portion cup market during the forecast period. The market is estimated to register a CAGR of 6.8% between 2022 and 2027. Portion cups are manufactured using recycled plastic, which significantly contributes to the prevention of plastic pollution. Thus, sales of portion cups are expected to increase significantly in the near future.
The packaging industry has been significantly impacted by COVID-19. The pandemic compelled manufacturers around the world to temporarily shut down their operations. Governments of countries around the world have now been opening up their borders to increase imports and exports, since COVID-19 cases have reduced drastically. The portion cup manufacturing industry is currently witnessing less stringency in terms of regulations and trade bans.
Recent developments in the portion cup market include rise in demand sentiment in various end-use industries. The portion cup market assessment suggests that the situation has returned to the pre-Covid-19 pandemic levels. According to the Global Plastic Industry Association, the plastic market in the U.S. contracted around 4%-5% during the pandemic. Nevertheless, plastic cup market opportunities include innovation in recyclable & bioplastic products and data-driven investment in new manufacturing technologies.
The packaging industry is the backbone of the food and beverages industry. Hot and cold foods can be processed in terms of the required size and shape to get the desired result. This is the key advantage of portion cups. The flexibility provided by plastic portion cups has attracted the attention of food and beverage product manufacturers.
The global portion cup market is driven by the growth of the food industry. Increase in demand for baked goods, sauces, and ice creams is expected to boost the portion cup market during the forecast period. Consumers are more likely to be attracted to relevant brands. Therefore, growth of the food and drink sector is augmenting the portion cup market.
Portion cups are sustainable in terms of production and materials. The plastic used in portion cups is usually recyclable. Packaging manufacturers offer reusable portion cups and jars that minimize supply chain costs. Durable and impact resistant reusable cups and glasses are currently being used in the food processing industry.
Polypropylene plastic products are heat resistant and help extend the life of the product. People prefer products that are sustainable and have less impact on the nature. Therefore, reusability and sustainability of polypropylene products is creating growth opportunities for players in the market.
Leading players in the global market are striving to expand their presence in developing regions. Acceptance of food retail and liquid items is rising significantly in emerging markets such as China. Sales of packaged foods have increased significantly of late. Regional players have been dominating the market in the U.S. and China. Increase in sale of portion cups in the food and beverages industry has compelled many international players to focus on the fast-growing economies in the world.
Thus, portion cup makers are focusing on diversifying their presence in new emerging markets through collaborations, mergers, and acquisitions. The outlook of the portion cup market appears promising. The sales channel in North America is projected to grow by 1.4x in the near future. The incremental opportunity for Asia Pacific is forecasted to stand at around US$ 31.7 Mn by 2027.
Emerging markets for portion cups, such as the U.S. and Japan, are likely to account for approximately 40%-45% share of the global market by the end of the forecast period. Ban on disposable plastics and increase in adoption of reusable plastics are likely to drive the demand for portion cups in these countries. Additionally, favorable government policies and efforts to reduce plastic waste are expected to boost the demand for portion cups in these countries throughout the forecast period.
Polypropylene is a pre-formed plastic packaging used for sauce, bakery items, and ice creams. Polypropylene cups are generally a cost-effective way of displaying products. Both hot and cold food can be served in these cups.
The portion cup market drivers encompass several advantages of polypropylene. The clear, protective, and polypropylene plastic packaging provides customers with a fully enabled view of a product. The polypropylene material type segment is anticipated to reach US$ 661.2 Mn by the end of the forecast period.
The quick-service industry is playing an important role in driving the demand for portion cups, as food needs to be served on a quick basis within a limited period in this industry. Therefore, disposable containers are used to serve food.
Generally, the fast food industry comes under the quick service category. Restaurants in this category need to save upon the time spent on washing and other food preparation activities. Large numbers of people visit such restaurants. Therefore, disposable plates are preferred. The quick service industry primarily focuses on the speed of service, affordability, and convenience of customers.
Growth of the ice-cream industry directly impacts the portion cup market. People usually prefer a fresh scoop of ice-cream instead of packed ice-cream. The scoop of ice-cream is often served in cups.
Sales of ice-cream increase significantly in summer. Sellers use portion cups to meet the demand for scooped ice-cream. Large players in the ice-cream market use their brand names on portion cups. This attracts customers and facilitates the marketing of the ice-cream. The portion cup market is projected to reach around US$ 132.9 Mn in the ice-cream industry during the forecast period.
Plastic is widely used by manufacturers in portion cups due to its properties such as recyclability, durability, flexibility, and excellent printability. Plastic portion cup is durable and is usually not not tampered with as compared to other materials such as paper or aluminum-based cups. It is commonly used for hot and cold products.
Plastic portion cups are relatively cheaper than plastic products manufactured using the injection molding process. Design flexibility is an important feature of plastic portion cups. It allows manufacturers to create package designs that enhance product visibility and brand awareness. Thus, plastic is estimated to be the major material segment of the market during the forecast period.
Asia Pacific is the dominant region of the global portion cup market. The market in the region is expected to grow 1.6 times its current market value by the end of the forecast period. The region is likely to generate an incremental opportunity of US$ 158.3 Mn by 2027. Asia Pacific is one of the major single serve cup markets and is projected to record a maximum CAGR of 8.6% during the forecast period.
Europe is a mature market for portion cups. The market in the region is expected to grow moderately due to regulatory frameworks imposed by government agencies such as a ban on disposable plastics to control plastic waste.
The portion cup market report concludes with the company profiles section, which includes important information about key players in the global portion cup market.
Leading players operating in the market include Amhil Enterprises Ltd., Huhtamaki Oyj, Sonoco Products Company, Berry Global Inc., Dart Container Corporation, Genpak LLC, D&W Fine Pack LLC., Placon Corporation, Pactiv LLC., Georgia-Pacific Corp., Fabri-Kal Corporation., Winpak Ltd., Polar Pak Company, Eco-Products, Inc., Sabert Corporation, Graphic Packaging International, London Bio Packaging, Nature Works LLC, World Centric, and BSI Biodegradable Solution.
Each of these players has been profiled in the portion cup market report based on parameters such as company overview, financial overview, business strategies, application portfolio, business segments, and recent developments.
|
Attribute |
Detail |
|
Market Size Value in 2021 |
US$ 832.7 Mn |
|
Market Forecast Value in 2027 |
US$ 1,241.1 Mn |
|
Growth Rate (CAGR) |
6.8% from Year-to-Year |
|
Forecast Period |
2022–2027 |
|
Quantitative Units |
US$ Mn for Value |
|
Market Analysis |
It includes cross-segment analysis at the global as well as regional levels. Moreover, the qualitative analysis includes drivers, restraints, opportunities, key trends, and a parent industry overview. |
|
Competition Landscape |
Market share analysis by a company (2021) Company profiles section includes an overview, product portfolio, sales footprint, key subsidiaries or distributors, strategy & recent developments, and key financials |
|
Format |
Electronic (PDF) + Excel |
|
Market Segmentation |
|
|
Regions Covered |
|
|
Countries Covered |
|
|
Companies Profiled |
|
|
Customization Scope |
Available upon request |
|
Pricing |
Available upon request |
The global portion cups market was valued at US$ 832.7 Mn in 2021 and is expected to reach US$ 1,241.1 Mn by 2027.
The global portion cups market is expected to grow at a CAGR of 6.8% during the forecast period of 2022-2027.
Increase in consumer preference for sustainable products, rise in consumer awareness about environmental concerns, and emphasis on reusable packages are key factors expected to drive the market.
The portion cups market in Asia Pacific is likely to expand at the fastest CAGR during the forecast period.
The plastic segment is likely to generate the highest revenue in 2027.
Amhil Enterprises Ltd., Huhtamaki Oyj, Sonoco Products Company, Berry Global Inc., Dart Container Corporation, Genpak LLC, D&W Fine Pack LLC., Placon Corporation, and Pactiv LLC are the prominent players in the global market.
1. Executive Summary
1.1. Market Overview
1.2. Market Analysis
1.3. TMR Analysis and Recommendations
2. Market Viewpoint
2.1. Market Definition
2.2. Market Taxonomy
3. Portion Cup Market Overview
3.2. Global Portion Cup Market Overview
3.1. Introduction
3.3. Portion Cup Market (US$ Mn) and Forecast
3.4. Value Chain Analysis
3.4.1. Exhaustive List of Active Participants
3.4.1.1. Raw Material Suppliers
3.4.1.2. Portion Cup Manufacturers
3.4.1.3. End-users/Customers
3.4.2. Profitability Margins
4. Impact of COVID-19
4.1. Current Statistics and Probable Future Impact
4.2. Impact of COVID-19 on Target Industry
5. Portion Cup Market Analysis
5.1. Pricing Analysis
5.1.1. Pricing Assumption
5.1.2. Price Projections By Capacity
5.2. Market Size (US$ Mn) and Forecast
5.2.1. Market Size and Y-o-Y Growth
5.2.2. Absolute $ Opportunity
6. Portion Cup Market Dynamics
6.1. Drivers
6.2. Restraints
6.3. Opportunity Analysis
6.4. Trends
7. Global Portion Cup Market Analysis and Forecast, by Material Type
7.1. Introduction
7.1.1. Market share and Basis Points (BPS) Analysis, by Material Type
7.1.2. Y-o-Y Growth Projections, by Material Type
7.2. Historical Market Value (US$ Mn) and Volume (Units), 2015-2021, by Material Type
7.2.1. Plastic
7.2.1.1. Polypropylene
7.2.1.2. Polyethylene
7.2.1.2.1. HDPE
7.2.1.2.2. LDPE
7.2.1.3. Polyamide
7.2.1.4. Bioplastics
7.2.1.4.1. PLA
7.2.1.4.2. PHA
7.2.1.4.3. Starch Blend
7.2.1.5. Polyethylene terephthalate
7.2.1.6. Polystyrene
7.2.2. Paper
7.2.3. Aluminum foil
7.2.4. Sugarcane & Others
7.3. Market Size (US$ Mn) and Volume (Units) Forecast Analysis 2022-2027, by Material Type
7.3.1. Plastic
7.3.1.1. Polypropylene
7.3.1.2. Polyethylene
7.3.1.2.1. HDPE
7.3.1.2.2. LDPE
7.3.1.3. Polyamide
7.3.1.4. Bioplastics
7.3.1.4.1. PLA
7.3.1.4.2. PHA
7.3.1.4.3. Starch Blend
7.3.1.5. Polyethylene terephthalate
7.3.1.6. Polystyrene
7.3.2. Paper
7.3.3. Aluminum foil
7.3.4. Sugarcane & Others
7.4. Market Attractiveness Analysis, by Material Type
8. Global Portion Cup Market Analysis and Forecast, by Capacity
8.1. Introduction
8.1.1. Market share and Basis Points (BPS) Analysis, by Capacity
8.1.2. Y-o-Y Growth Projections, by Capacity
8.2. Historical Market Value (US$ Mn) and Volume (Units), 2015-2021, by Capacity
8.2.1. Less than 1 Oz
8.2.2. 1-2 Oz
8.2.3. 3-4 Oz
8.2.4. 4-5 Oz
8.2.5. Above 6 Oz
8.3. Market Size (US$ Mn) and Volume (Units) Forecast Analysis 2022-2027 By Capacity
8.3.1. Less than 1 Oz
8.3.2. 1-2 Oz
8.3.3. 3-4 Oz
8.3.4. 5-6 Oz
8.3.5. Above 6 Oz
8.4. Market Attractiveness Analysis, by Capacity
9. Global Portion Cup Market Analysis and Forecast, by Application
9.1. Introduction
9.1.1. Market share and Basis Points (BPS) Analysis, by Application
9.1.2. Y-o-Y Growth Projections, by Application
9.2. Historical Market Value (US$ Mn) and Volume (Units), 2015-2021, by Application
9.2.1. Barbeque Sauce
9.2.2. Tomato Sauce
9.2.3. Guacamole
9.2.4. Humus
9.2.5. Soups
9.2.6. Dressings or Toppings
9.2.7. Bakery and Confectionary
9.2.8. Dairy Products
9.2.9. Ice cream
9.2.10. Others
9.3. Market Size (US$ Mn) and Volume (Units) Forecast Analysis 2022-2027, by Application
9.3.1. Barbeque Sauce
9.3.2. Tomato Sauce
9.3.3. Guacamole
9.3.4. Humus
9.3.5. Soups
9.3.6. Dressings or Toppings
9.3.7. Bakery and Confectionary
9.3.8. Dairy Products
9.3.9. Ice cream
9.3.10. Others
9.4. Market Attractiveness Analysis, by Application
10. Global Portion Cup Market Analysis and Forecast, by Sales Channel
10.1. Introduction
10.1.1. Market share and Basis Points (BPS) Analysis, by Sales Channel
10.1.2. Y-o-Y Growth Projections, by Sales Channel
10.2. Historical Market Value (US$ Mn) and Volume (Units), 2015-2021, by Sales Channel
10.2.1. Direct Sales
10.2.2. Retailers
10.2.2.1. Hyper Market
10.2.2.2. Super Market
10.2.2.3. Convenience Stores
10.2.2.4. Speciality Stores
10.2.2.5. Discounted Stores
10.2.3. E-Retail
10.3. Market Size (US$ Mn) and Volume (Units) Forecast Analysis 2022-2027, by Sales Channel
10.3.1. Direct Sales
10.3.2. Retailers
10.3.2.1. Hyper Market
10.3.2.2. Super Market
10.3.2.3. Convenience Stores
10.3.2.4. Speciality Stores
10.3.2.5. Discounted Stores
10.3.3. E-Retail
10.4. Market Attractiveness Analysis, by Sales Channel
11. Global Portion Cup Market Analysis and Forecast, by End Use
11.1. Introduction
11.1.1. Market share and Basis Points (BPS) Analysis, by End Use
11.1.2. Y-o-Y Growth Projections, by End Use
11.2. Historical Market Value (US$ Mn) and Volume (Units), 2015-2021, by End Use
11.2.1. Food Service Outlet
11.2.1.1. Full Service Restaurants
11.2.1.2. Quick Service Restaurants
11.2.1.3. Ice Cream Vendors
11.2.2. Institutional Food Services
11.2.2.1. Cinemas
11.2.2.2. Airline & Railway Catering
11.2.2.3. Schools & Offices
11.2.2.4. Hospitals
11.2.3. Household Use
11.3. Market Size (US$ Mn) and Volume (Units) Forecast Analysis 2022-2027, by End Use
11.3.1. Food Service Outlet
11.3.1.1. Full Service Restaurants
11.3.1.2. Quick Service Restaurants
11.3.1.3. Ice Cream Vendors
11.3.2. Institutional Food Services
11.3.2.1. Cinemas
11.3.2.2. Airline & Railway Catering
11.3.2.3. Schools & Offices
11.3.2.4. Hospitals
11.3.3. Household Use
11.4. Market Attractiveness Analysis, by End Use
12. Global Portion Cup Market Analysis and Forecast, By Region
12.1. Introduction
12.1.1. Market share and Basis Points (BPS) Analysis By Region
12.1.2. Y-o-Y Growth Projections By Region
12.2. Historical Market Value (US$ Mn) and Volume (Units), 2015-2021, By Region
12.2.1. North America
12.2.2. Latin America
12.2.3. Europe
12.2.4. Asia Pacific (APAC)
12.2.5. Middle East and Africa (MEA)
12.3. Market Size (US$ Mn) and Volume (Units) Forecast Analysis 2022-2027 By Region
12.3.1. North America
12.3.2. Latin America
12.3.3. Europe
12.3.4. Asia Pacific (APAC)
12.3.5. Middle East and Africa (MEA)
12.4. Market Attractiveness Analysis By Region
13. North America Portion Cup Market Analysis and Forecast
13.1. Introduction
13.1.1. Market share and Basis Points (BPS) Analysis, By Country
13.1.2. Y-o-Y Growth Projections, By Country
13.2. Historical Market Value (US$ Mn) and Volume (Units), 2015-2021, By Country
13.3. Market Size (US$ Mn) and Volume (Units) Forecast Analysis 2022-2027, By Country
13.3.1. U.S.
13.3.2. Canada
13.4. Historical Market Value (US$ Mn) and Volume (Units), 2015-2021, By Material Type
13.5. Market Size (US$ Mn) and Volume (Units) Forecast Analysis 2022-2027, By Material Type
13.5.1. Plastic
13.5.1.1. Polypropylene
13.5.1.2. Polyethylene
13.5.1.2.1. HDPE
13.5.1.2.2. LDPE
13.5.1.3. Polyamide
13.5.1.4. Bioplastics
13.5.1.4.1. PLA
13.5.1.4.2. PHA
13.5.1.4.3. Starch Blend
13.5.1.5. Polyethylene terephthalate
13.5.1.6. Polystyrene
13.5.2. Paper
13.5.3. Aluminum foil
13.5.4. Sugarcane & Others
13.6. Historical Market Value (US$ Mn) and Volume (Units), 2015-2021, By Capacity
13.7. Market Size (US$ Mn) and Volume (Units) Forecast Analysis 2022-2027, By Capacity
13.7.1. Less than 1 Oz
13.7.2. 1-2 Oz
13.7.3. 3-4 Oz
13.7.4. 5-6 Oz
13.7.5. Above 6 Oz
13.8. Historical Market Value (US$ Mn) and Volume (Units), 2015-2021, By Application
13.9. Market Size (US$ Mn) and Volume (Units) Forecast Analysis 2022-2027, By Application
13.9.1. Barbeque Sauce
13.9.2. Tomato Sauce
13.9.3. Guacamole
13.9.4. Humus
13.9.5. Soups
13.9.6. Dressings or Toppings
13.9.7. Bakery and Confectionary
13.9.8. Dairy Products
13.9.9. Ice cream
13.9.10. Others
13.10. Historical Market Value (US$ Mn) and Volume (Units), 2015-2021, By Sales Channel
13.11. Market Size (US$ Mn) and Volume (Units) Forecast Analysis 2022-2027, By Sales Channel
13.11.1. Direct Sales
13.11.2. Retailers
13.11.2.1. Hyper Market
13.11.2.2. Super Market
13.11.2.3. Convenience Stores
13.11.2.4. Speciality Stores
13.11.2.5. Discounted Stores
13.11.3. E-Retail
13.12. Historical Market Value (US$ Mn) and Volume (Units), 2015-2021, By End Use
13.13. Market Size (US$ Mn) and Volume (Units) Forecast Analysis 2022-2027, By End Use
13.13.1. Food Service Outlet
13.13.1.1. Full Service Restaurants
13.13.1.2. Quick Service Restaurants
13.13.1.3. Ice Cream Vendors
13.13.2. Institutional Food Services
13.13.2.1. Cinemas
13.13.2.2. Airline & Railway Catering
13.13.2.3. Schools & Offices
13.13.2.4. Hospitals
13.13.3. Household Use
13.14. Market Attractiveness Analysis
13.14.1. By Country
13.14.2. By Material Type
13.14.3. By Capacity
13.14.4. By Application
13.14.5. By Sales Channel
13.14.6. By End Use
14. Latin America Portion Cup Market Analysis and Forecast
14.1. Introduction
14.1.1. Market share and Basis Points (BPS) Analysis, By Country
14.1.2. Y-o-Y Growth Projections, By Country
14.2. Historical Market Value (US$ Mn) and Volume (Units), 2015-2021, By Country
14.3. Market Size (US$ Mn) and Volume (Units) Forecast Analysis 2022-2027, By Country
14.3.1. Brazil
14.3.2. Mexico
14.3.3. Argentina
14.3.4. Rest of Latin America
14.4. Historical Market Value (US$ Mn) and Volume (Units), 2015-2021, By Material Type
14.5. Market Size (US$ Mn) and Volume (Units) Forecast Analysis 2022-2027, By Material Type
14.5.1. Plastic
14.5.1.1. Polypropylene
14.5.1.2. Polyethylene
14.5.1.2.1. HDPE
14.5.1.2.2. LDPE
14.5.1.3. Polyamide
14.5.1.4. Bioplastics
14.5.1.4.1. PLA
14.5.1.4.2. PHA
14.5.1.4.3. Starch Blend
14.5.1.5. Polyethylene terephthalate
14.5.1.6. Polystyrene
14.5.2. Paper
14.5.3. Aluminum foil
14.5.4. Sugarcane & Others
14.6. Historical Market Value (US$ Mn) and Volume (Units), 2015-2021, By Capacity
14.7. Market Size (US$ Mn) and Volume (Units) Forecast Analysis 2022-2027, By Capacity
14.7.1. Less than 1 Oz
14.7.2. 1-2 Oz
14.7.3. 3-4 Oz
14.7.4. 5-6 Oz
14.7.5. Above 6 Oz
14.8. Historical Market Value (US$ Mn) and Volume (Units), 2015-2021, By Application
14.9. Market Size (US$ Mn) and Volume (Units) Forecast Analysis 2022-2027, By Application
14.9.1. Barbeque Sauce
14.9.2. Tomato Sauce
14.9.3. Guacamole
14.9.4. Humus
14.9.5. Soups
14.9.6. Dressings or Toppings
14.9.7. Bakery and Confectionary
14.9.8. Dairy Products
14.9.9. Ice cream
14.9.10. Others
14.10. Historical Market Value (US$ Mn) and Volume (Units), 2015-2021, By Sales Channel
14.11. Market Size (US$ Mn) and Volume (Units) Forecast Analysis 2022-2027, By Sales Channel
14.11.1. Direct Sales
14.11.2. Retailers
14.11.2.1. Hyper Market
14.11.2.2. Super Market
14.11.2.3. Convenience Stores
14.11.2.4. Speciality Stores
14.11.2.5. Discounted Stores
14.11.3. E-Retail
14.12. Historical Market Value (US$ Mn) and Volume (Units), 2015-2021, By End Use
14.13. Market Size (US$ Mn) and Volume (Units) Forecast Analysis 2022-2027, By End Use
14.13.1. Food Service Outlet
14.13.1.1. Full Service Restaurants
14.13.1.2. Quick Service Restaurants
14.13.1.3. Ice Cream Vendors
14.13.2. Institutional Food Services
14.13.2.1. Cinemas
14.13.2.2. Airline & Railway Catering
14.13.2.3. Schools & Offices
14.13.2.4. Hospitals
14.13.3. Household Use
14.14. Market Attractiveness Analysis
14.14.1. By Country
14.14.2. By Material Type
14.14.3. By Capacity
14.14.4. By Application
14.14.5. By Sales Channel
14.14.6. By End Use
15. Europe Portion Cup Market Analysis and Forecast
15.1. Introduction
15.1.1. Market share and Basis Points (BPS) Analysis, By Country
15.1.2. Y-o-Y Growth Projections, By Country
15.2. Historical Market Value (US$ Mn) and Volume (Units), 2015-2021, By Country
15.3. Market Size (US$ Mn) and Volume (Units) Forecast Analysis 2022-2027, By Country
15.3.1. Germany
15.3.2. Spain
15.3.3. Italy
15.3.4. France
15.3.5. U.K.
15.3.6. Benelux
15.3.7. Nordic
15.3.8. Russia
15.3.9. Poland
15.3.10. Rest of Europe
15.4. Historical Market Value (US$ Mn) and Volume (Units), 2015-2021, By Material Type
15.5. Market Size (US$ Mn) and Volume (Units) Forecast Analysis 2022-2027, By Material Type
15.5.1. Plastic
15.5.1.1. Polypropylene
15.5.1.2. Polyethylene
15.5.1.2.1. HDPE
15.5.1.2.2. LDPE
15.5.1.3. Polyamide
15.5.1.4. Bioplastics
15.5.1.4.1. PLA
15.5.1.4.2. PHA
15.5.1.4.3. Starch Blend
15.5.1.5. Polyethylene terephthalate
15.5.1.6. Polystyrene
15.5.2. Paper
15.5.3. Aluminum foil
15.5.4. Sugarcane & Others
15.6. Historical Market Value (US$ Mn) and Volume (Units), 2015-2021, By Capacity
15.7. Market Size (US$ Mn) and Volume (Units) Forecast Analysis 2022-2027, By Capacity
15.7.1. Less than 1 Oz
15.7.2. 1-2 Oz
15.7.3. 3-4 Oz
15.7.4. 5-6 Oz
15.7.5. Above 6 Oz
15.8. Historical Market Value (US$ Mn) and Volume (Units), 2015-2021, By Application
15.9. Market Size (US$ Mn) and Volume (Units) Forecast Analysis 2022-2027, By Application
15.9.1. Barbeque Sauce
15.9.2. Tomato Sauce
15.9.3. Guacamole
15.9.4. Humus
15.9.5. Soups
15.9.6. Dressings or Toppings
15.9.7. Bakery and Confectionary
15.9.8. Dairy Products
15.9.9. Ice cream
15.9.10. Others
15.10. Historical Market Value (US$ Mn) and Volume (Units), 2015-2021, By Sales Channel
15.11. Market Size (US$ Mn) and Volume (Units) Forecast Analysis 2022-2027, By Sales Channel
15.11.1. Direct Sales
15.11.2. Retailers
15.11.2.1. Hyper Market
15.11.2.2. Super Market
15.11.2.3. Convenience Stores
15.11.2.4. Speciality Stores
15.11.2.5. Discounted Stores
15.11.3. E-Retail
15.12. Historical Market Value (US$ Mn) and Volume (Units), 2015-2021, By End Use
15.13. Market Size (US$ Mn) and Volume (Units) Forecast Analysis 2022-2027, By End Use
15.13.1. Food Service Outlet
15.13.1.1. Full Service Restaurants
15.13.1.2. Quick Service Restaurants
15.13.1.3. Ice Cream Vendors
15.13.2. Institutional Food Services
15.13.2.1. Cinemas
15.13.2.2. Airline & Railway Catering
15.13.2.3. Schools & Offices
15.13.2.4. Hospitals
15.13.3. Household Use
15.14. Market Attractiveness Analysis
15.14.1. By Country
15.14.2. By Material Type
15.14.3. By Capacity
15.14.4. By Application
15.14.5. By Sales Channel
15.14.6. By End Use
16. Asia Pacific Portion Cup Market Analysis and Forecast
16.1. Introduction
16.1.1. Market share and Basis Points (BPS) Analysis, By Country
16.1.2. Y-o-Y Growth Projections, By Country
16.2. Historical Market Value (US$ Mn) and Volume (Units), 2015-2021, By Country
16.3. Market Size (US$ Mn) and Volume (Units) Forecast Analysis 2022-2027, By Country
16.3.1. China
16.3.2. India
16.3.3. Japan
16.3.4. South Korea
16.3.5. ASEAN
16.3.6. Australia & New Zealand
16.3.7. Rest of Asia Pacific
16.4. Historical Market Value (US$ Mn) and Volume (Units), 2015-2021, By Material Type
16.5. Market Size (US$ Mn) and Volume (Units) Forecast Analysis 2022-2027, By Material Type
16.5.1. Plastic
16.5.1.1. Polypropylene
16.5.1.2. Polyethylene
16.5.1.2.1. HDPE
16.5.1.2.2. LDPE
16.5.1.3. Polyamide
16.5.1.4. Bioplastics
16.5.1.4.1. PLA
16.5.1.4.2. PHA
16.5.1.4.3. Starch Blend
16.5.1.5. Polyethylene terephthalate
16.5.1.6. Polystyrene
16.5.2. Paper
16.5.3. Aluminum foil
16.5.4. Sugarcane & Others
16.6. Historical Market Value (US$ Mn) and Volume (Units), 2015-2021, By Capacity
16.7. Market Size (US$ Mn) and Volume (Units) Forecast Analysis 2022-2027, By Capacity
16.7.1. Less than 1 Oz
16.7.2. 1-2 Oz
16.7.3. 3-4 Oz
16.7.4. 5-6 Oz
16.7.5. Above 6 Oz
16.8. Historical Market Value (US$ Mn) and Volume (Units), 2015-2021, By Application
16.9. Market Size (US$ Mn) and Volume (Units) Forecast Analysis 2022-2027, By Application
16.9.1. Barbeque Sauce
16.9.2. Tomato Sauce
16.9.3. Guacamole
16.9.4. Humus
16.9.5. Soups
16.9.6. Dressings or Toppings
16.9.7. Bakery and Confectionary
16.9.8. Dairy Products
16.9.9. Ice cream
16.9.10. Others
16.10. Historical Market Value (US$ Mn) and Volume (Units), 2015-2021, By Sales Channel
16.11. Market Size (US$ Mn) and Volume (Units) Forecast Analysis 2022-2027, By Sales Channel
16.11.1. Direct Sales
16.11.2. Retailers
16.11.2.1. Hyper Market
16.11.2.2. Super Market
16.11.2.3. Convenience Stores
16.11.2.4. Speciality Stores
16.11.2.5. Discounted Stores
16.11.3. E-Retail
16.12. Historical Market Value (US$ Mn) and Volume (Units), 2015-2021, By End Use
16.13. Market Size (US$ Mn) and Volume (Units) Forecast Analysis 2022-2027, By End Use
16.13.1. Food Service Outlet
16.13.1.1. Full Service Restaurants
16.13.1.2. Quick Service Restaurants
16.13.1.3. Ice Cream Vendors
16.13.2. Institutional Food Services
16.13.2.1. Cinemas
16.13.2.2. Airline & Railway Catering
16.13.2.3. Schools & Offices
16.13.2.4. Hospitals
16.13.3. Household Use
16.14. Market Attractiveness Analysis
16.14.1. By Country
16.14.2. By Material Type
16.14.3. By Capacity
16.14.4. By Application
16.14.5. By Sales Channel
16.14.6. By End Use
17. Middle East & Africa Portion Cup Market Analysis and Forecast
17.1. Introduction
17.1.1. Market share and Basis Points (BPS) Analysis, By Country
17.1.2. Y-o-Y Growth Projections, By Country
17.2. Historical Market Value (US$ Mn) and Volume (Units), 2015-2021, By Country
17.3. Market Size (US$ Mn) and Volume (Units) Forecast Analysis 2022-2027, By Country
17.3.1. Northern Africa
17.3.2. South Africa
17.3.3. Turkey
17.3.4. GCC Countries
17.3.5. Rest of MEA
17.4. Historical Market Value (US$ Mn) and Volume (Units), 2015-2021, By Material Type
17.5. Market Size (US$ Mn) and Volume (Units) Forecast Analysis 2022-2027, By Material Type
17.5.1. Plastic
17.5.1.1. Polypropylene
17.5.1.2. Polyethylene
17.5.1.2.1. HDPE
17.5.1.2.2. LDPE
17.5.1.3. Polyamide
17.5.1.4. Bioplastics
17.5.1.4.1. PLA
17.5.1.4.2. PHA
17.5.1.4.3. Starch Blend
17.5.1.5. Polyethylene terephthalate
17.5.1.6. Polystyrene
17.5.2. Paper
17.5.3. Aluminum foil
17.5.4. Sugarcane & Others
17.6. Historical Market Value (US$ Mn) and Volume (Units), 2015-2021, By Capacity
17.7. Market Size (US$ Mn) and Volume (Units) Forecast Analysis 2022-2027, By Capacity
17.7.1. Less than 1 Oz
17.7.2. 1-2 Oz
17.7.3. 3-4 Oz
17.7.4. 5-6 Oz
17.7.5. Above 6 Oz
17.8. Historical Market Value (US$ Mn) and Volume (Units), 2015-2021, By Application
17.9. Market Size (US$ Mn) and Volume (Units) Forecast Analysis 2022-2027, By Application
17.9.1. Barbeque Sauce
17.9.2. Tomato Sauce
17.9.3. Guacamole
17.9.4. Humus
17.9.5. Soups
17.9.6. Dressings or Toppings
17.9.7. Bakery and Confectionary
17.9.8. Dairy Products
17.9.9. Ice cream
17.9.10. Others
17.10. Historical Market Value (US$ Mn) and Volume (Units), 2015-2021, By Sales Channel
17.11. Market Size (US$ Mn) and Volume (Units) Forecast Analysis 2022-2027, By Sales Channel
17.11.1. Direct Sales
17.11.2. Retailers
17.11.2.1. Hyper Market
17.11.2.2. Super Market
17.11.2.3. Convenience Stores
17.11.2.4. Speciality Stores
17.11.2.5. Discounted Stores
17.11.3. E-Retail
17.12. Historical Market Value (US$ Mn) and Volume (Units), 2015-2021, By End Use
17.13. Market Size (US$ Mn) and Volume (Units) Forecast Analysis 2022-2027, By End Use
17.13.1. Food Service Outlet
17.13.1.1. Full Service Restaurants
17.13.1.2. Quick Service Restaurants
17.13.1.3. Ice Cream Vendors
17.13.2. Institutional Food Services
17.13.2.1. Cinemas
17.13.2.2. Airline & Railway Catering
17.13.2.3. Schools & Offices
17.13.2.4. Hospitals
17.13.3. Household Use
17.14. Market Attractiveness Analysis
17.14.1. By Country
17.14.2. By Material Type
17.14.3. By Capacity
17.14.4. By Application
17.14.5. By Sales Channel
17.14.6. By End Use
18. Country-wise Analysis and Forecast for Portion Cup Market
18.1. United States (U.S.) Portion Cup Market Analysis 2022 & 2027
18.1.1. Market Value (US$ Mn) & Volume (Units) Analysis and Forecast by Market Taxonomy
18.1.1.1. By Material Type
18.1.1.2. By Capacity
18.1.1.3. By Application
18.1.1.4. By Sales Channel
18.1.1.5. By End Use
18.2. Brazil Portion Cup Market Analysis 2022 & 2027
18.2.1. Market Value (US$ Mn) & Volume (Units) Analysis and Forecast by Market Taxonomy
18.2.1.1. By Material Type
18.2.1.2. By Capacity
18.2.1.3. By Application
18.2.1.4. By Sales Channel
18.2.1.5. By End Use
18.3. Mexico Portion Cup Market Analysis 2022 & 2027
18.3.1. Market Value (US$ Mn) & Volume (Units) Analysis and Forecast by Market Taxonomy
18.3.1.1. By Material Type
18.3.1.2. By Capacity
18.3.1.3. By Application
18.3.1.4. By Sales Channel
18.3.1.5. By End Use
18.4. Germany Portion Cup Market Analysis 2022 & 2027
18.4.1. Market Value (US$ Mn) & Volume (Units) Analysis and Forecast by Market Taxonomy
18.4.1.1. By Material Type
18.4.1.2. By Capacity
18.4.1.3. By Application
18.4.1.4. By Sales Channel
18.4.1.5. By End Use
18.5. France Portion Cup Market Analysis 2022 & 2027
18.5.1. Market Value (US$ Mn) & Volume (Units) Analysis and Forecast by Market Taxonomy
18.5.1.1. By Material Type
18.5.1.2. By Capacity
18.5.1.3. By Application
18.5.1.4. By Sales Channel
18.5.1.5. By End Use
18.6. United Kingdom (U.K.) Portion Cup Market Analysis 2022 & 2027
18.6.1. Market Value (US$ Mn) & Volume (Units) Analysis and Forecast by Market Taxonomy
18.6.1.1. By Material Type
18.6.1.2. By Capacity
18.6.1.3. By Application
18.6.1.4. By Sales Channel
18.6.1.5. By End Use
18.7. Russia Portion Cup Market Analysis 2022 & 2027
18.7.1. Market Value (US$ Mn) & Volume (Units) Analysis and Forecast by Market Taxonomy
18.7.1.1. By Material Type
18.7.1.2. By Capacity
18.7.1.3. By Application
18.7.1.4. By Sales Channel
18.7.1.5. By End Use
18.8. China Portion Cup Market Analysis 2022 & 2027
18.8.1. Market Value (US$ Mn) & Volume (Units) Analysis and Forecast by Market Taxonomy
18.8.1.1. By Material Type
18.8.1.2. By Capacity
18.8.1.3. By Application
18.8.1.4. By Sales Channel
18.8.1.5. By End Use
18.9. India Portion Cup Market Analysis 2022 & 2027
18.9.1. Market Value (US$ Mn) & Volume (Units) Analysis and Forecast by Market Taxonomy
18.9.1.1. By Material Type
18.9.1.2. By Capacity
18.9.1.3. By Application
18.9.1.4. By Sales Channel
18.9.1.5. By End Use
18.10. Japan Portion Cup Market Analysis 2022 & 2027
18.10.1. Market Value (US$ Mn) & Volume (Units) Analysis and Forecast by Market Taxonomy
18.10.1.1. By Material Type
18.10.1.2. By Capacity
18.10.1.3. By Application
18.10.1.4. By Sales Channel
18.10.1.5. By End Use
18.11. GCC Countries Portion Cup Market Analysis 2022 & 2027
18.11.1. Market Value (US$ Mn) & Volume (Units) Analysis and Forecast by Market Taxonomy
18.11.1.1. By Material Type
18.11.1.2. By Capacity
18.11.1.3. By Application
18.11.1.4. By Sales Channel
18.11.1.5. By End Use
18.12. Northern Africa Portion Cup Market Analysis 2022 & 2027
18.12.1. Market Value (US$ Mn) & Volume (Units) Analysis and Forecast by Market Taxonomy
18.12.1.1. By Material Type
18.12.1.2. By Capacity
18.12.1.3. By Application
18.12.1.4. By Sales Channel
18.12.1.5. By End Use
19. Competitive Landscape
19.1. Market Structure
19.2. Competition Dashboard
19.3. Company Market Share Analysis
19.4. Company Profiles (Details – Overview, Financials, Strategy, Recent Developments, SWOT analysis)
19.5. Competition Deep Dive
19.5.1. Amhil Enterprises Ltd
19.5.1.1. Overview
19.5.1.2. Financials
19.5.1.3. Strategy
19.5.1.4. Recent Developments
19.5.1.5. SWOT Analysis
19.5.2. Huhtamaki Oyj
19.5.2.1. Overview
19.5.2.2. Financials
19.5.2.3. Strategy
19.5.2.4. Recent Developments
19.5.2.5. SWOT Analysis
19.5.3. Sonoco Products Company.
19.5.3.1. Overview
19.5.3.2. Financials
19.5.3.3. Strategy
19.5.3.4. Recent Developments
19.5.3.5. SWOT Analysis
19.5.4. Berry Global Inc.
19.5.4.1. Overview
19.5.4.2. Financials
19.5.4.3. Strategy
19.5.4.4. Recent Developments
19.5.4.5. SWOT Analysis
19.5.5. Dart Container Corporation
19.5.5.1. Overview
19.5.5.2. Financials
19.5.5.3. Strategy
19.5.5.4. Recent Developments
19.5.5.5. SWOT Analysis
19.5.6. Genpak LLC
19.5.6.1. Overview
19.5.6.2. Financials
19.5.6.3. Strategy
19.5.6.4. Recent Developments
19.5.6.5. SWOT Analysis
19.5.7. D&W Fine Pack LLC
19.5.7.1. Overview
19.5.7.2. Financials
19.5.7.3. Strategy
19.5.7.4. Recent Developments
19.5.7.5. SWOT Analysis
19.5.8. Placon Corporation
19.5.8.1. Overview
19.5.8.2. Financials
19.5.8.3. Strategy
19.5.8.4. Recent Developments
19.5.8.5. SWOT Analysis
19.5.9. Pactiv LLC
19.5.9.1. Overview
19.5.9.2. Financials
19.5.9.3. Strategy
19.5.9.4. Recent Developments
19.5.9.5. SWOT Analysis
19.5.10. Georgia-Pacific Corp
19.5.10.1. Overview
19.5.10.2. Financials
19.5.10.3. Strategy
19.5.10.4. Recent Developments
19.5.10.5. SWOT Analysis
19.5.11. Fabri-Kal Corporation
19.5.11.1. Overview
19.5.11.2. Financials
19.5.11.3. Strategy
19.5.11.4. Recent Developments
19.5.11.5. SWOT Analysis
19.5.12. Winpak Ltd
19.5.12.1. Overview
19.5.12.2. Financials
19.5.12.3. Strategy
19.5.12.4. Recent Developments
19.5.12.5. SWOT Analysis
19.5.13. Polar Pack Company
19.5.13.1. Overview
19.5.13.2. Financials
19.5.13.3. Strategy
19.5.13.4. Recent Developments
19.5.13.5. SWOT Analysis
19.5.14. Eco-product Inc.
19.5.14.1. Overview
19.5.14.2. Financials
19.5.14.3. Strategy
19.5.14.4. Recent Developments
19.5.14.5. SWOT Analysis
19.5.15. Sabert Corporation
19.5.15.1. Overview
19.5.15.2. Financials
19.5.15.3. Strategy
19.5.15.4. Recent Developments
19.5.15.5. SWOT Analysis
19.5.16. Graphic Packaging International
19.5.16.1. Overview
19.5.16.2. Financials
19.5.16.3. Strategy
19.5.16.4. Recent Developments
19.5.16.5. SWOT Analysis
19.5.17. London Bio Packaging
19.5.17.1. Overview
19.5.17.2. Financials
19.5.17.3. Strategy
19.5.17.4. Recent Developments
19.5.17.5. SWOT Analysis
19.5.18. Nature Work LLC
19.5.18.1. Overview
19.5.18.2. Financials
19.5.18.3. Strategy
19.5.18.4. Recent Developments
19.5.18.5. SWOT Analysis
19.5.19. World Centric
19.5.19.1. Overview
19.5.19.2. Financials
19.5.19.3. Strategy
19.5.19.4. Recent Developments
19.5.19.5. SWOT Analysis
19.5.20. BSI Biodegradable Solution
19.5.20.1. Overview
19.5.20.2. Financials
19.5.20.3. Strategy
19.5.20.4. Recent Developments
19.5.20.5. SWOT Analysis
20. Assumptions and Acronyms Used
21. Research Methodology
List of Tables
Table 1: Global Portion Cup Market Value (US$ Mn) and Volume (Mn Units) Forecast, by Material, 2014H – 2027F
Table 2: Global Portion Cup Market Value (US$ Mn) and Volume (Mn Units) Forecast, by Plastic Material Segment, 2014H – 2027F
Table 3: Global Portion Cup Market Value (US$ Mn) and Volume (Mn Units) Forecast, by Capacity, 2014H – 2027F
Table 4: Global Portion Cup Market Value (US$ Mn) and Volume (Mn Units) Forecast, by Application 2014H – 2027F
Table 5: Global Portion Cup Market Value (US$ Mn) and Volume (Mn Units) Forecast, by Sales Channel, 2014H – 2027F
Table 6: Global Portion Cup Market Value (US$ Mn) and Volume (Mn Units) Forecast, by End Use, 2014H – 2027F
Table 7: Global Portion Cup Market Value (US$ Mn) and Volume (Mn Units) Forecast, by Country, 2014H – 2027F
Table 8: North America Portion Cup Market Value (US$ Mn) and Volume (Mn Units) Forecast, by Material, 2014H – 2027F
Table 9: North America Portion Cup Market Value (US$ Mn) and Volume (Mn Units) Forecast, by Plastic Material Segment, 2014H – 2027F
Table 10: North America Portion Cup Market Value (US$ Mn) and Volume (Mn Units) Forecast, by Capacity, 2014H – 2027F
Table 11: North America Portion Cup Market Value (US$ Mn) and Volume (Mn Units) Forecast, by Application 2014H – 2027F
Table 12: North America Portion Cup Market Value (US$ Mn) and Volume (Mn Units) Forecast, by Sales Channel, 2014H – 2027F
Table 13: North America Portion Cup Market Value (US$ Mn) and Volume (Mn Units) Forecast, by End Use, 2014H – 2027F
Table 14: North America Portion Cup Market Value (US$ Mn) and Volume (Mn Units) Forecast, by Country, 2014H – 2027F
Table 15: Latin America Portion Cup Market Value (US$ Mn) and Volume (Mn Units) Forecast, by Material, 2014H – 2027F
Table 16: Latin America Portion Cup Market Value (US$ Mn) and Volume (Mn Units) Forecast, by Plastic Material Segment, 2014H – 2027F
Table 17: Latin America Portion Cup Market Value (US$ Mn) and Volume (Mn Units) Forecast, by Capacity, 2014H – 2027F
Table 18: Latin America Portion Cup Market Value (US$ Mn) and Volume (Mn Units) Forecast, by Application 2014H – 2027F
Table 19: Latin America Portion Cup Market Value (US$ Mn) and Volume (Mn Units) Forecast, by Sales Channel, 2014H – 2027F
Table 20: Latin America Portion Cup Market Value (US$ Mn) and Volume (Mn Units) Forecast, by End Use, 2014H – 2027F
Table 21: Latin America Portion Cup Market Value (US$ Mn) and Volume (Mn Units) Forecast, by Country, 2014H – 2027F
Table 22: Europe Portion Cup Market Value (US$ Mn) and Volume (Mn Units) Forecast, by Material, 2014H – 2027F
Table 23: Europe Portion Cup Market Value (US$ Mn) and Volume (Mn Units) Forecast, by Plastic Material Segment, 2014H – 2027F
Table 24: Europe Portion Cup Market Value (US$ Mn) and Volume (Mn Units) Forecast, by Capacity, 2014H – 2027F
Table 25: Europe Portion Cup Market Value (US$ Mn) and Volume (Mn Units) Forecast, by Application 2014H – 2027F
Table 26: Europe Portion Cup Market Value (US$ Mn) and Volume (Mn Units) Forecast, by Sales Channel, 2014H – 2027F
Table 27: Europe Portion Cup Market Value (US$ Mn) and Volume (Mn Units) Forecast, by End Use, 2014H – 2027F
Table 28: Europe Portion Cup Market Value (US$ Mn) and Volume (Mn Units) Forecast, by Country, 2014H – 2027F
Table 29: Asia Pacific Portion Cup Market Value (US$ Mn) and Volume (Mn Units) Forecast, by Material, 2014H – 2027F
Table 30: Asia Pacific Portion Cup Market Value (US$ Mn) and Volume (Mn Units) Forecast, by Plastic Material Segment, 2014H – 2027F
Table 31: Asia Pacific Portion Cup Market Value (US$ Mn) and Volume (Mn Units) Forecast, by Capacity, 2014H – 2027F
Table 32: Asia Pacific Portion Cup Market Value (US$ Mn) and Volume (Mn Units) Forecast, by Application 2014H – 2027F
Table 33: Asia Pacific Portion Cup Market Value (US$ Mn) and Volume (Mn Units) Forecast, by Sales Channel, 2014H – 2027F
Table 34: Asia Pacific Portion Cup Market Value (US$ Mn) and Volume (Mn Units) Forecast, by End Use, 2014H – 2027F
Table 35: Asia Pacific Portion Cup Market Value (US$ Mn) and Volume (Mn Units) Forecast, by Country, 2014H – 2027F
Table 36: MEA Portion Cup Market Value (US$ Mn) and Volume (Mn Units) Forecast, by Material, 2014H – 2027F
Table 37: MEA Portion Cup Market Value (US$ Mn) and Volume (Mn Units) Forecast, by Plastic Material Segment, 2014H – 2027F
Table 38: MEA Portion Cup Market Value (US$ Mn) and Volume (Mn Units) Forecast, by Capacity, 2014H – 2027F
Table 39: MEA Portion Cup Market Value (US$ Mn) and Volume (Mn Units) Forecast, by Application 2014H – 2027F
Table 40: MEA Portion Cup Market Value (US$ Mn) and Volume (Mn Units) Forecast, by Sales Channel, 2014H – 2027F
Table 41: MEA Portion Cup Market Value (US$ Mn) and Volume (Mn Units) Forecast, by End Use, 2014H – 2027F
Table 42: MEA Portion Cup Market Value (US$ Mn) and Volume (Mn Units) Forecast, by Country, 2014H – 2027F
List of Figures
Figure 01: Global Portion Cup Market Share Analysis by Material Type, 2022E & 2027F
Figure 02: Global Portion Cup Market Attractiveness Analysis by Material Type, 2022E-2027F
Figure 03: Global Portion Cup Market Y-o-Y Analysis by Material Type, 2019H-2027F
Figure 04: Global Portion Cup Market Share Analysis by Capacity, 2022E & 2027F
Figure 05: Global Portion Cup Market Attractiveness Analysis by Capacity, 2022E-2027F
Figure 06: Global Portion Cup Market Y-o-Y Analysis by Capacity, 2019H-2027F
Figure 07: Global Portion Cup Market Share Analysis by Application, 2022E & 2027F
Figure 08: Global Portion Cup Market Attractiveness Analysis by Application, 2022E-2027F
Figure 09: Global Portion Cup Market Y-o-Y Analysis by Application, 2019H-2027F
Figure 10: Global Portion Cup Market Share Analysis by Sales Channel, 2022E & 2027F
Figure 11: Global Portion Cup Market Attractiveness Analysis by Sales Channel, 2022E-2027F
Figure 12: Global Portion Cup Market Y-o-Y Analysis by Sales Channel, 2019H-2027F
Figure 13: Global Portion Cup Market Share Analysis by End Use, 2022E & 2027F
Figure 14: Global Portion Cup Market Attractiveness Analysis by End Use, 2022E-2027F
Figure 15: Global Portion Cup Market Y-o-Y Analysis by End Use, 2019H-2027F
Figure 16: Global Portion Cup Market Share Analysis by Region, 2022E & 2027F
Figure 17: Global Portion Cup Market Attractiveness Analysis by Region, 2022E-2027F
Figure 18: Global Portion Cup Market Y-o-Y Analysis by Region, 2019H-2027F
Figure 19: North America Portion Cup Market Share Analysis by Material Type, 2022E & 2027F
Figure 20: North America Portion Cup Market Attractiveness Analysis by Capacity, 2022E-2027F
Figure 21: North America Portion Cup Market Incremental Opportunity Analysis (US$ Mn), by Application 2022(E)-2027(F)
Figure 22: North America Portion Cup Market Share Analysis by Sales Channel, 2022E
Figure 23: North America Portion Cup Market Share Analysis by End Use, 2022E & 2027F
Figure 24: North America Portion Cup Market Value Share Analysis by Country 2022(E)
Figure 25: Latin America Portion Cup Market Attractiveness Analysis by Capacity, 2022E-2027F
Figure 26: Latin America Portion Cup Market Incremental Opportunity Analysis (US$ Mn), by Application 2022(E)-2027(F7
Figure 28: Latin America Portion Cup Market Share Analysis by Sales Channel, 2022E
Figure 29: Latin America Portion Cup Market Share Analysis by End Use, 2022E & 2027F
Figure 30: Latin America Portion Cup Market Value Share Analysis by Country 2022(E)
Figure 31: Europe Portion Cup Market Attractiveness Analysis by Capacity, 2022E-2027F
Figure 32: Europe Portion Cup Market Incremental Opportunity Analysis (US$ Mn), by Application 2022(E)-2027(F7
Figure 33: Europe Portion Cup Market Share Analysis by Sales Channel, 2022E
Figure 34: Europe Portion Cup Market Share Analysis by End Use, 2022E & 2027F
Figure 35: Europe Portion Cup Market Value Share Analysis by Country 2022(E)
Figure 36: Asia Pacific Portion Cup Market Attractiveness Analysis by Capacity, 2022E-2027F
Figure 37: Asia Pacific Portion Cup Market Incremental Opportunity Analysis (US$ Mn), by Application 2022(E)-2027(F7
Figure 38: Asia Pacific Portion Cup Market Share Analysis by Sales Channel, 2022E
Figure 39: Asia Pacific Portion Cup Market Share Analysis by End Use, 2022E & 2027F
Figure 40: Asia Pacific Portion Cup Market Value Share Analysis by Country 2022(E)
Figure 41: MEA Portion Cup Market Attractiveness Analysis by Capacity, 2022E-2027F
Figure 42: MEA Portion Cup Market Incremental Opportunity Analysis (US$ Mn), by Application 2022(E)-2027(F7
Figure 43: MEA Portion Cup Market Share Analysis by Sales Channel, 2022E
Figure 44: MEA Portion Cup Market Share Analysis by End Use, 2022E & 2027F
Figure 45: MEA Portion Cup Market Value Share Analysis by Country 2022(E)
Figure 46: United States Portion Cup Market Value Share Analysis, by Material Type, 2022(E) & 2032(F)
Figure 47: United States Portion Cup Market Value Share Analysis, by Capacity, 2022(E)
Figure 48: United States Portion Cup Market Value Share Analysis, by Application, 2022(E)
Figure 49: United States Portion Cup Market Value Share Analysis, by Sales Channel, 2022(E)
Figure 50: United States Portion Cup Market Value (US$ Mn) Analysis, by End Use, 2022(E)
Figure 51: Canada Portion Cup Market Value Share Analysis, by Material Type, 2022(E) & 2032(F)
Figure 52: Canada Portion Cup Market Value Share Analysis, by Capacity, 2022(E)
Figure 53: Canada Portion Cup Market Value Share Analysis, by Application, 2022(E)
Figure 54: Canada Portion Cup Market Value Share Analysis, by Sales Channel, 2022(E)
Figure 55: Canada Portion Cup Market Value (US$ Mn) Analysis, by End Use, 2022(E)
Figure 56: Brazil Portion Cup Market Value Share Analysis, by Material Type, 2022(E) & 2032(F)
Figure 57: Brazil Portion Cup Market Value Share Analysis, by Capacity, 2022(E)
Figure 58: Brazil Portion Cup Market Value Share Analysis, by Application, 2022(E)
Figure 59: Brazil Portion Cup Market Value Share Analysis, by Sales Channel, 2022(E)
Figure 60: Brazil Portion Cup Market Value (US$ Mn) Analysis, by End Use, 2022(E)
Figure 61: Mexico Portion Cup Market Value Share Analysis, by Material Type, 2022(E) & 2032(F)
Figure 62: Mexico Portion Cup Market Value Share Analysis, by Capacity, 2022(E)
Figure 63: Mexico Portion Cup Market Value Share Analysis, by Application, 2022(E)
Figure 64: Mexico Portion Cup Market Value Share Analysis, by Sales Channel, 2022(E)
Figure 65: Mexico Portion Cup Market Value (US$ Mn) Analysis, by End Use, 2022(E)
Figure 66: Germany Portion Cup Market Value Share Analysis, by Material Type, 2022(E) & 2032(F)
Figure 67: Germany Portion Cup Market Value Share Analysis, by Capacity, 2022(E)
Figure 68: Germany Portion Cup Market Value Share Analysis, by Application, 2022(E)
Figure 69: Germany Portion Cup Market Value Share Analysis, by Sales Channel, 2022(E)
Figure 70: Germany Portion Cup Market Value (US$ Mn) Analysis, by End Use, 2022(E)
Figure 71: France Portion Cup Market Value Share Analysis, by Material Type, 2022(E) & 2032(F)
Figure 72: France Portion Cup Market Value Share Analysis, by Capacity, 2022(E)
Figure 73: France Portion Cup Market Value Share Analysis, by Application, 2022(E)
Figure 74: France Portion Cup Market Value Share Analysis, by Sales Channel, 2022(E)
Figure 75: France Portion Cup Market Value (US$ Mn) Analysis, by End Use, 2022(E)
Figure 76: U.K. Portion Cup Market Value Share Analysis, by Material Type, 2022(E) & 2032(F)
Figure 77: U.K. Portion Cup Market Value Share Analysis, by Capacity, 2022(E)
Figure 78: U.K. Portion Cup Market Value Share Analysis, by Application, 2022(E)
Figure 79: U.K. Portion Cup Market Value Share Analysis, by Sales Channel, 2022(E)
Figure 80: U.K. Portion Cup Market Value (US$ Mn) Analysis, by End Use, 2022(E)
Figure 81: Russia Portion Cup Market Value Share Analysis, by Material Type, 2022(E) & 2032(F)
Figure 82: Russia Portion Cup Market Value Share Analysis, by Capacity, 2022(E)
Figure 83: Russia Portion Cup Market Value Share Analysis, by Application, 2022(E)
Figure 84: Russia Portion Cup Market Value Share Analysis, by Sales Channel, 2022(E)
Figure 85: Russia Portion Cup Market Value (US$ Mn) Analysis, by End Use, 2022(E)
Figure 86: China Portion Cup Market Value Share Analysis, by Material Type, 2022(E) & 2032(F)
Figure 87: China Portion Cup Market Value Share Analysis, by Capacity, 2022(E)
Figure 88: China Portion Cup Market Value Share Analysis, by Application, 2022(E)
Figure 89: China Portion Cup Market Value Share Analysis, by Sales Channel, 2022(E)
Figure 90: China Portion Cup Market Value (US$ Mn) Analysis, by End Use, 2022(E)
Figure 91: India Portion Cup Market Value Share Analysis, by Material Type, 2022(E) & 2032(F)
Figure 92: India Portion Cup Market Value Share Analysis, by Capacity, 2022(E)
Figure 93: India Portion Cup Market Value Share Analysis, by Application, 2022(E)
Figure 94: India Portion Cup Market Value Share Analysis, by Sales Channel, 2022(E)
Figure 95: India Portion Cup Market Value (US$ Mn) Analysis, by End Use, 2022(E)
Figure 96: Japan Portion Cup Market Value Share Analysis, by Material Type, 2022(E) & 2032(F)
Figure 97: Japan Portion Cup Market Value Share Analysis, by Capacity, 2022(E)
Figure 98: Japan Portion Cup Market Value Share Analysis, by Application, 2022(E)
Figure 99: Japan Portion Cup Market Value Share Analysis, by Sales Channel, 2022(E)
Figure 100: Japan Portion Cup Market Value (US$ Mn) Analysis, by End Use, 2022(E)
Figure 102: GCC Countries Portion Cup Market Value Share Analysis, by Material Type, 2022(E) & 2032(F)
Figure 103: GCC Countries Portion Cup Market Value Share Analysis, by Capacity, 2022(E)
Figure 104: GCC Countries Portion Cup Market Value Share Analysis, by Application, 2022(E)
Figure 105: GCC Countries Portion Cup Market Value Share Analysis, by Sales Channel, 2022(E)
Figure 106: GCC Countries Portion Cup Market Value (US$ Mn) Analysis, by End Use, 2022(E)
Figure 107: Northern Africa Portion Cup Market Value Share Analysis, by Material Type, 2022(E) & 2032(F)
Figure 108: Northern Africa Portion Cup Market Value Share Analysis, by Capacity, 2022(E)
Figure 109: Northern Africa Portion Cup Market Value Share Analysis, by Application, 2022(E)
Figure 110: Northern Africa Portion Cup Market Value Share Analysis, by Sales Channel, 2022(E)
Figure 111: Northern Africa Portion Cup Market Value (US$ Mn) Analysis, by End Use, 2022(E)
Copyright © Transparency Market Research, Inc. All Rights reserved
Trust Online

Portion Cup Market