
Reports
Reports
Pop Display Market- An Overview
A point-of-purchase display or POP display refers to the advertising which is placed next to the product that is been promoted. Mainly placed by retailer at the point of sale or purchase to try and influence consumers, POP displays play an important role in every type of store to showcase products. Product promotion and branding is anticipated to elevate POP display adoption in several application areas such as cosmetics and personal care, electronics, food and beverages, and printing and stationery. One factor that is perceived as important for influencing POP display market growth includes a rise in the trade and evolution of organized retailing.
The floor display product type in the POP display market witness substantial demand and is anticipated to continue to witness substantial demand among other the product segments in the POP display market. Technological advancements in POP display products are expected to offer substantial opportunities to the POP display market in an application area such as pharmaceuticals. Several players are investing in the POP display market because of the rapidly-expanding nature of the POP display industry and the latent demand for the products.
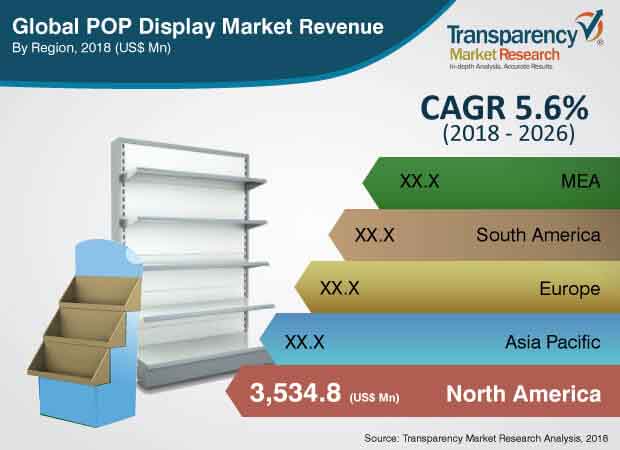
The POP systems market has been divided into five regions globally: South America, Asia Pacific, Middle East & Africa, Europe, and North America. Some of the countries in these regions where the POP display products are in demand include Brazil and Argentina (South America), China, India, and Japan (Asia Pacific), North Africa, South Africa (Middle East and Africa), the United Kingdom, Spain, Germany, Italy, and France (Europe) and US and Canada in North America. In 2018, North America accounted for the maximum revenue in the global POP display market. The other segments in the worldwide POP display market include product type, sales channel, application, and material type.
The POP display market, however, does have its fair set of challenges to deal with. One of them comes through online shopping, which provides benefits such as payment tracking, convenience as well as helps in saving time.
POP Display Market - Snapshot
POP displays play a significant role in all types of stores to display products. POP displays are majorly deployed by retail stores at their point of sale or point of purchase to influence the customers. Promotion and branding of products is expected to boost POP display adoption in applications such as food & beverages, cosmetics & personal care, printing & stationary, electronics, and others significantly over the forecast period. The POP display market is anticipated to reach a value of US$ 16,963.4 Mn by 2026 from US$ 10,377.2 Mn in 2017, expanding at a CAGR of 5.1% during the forecast period
The global POP display market has been broadly segmented based on product type, material type, sales channel, application, and region. In terms of product type, the market has been segmented into counter display, floor display, gravity feed, pallet display, side kick display, dump bin display, clip strip, and other pop display. Based on material type, the market has been classified into corrugated board, foam board, plastic sheet, glass, and metal. On the basis of sales channel, the global POP display market is segmented into hypermarket & supermarket, departmental store, specialty store, convenience store, and others. In terms of application, the market is classified into food & beverages, cosmetics & personal care, pharmaceuticals, printing & stationary, electronics, automotive, and others. In terms of region, the global POP display market is segmented into North America, Europe, Asia Pacific, Middle East & Africa, and South America
The floor display product type of the POP display market has been long in demand and is expected to dominate the product segment over the forecast period. Factors such as increase in the trade and evolution of organized retailing are seen as crucial in influencing market growth trends. However, the POP display market still faces challenges from online shopping. Online shopping offers benefits such as time saving, convenience, payment tracking, etc. Advancement in the POP display products in terms of recyclable materials are likely to offer significant opportunities to the market in various applications such as food and beverage, cosmetics & personal care, pharmaceuticals, and others.
Attracted by this fast expanding market and underlying latent demand, many players are investing in the POP display market. In July 2018, Smurfit Kappa Group acquired Reparenco, a Netherlands based company for US$ 533.4 million. This acquisition is aimed to strengthen the business model of the company and add around 405,000 tons of recycled containerboard capacity to the company's system.
Some of the prominent players operating in the POP display market and profiled in the study include International Paper Company, DS Smith Plc, Smurfit Kappa Group PLC, Sonoco Products Company, Menasha Packaging Company, LLC., Georgia-Pacific LLC, WestRock Company, Pratt Industries Inc., Marketing Alliance Group, and FFR Merchandising Company.
1. Preface
1.1. Market Definition and Scope
1.2. Market Segmentation
1.3. Key Research Objectives
1.4. Research Highlights
2. Assumptions and Research Methodology
3. Executive Summary: Global POP Display Market
4. Market Overview
4.1. Introduction
4.2. Market Dynamics
4.2.1. Drivers
4.2.2. Restraints
4.2.3. Opportunities
4.3. Key Trends Analysis
4.4. Global POP Display Market Analysis and Forecast, 2016 - 2026
4.4.1. Market Revenue Projections (US$ Million)
4.4.2. Market Volume Projections (Million Units)
4.5. Porter’s Five Forces Analysis - Global POP Display Market
4.6. Value Chain Analysis - Global POP Display Market
4.7. Market Outlook
5. Global POP Display Market Analysis and Forecast, by Product Type
5.1. Overview & Definitions
5.2. POP Display Market Size (US$ Million and Million Units) Forecast, by Product Type, 2016 - 2026
5.2.1. Counter Display
5.2.2. Floor Display
5.2.3. Gravity Feed Display
5.2.4. Pallet Display
5.2.4.1. Full Pallet Display
5.2.4.2. Half Pallet Display
5.2.4.3. Quarter Pallet Display
5.2.5. Side Kick Display
5.2.6. Dump Bin Display
5.2.7. Clip Strip
5.2.8. Other POP Display
5.3. Product Type Comparison Matrix
5.4. Market Attractiveness by Product Type
6. Global POP Display Market Analysis and Forecast, by Material Type
6.1. Overview& Definition
6.2. POP Display Market Size (US$ Million and Million Units) Forecast, by Material Type, 2016 - 2026
6.2.1. Corrugated Board
6.2.2. Foam Board
6.2.3. Plastic Sheet
6.2.3.1. Expanded PVC
6.2.3.2. Acrylic
6.2.3.3. Polycarbonate
6.2.3.4. Others
6.2.4. Glass
6.2.5. Metal
6.3. Material Type Comparison Matrix
6.4. Market Attractiveness by Material Type
7. Global POP Display Market Analysis and Forecast, by Sales Channel
7.1. Overview & Definitions
7.2. POP Display Market Size (US$ Million and Million Units) Forecast, by Sales Channel, 2016 - 2026
7.2.1. Hypermarket &Supermarket
7.2.2. Departmental Store
7.2.3. Specialty Store
7.2.4. Convenience Store
7.2.5. Others
7.3. Sales Channel Comparison Matrix
7.4. Market Attractiveness by Sales Channel
8. Global POP Display Market Analysis and Forecast, by Application
8.1. Overview & Definitions
8.2. POP Display Market Size (US$ Million and Million Units) Forecast, by Application, 2016 - 2026
8.2.1. Food & Beverages
8.2.2. Cosmetics & Personal Care
8.2.3. Pharmaceuticals
8.2.4. Printing & Stationary
8.2.5. Electronics
8.2.6. Automotive
8.2.7. Others
8.3. Application Comparison Matrix
8.4. Market Attractiveness by Application
9. Global POP Display Market Analysis and Forecast, by Region
9.1. Key Findings
9.2. POP Display Market Size (US$ Million and Million Units) Forecast, by Region, 2016 - 2026
9.2.1. North America
9.2.2. Europe
9.2.3. Asia Pacific
9.2.4. Middle East & Africa
9.2.5. South America
9.3. Market Attractiveness by Region
10. North America POP Display Market Analysis and Forecast
10.1. Key Findings
10.2. POP Display Market Size (US$ Million and Million Units) Forecast, by Product Type, 2016 - 2026
10.2.1. Counter Display
10.2.2. Floor Display
10.2.3. Gravity Feed Display
10.2.4. Pallet Display
10.2.4.1. Full Pallet Display
10.2.4.2. Half Pallet Display
10.2.4.3. Quarter Pallet Display
10.2.5. Side Kick Display
10.2.6. Dump Bin Display
10.2.7. Clip Strip
10.2.8. Other POP Display
10.3. POP Display Market Size (US$ Million and Million Units) Forecast, by Material Type, 2016 - 2026
10.3.1. Corrugated Board
10.3.2. Foam Board
10.3.3. Plastic Sheet
10.3.3.1. Expanded PVC
10.3.3.2. Acrylic
10.3.3.3. Polycarbonate
10.3.3.4. Others
10.3.4. Glass
10.3.5. Metal
10.4. POP Display Market Size (US$ Million and Million Units) Forecast, by Sales Channel, 2016 - 2026
10.4.1. Hypermarket &Supermarket
10.4.2. Departmental Store
10.4.3. Specialty Store
10.4.4. Convenience Store
10.4.5. Others
10.5. POP Display Market Size (US$ Million and Million Units) Forecast, by Application, 2016 - 2026
10.5.1. Food & Beverages
10.5.2. Cosmetics & Personal Care
10.5.3. Pharmaceuticals
10.5.4. Printing & Stationary
10.5.5. Electronics
10.5.6. Automotive
10.5.7. Others
10.6. POP Display Market Size (US$ Million and Million Units) Forecast, by Country, 2016 - 2026
10.6.1. The U.S.
10.6.2. Canada
10.6.3. Rest of North America
10.7. Market Attractiveness Analysis
10.7.1. by Product Type
10.7.2. by Material Type
10.7.3. by Sales Channel
10.7.4. by Application
10.7.5. by Country
11. Europe POP Display Market Analysis and Forecast
11.1. Key Findings
11.2. POP Display Market Size (US$ Million and Million Units) Forecast, by Product Type, 2016 - 2026
11.2.1. Counter Display
11.2.2. Floor Display
11.2.3. Gravity Feed Display
11.2.4. Pallet Display
11.2.4.1. Full Pallet Display
11.2.4.2. Half Pallet Display
11.2.4.3. Quarter Pallet Display
11.2.5. Side Kick Display
11.2.6. Dump Bin Display
11.2.7. Clip Strip
11.2.8. Other POP Display
11.3. POP Display Market Size (US$ Million and Million Units) Forecast, by Material Type, 2016 - 2026
11.3.1. Corrugated Board
11.3.2. Foam Board
11.3.3. Plastic Sheet
11.3.3.1. Expanded PVC
11.3.3.2. Acrylic
11.3.3.3. Polycarbonate
11.3.3.4. Others
11.3.4. Glass
11.3.5. Metal
11.4. POP Display Market Size (US$ Million and Million Units) Forecast, by Sales Channel, 2016 - 2026
11.4.1. Hypermarket &Supermarket
11.4.2. Departmental Store
11.4.3. Specialty Store
11.4.4. Convenience Store
11.4.5. Others
11.5. POP Display Market Size (US$ Million and Million Units) Forecast, by Application, 2016 - 2026
11.5.1. Food & Beverages
11.5.2. Cosmetics & Personal Care
11.5.3. Pharmaceuticals
11.5.4. Printing & Stationary
11.5.5. Electronics
11.5.6. Automotive
11.5.7. Others
11.6. POP Display Market Size (US$ Million and Million Units) Forecast, by Country, 2016 - 2026
11.6.1. Germany
11.6.2. Spain
11.6.3. Italy
11.6.4. France
11.6.5. U.K.
11.6.6. Benelux
11.6.7. Russia
11.6.8. Rest of Europe
11.7. Market Attractiveness Analysis
11.7.1. by Product Type
11.7.2. by Material Type
11.7.3. by Sales Channel
11.7.4. by Application
11.7.5. by Country
12. Asia Pacific POP Display Market Analysis and Forecast
12.1. Key Findings
12.2. POP Display Market Size (US$ Million and Million Units) Forecast, by Product Type, 2016 - 2026
12.2.1. Counter Display
12.2.2. Floor Display
12.2.3. Gravity Feed Display
12.2.4. Pallet Display
12.2.4.1. Full Pallet Display
12.2.4.2. Half Pallet Display
12.2.4.3. Quarter Pallet Display
12.2.5. Side Kick Display
12.2.6. Dump Bin Display
12.2.7. Clip Strip
12.2.8. Other POP Display
12.3. POP Display Market Size (US$ Million and Million Units) Forecast, by Material Type, 2016 - 2026
12.3.1. Corrugated Board
12.3.2. Foam Board
12.3.3. Plastic Sheet
12.3.3.1. Expanded PVC
12.3.3.2. Acrylic
12.3.3.3. Polycarbonate
12.3.3.4. Others
12.3.4. Glass
12.3.5. Metal
12.4. POP Display Market Size (US$ Million and Million Units) Forecast, by Sales Channel, 2016 - 2026
12.4.1. Hypermarket &Supermarket
12.4.2. Departmental Store
12.4.3. Specialty Store
12.4.4. Convenience Store
12.4.5. Others
12.5. POP Display Market Size (US$ Million and Million Units) Forecast, by Application, 2016 - 2026
12.5.1. Food & Beverages
12.5.2. Cosmetics & Personal Care
12.5.3. Pharmaceuticals
12.5.4. Printing & Stationary
12.5.5. Electronics
12.5.6. Automotive
12.5.7. Others
12.6. POP Display Market Size (US$ Million and Million Units) Forecast, by Country, 2016 - 2026
12.6.1. China
12.6.2. India
12.6.3. Japan
12.6.4. ASEAN
12.6.5. Aus & NZ
12.6.6. Rest of Asia Pacific
12.7. Market Attractiveness Analysis
12.7.1. by Product Type
12.7.2. by Material Type
12.7.3. by Sales Channel
12.7.4. by Application
12.7.5. by Country
13. Middle East & Africa POP Display Market Analysis and Forecast
13.1. Key Findings
13.2. POP Display Market Size (US$ Million and Million Units) Forecast, by Product Type, 2016 - 2026
13.2.1. Counter Display
13.2.2. Floor Display
13.2.3. Gravity Feed Display
13.2.4. Pallet Display
13.2.4.1. Full Pallet Display
13.2.4.2. Half Pallet Display
13.2.4.3. Quarter Pallet Display
13.2.5. Side Kick Display
13.2.6. Dump Bin Display
13.2.7. Clip Strip
13.2.8. Other POP Display
13.3. POP Display Market Size (US$ Million and Million Units) Forecast, by Material Type, 2016 - 2026
13.3.1. Corrugated Board
13.3.2. Foam Board
13.3.3. Plastic Sheet
13.3.3.1. Expanded PVC
13.3.3.2. Acrylic
13.3.3.3. Polycarbonate
13.3.3.4. Others
13.3.4. Glass
13.3.5. Metal
13.4. POP Display Market Size (US$ Million and Million Units) Forecast, by Sales Channel, 2016 - 2026
13.4.1. Hypermarket &Supermarket
13.4.2. Departmental Store
13.4.3. Specialty Store
13.4.4. Convenience Store
13.4.5. Others
13.5. POP Display Market Size (US$ Million and Million Units) Forecast, by Application, 2016 - 2026
13.5.1. Food & Beverages
13.5.2. Cosmetics & Personal Care
13.5.3. Pharmaceuticals
13.5.4. Printing & Stationary
13.5.5. Electronics
13.5.6. Automotive
13.5.7. Others
13.6. POP Display Market Size (US$ Million and Million Units) Forecast, by Country, 2016 - 2026
13.6.1. North Africa
13.6.2. South Africa
13.6.3. GCC
13.6.4. Rest of Middle East & Africa
13.7. Market Attractiveness Analysis
13.7.1. by Product Type
13.7.2. by Material Type
13.7.3. by Sales Channel
13.7.4. by Application
13.7.5. by Country
14. South America POP Display Market Analysis and Forecast
14.1. Key Findings
14.2. POP Display Market Size (US$ Million and Million Units) Forecast, by Product Type, 2016 - 2026
14.2.1. Counter Display
14.2.2. Floor Display
14.2.3. Gravity Feed Display
14.2.4. Pallet Display
14.2.4.1. Full Pallet Display
14.2.4.2. Half Pallet Display
14.2.4.3. Quarter Pallet Display
14.2.5. Side Kick Display
14.2.6. Dump Bin Display
14.2.7. Clip Strip
14.2.8. Other POP Display
14.3. POP Display Market Size (US$ Million and Million Units) Forecast, by Material Type, 2016 - 2026
14.3.1. Corrugated Board
14.3.2. Foam Board
14.3.3. Plastic Sheet
14.3.3.1. Expanded PVC
14.3.3.2. Acrylic
14.3.3.3. Polycarbonate
14.3.3.4. Others
14.3.4. Glass
14.3.5. Metal
14.4. POP Display Market Size (US$ Million and Million Units) Forecast, by Sales Channel, 2016 - 2026
14.4.1. Hypermarket &Supermarket
14.4.2. Departmental Store
14.4.3. Specialty Store
14.4.4. Convenience Store
14.4.5. Others
14.5. POP Display Market Size (US$ Million and Million Units) Forecast, by Application, 2016 - 2026
14.5.1. Food & Beverages
14.5.2. Cosmetics & Personal Care
14.5.3. Pharmaceuticals
14.5.4. Printing & Stationary
14.5.5. Electronics
14.5.6. Automotive
14.5.7. Others
14.6. POP Display Market Size (US$ Million and Million Units) Forecast, by Country, 2016 - 2026
14.6.1. Brazil
14.6.2. Argentina
14.6.3. Rest of South America
14.7. Market Attractiveness Analysis
14.7.1. by Product Type
14.7.2. by Material Type
14.7.3. by Sales Channel
14.7.4. by Application
14.7.5. by Country
15. Competition Landscape
15.1. Market Player – Competition Matrix
15.2. Market Revenue Share Analysis (%), by Company (2017)
16. Company Profiles (Details – Overview, Financials, SWOT Analysis, Strategy)
16.1. International Paper Company
16.1.1. Company Details
16.1.2. Company Description
16.1.3. Business Overview
16.1.4. SWOT Analysis
16.1.5. Financials
16.1.6. Strategic Overview
16.2. DS Smith Plc
16.2.1. Company Details
16.2.2. Company Description
16.2.3. Business Overview
16.2.4. SWOT Analysis
16.2.5. Financials
16.2.6. Strategic Overview
16.3. Smurfit Kappa Group PLC
16.3.1. Company Details
16.3.2. Company Description
16.3.3. Business Overview
16.3.4. SWOT Analysis
16.3.5. Financials
16.3.6. Strategic Overview
16.4. Sonoco Products Company
16.4.1. Company Details
16.4.2. Company Description
16.4.3. Business Overview
16.4.4. SWOT Analysis
16.4.5. Financials
16.4.6. Strategic Overview
16.5. Menasha Packaging Company LLC
16.5.1. Company Details
16.5.2. Company Description
16.5.3. Business Overview
16.5.4. SWOT Analysis
16.5.5. Financials
16.5.6. Strategic Overview
16.6. Georgia-Pacific LLC
16.6.1. Company Details
16.6.2. Company Description
16.6.3. Business Overview
16.6.4. SWOT Analysis
16.6.5. Financials
16.6.6. Strategic Overview
16.7. Pratt Industries Inc.
16.7.1. Company Details
16.7.2. Company Description
16.7.3. Business Overview
16.7.4. SWOT Analysis
16.7.5. Financials
16.7.6. Strategic Overview
16.8. FFR Merchandising Company
16.8.1. Company Details
16.8.2. Company Description
16.8.3. Business Overview
16.8.4. SWOT Analysis
16.8.5. Financials
16.8.6. Strategic Overview
16.9. Marketing Alliance Group
16.9.1. Company Details
16.9.2. Company Description
16.9.3. Business Overview
16.9.4. SWOT Analysis
16.9.5. Financials
16.9.6. Strategic Overview
17. Key Takeaways
List of Tables
Table 01: Global POP Display Market Size (US$ Million) Forecast, by Product Type, 2016 – 2026
Table 02: Global POP Display Market Volume (Million Units) Forecast, by Product Type, 2016 – 2026
Table 03: Global POP Display Market Size (US$ Million) Forecast, by Product Type, Pallet Display 2016 – 2026
Table 04: Global POP Display Market Volume (Million Units) Forecast, by Product Type, Pallet Display 2016 – 2026
Table 05: Global POP Display Market Size (US$ Million) Forecast, by Material Type, 2016 – 2026
Table 06: Global POP Display Market Volume (Million Units) Forecast, byMaterial Type, 2016 – 2026
Table 07: Global POP Display Market Size (US$ Million) Forecast, by Material Type, Plastic Sheet, 2016 – 2026
Table 08: Global POP Display Market Volume (Million Units) Forecast, by Material Type, Plastic Sheet, 2016 – 2026
Table 09: Global POP Display Market Size (US$ Million) Forecast, by Sales Channel, 2016 – 2026
Table 10: Global POP Display Market Volume (Million Units) Forecast, by Sales Channel, 2016 – 2026
Table 11: Global POP Display Market Size (US$ Million) Forecast, by Application, 2016 – 2026
Table 12: Global POP Display Market Volume (Million Units) Forecast, by Application, 2016 – 2026
Table 13: Global POP Display Market Revenue Forecast, by Region, 2016–2026 (US$ Bn)
Table 14: Global POP Display Market Volume (Million Units) Forecast, by Region, 2016–2026
Table 15: North America POP Display Market Size (US$ Million) Forecast, by Product Type, 2016 – 2026
Table 16: North America POP Display Market Volume (Million Units) Forecast, by Product Type, 2016 – 2026
Table 17: North America POP Display Market Size (US$ Million) Forecast, by Product Type, by Pallet Display, 2016 – 2026
Table 18: North America POP Display Market Volume (Million Units) Forecast, by Product Type, by Pallet Display, 2016 – 2026
Table 19: North America POP Display Market Size (US$ Million) Forecast, by Material Type, 2016 – 2026
Table 20: North America POP Display Market Volume (Million Units) Forecast, by Material Type, 2016 – 2026
Table 21: North America POP Display Market Size (US$ Million) Forecast, by Material Type, by Plastic Sheet, 2016 – 2026
Table 22: North America POP Display Market Volume (Million Units) Forecast, by Material Type, by Plastic Sheet, 2016 – 2026
Table 23: North America POP Display Market Size (US$ Million) Forecast, by Sales Channel, 2016 – 2026
Table 24: North America POP Display Market Volume (Million Units) Forecast, by Sales Channel, 2016 – 2026
Table 25: North America POP Display Market Size (US$ Million) Forecast, by Application, 2016 – 2026
Table 26: North America POP Display Market Volume (Million Units) Forecast, by Application, 2016 – 2026
Table 27: North America POP Display Market Size (US$ Million) Forecast, by Country, 2016 – 2026
Table 28: North America POP Display Market Volume (Million Units) Forecast, by Country, 2016 – 2026
Table 29: Europe POP Display Market Size (US$ Million) Forecast, by Product Type, 2016 – 2026
Table 30: Europe POP Display Market Volume (Million Units) Forecast, by Product Type, 2016 – 2026
Table 31: Europe POP Display Market Size (US$ Million) Forecast, by Product Type, by Pallet Display, 2016 – 2026
Table 32: Europe POP Display Market Volume (Million Units) Forecast, by Product Type, by Pallet Display, 2016 – 2026
Table 33: Europe POP Display Market Size (US$ Million) Forecast, by Material Type, 2016 – 2026
Table 34: Europe POP Display Market Volume (Million Units) Forecast, by Material Type, 2016 – 2026
Table 35: Europe POP Display Market Size (US$ Million) Forecast, by Material Type, by Plastic Sheet, 2016 – 2026
Table 36: Europe POP Display Market Volume (Million Units) Forecast, by Material Type, by Plastic Sheet, 2016 – 2026
Table 37: Europe POP Display Market Size (US$ Million) Forecast, by Sales Channel, 2016 – 2026
Table 38: Europe POP Display Market Volume (Million Units) Forecast, by Sales Channel, 2016 – 2026
Table 39: Europe POP Display Market Size (US$ Million) Forecast, by Application, 2016 – 2026
Table 40: Europe POP Display Market Volume (Million Units) Forecast, by Application, 2016 – 2026
Table 41: Europe POP Display Market Size (US$ Million) Forecast, by Country, 2016 – 2026
Table 42: Europe POP Display Market Volume (Million Units) Forecast, by Country, 2016 – 2026
Table 43: Asia Pacific POP Display Market Size (US$ Million) Forecast, by Product Type, 2016 – 2026
Table 44: Asia Pacific POP Display Market Volume (Million Units) Forecast, by Product Type, 2016 – 2026
Table 45: Asia Pacific POP Display Market Size (US$ Million) Forecast, by Product Type, by Pallet Display, 2016 – 2026
Table 46: Asia Pacific POP Display Market Volume (Million Units) Forecast, by Product Type, by Pallet Display, 2016 – 2026
Table 47: Asia Pacific POP Display Market Size (US$ Million) Forecast, by Material Type, 2016 – 2026
Table 48: Asia Pacific POP Display Market Volume (Million Units) Forecast, by Material Type, 2016 – 2026
Table 49: Asia Pacific POP Display Market Revenue Forecast, by Material Type, by Plastic Sheet, 2016 – 2026
Table 50: Asia Pacific POP Display Market Volume (Million Units) Forecast, by Material Type, by Plastic Sheet, 2016 – 2026
Table 51: Asia Pacific POP Display Market Size (US$ Million) Forecast, by Sales Channel, 2016 – 2026
Table 52: Asia Pacific POP Display Market Volume (Million Units) Forecast, by Sales Channel, 2016 – 2026
Table 53: Asia Pacific POP Display Market Size (US$ Million) Forecast, by Application, 2016 – 2026
Table 54: Asia Pacific POP Display Market Volume (Million Units) Forecast, by Application, 2016 – 2026
Table 55: Asia Pacific POP Display Market Size (US$ Million) Forecast, by Country, 2016 – 2026
Table 56: Asia Pacific POP Display Market Volume (Million Units) Forecast, by Country, 2016 – 2026
Table 57: Middle East & Africa POP Display Market Size (US$ Million) Forecast, by Product Type, 2016 – 2026
Table 58: Middle East & Africa POP Display Market Volume (Million Units) Forecast, by Product Type, 2016 – 2026
Table 59: Middle East & Africa POP Display Market Size (US$ Million) Forecast, by Product Type, by Pallet Display, 2016 – 2026
Table 60: Middle East & Africa POP Display Market Volume (Million Units) Forecast, by Product Type, by Pallet Display, 2016 – 2026
Table 61: Middle East & Africa POP Display Market Size (US$ Million) Forecast, by Material Type, 2016 – 2026
Table 62: Middle East & Africa POP Display Market Volume (Million Units) Forecast, by Material Type, 2016 – 2026
Table 63: Middle East & Africa POP Display Market Size (US$ Million) Forecast, by Material Type, by Plastic Sheet, 2016 – 2026
Table 64: Middle East & Africa POP Display Market Volume (Million Units) Forecast, by Material Type, by Plastic Sheet, 2016 – 2026
Table 65: Middle East & Africa POP Display Market Size (US$ Million) Forecast, by Sales Channel, 2016 – 2026
Table 66: Middle East & Africa POP Display Market Volume (Million Units) Forecast, by Sales Channel, 2016 – 2026
Table 67: Middle East & Africa POP Display Market Size (US$ Million) Forecast, by Application, 2016 – 2026
Table 68: Middle East & Africa POP Display Market Volume (Million Units) Forecast, by Application, 2016 – 2026
Table 69: Middle East & Africa POP Display Market Size (US$ Million) Forecast, by Country, 2016 – 2026
Table 70: Middle East & Africa POP Display Market Volume (Million Units) Forecast, by Country, 2016 – 2026
Table 71: South America POP Display Market Size (US$ Million) Forecast, by Product Type, 2016 – 2026
Table 72: South America POP Display Market Volume (Million Units) Forecast, by Product Type, 2016 – 2026
Table 73: South America POP Display Market Size (US$ Million) Forecast, by Product Type, by Pallet Display, 2016 – 2026
Table 74: South America POP Display Market Volume (Million Units) Forecast, by Product Type, by Pallet Display, 2016 – 2026
Table 75: South America POP Display Market Size (US$ Million) Forecast, by Material Type, 2016 – 2026
Table 76: South America POP Display Market Volume (Million Units) Forecast, by Material Type, 2016 – 2026
Table 77: South America POP Display Market Size (US$ Million) Forecast, by Material Type, by Plastic Sheet, 2016 – 2026
Table 78: South America POP Display Market Volume (Million Units) Forecast, by Material Type, by Plastic Sheet, 2016 – 2026
Table 79: South America POP Display Market Size (US$ Million) Forecast, by Sales Channel, 2016 – 2026
Table 80: South America POP Display Market Volume (Million Units) Forecast, by Sales Channel, 2016 – 2026
Table 81: South America POP Display Market Size (US$ Million) Forecast, by Application, 2016 – 2026
Table 82: South America POP Display Market Volume (Million Units) Forecast, by Application, 2016 – 2026
Table 83: South America POP Display Market Size (US$ Million) Forecast, by Country, 2016 – 2026
Table 84: South America POP Display Market Volume (Million Units) Forecast, by Country, 2016 – 2026
List of Figures
Figure 01: Global POP Display Market Revenue Projection and Y – o – Y Growth, 2016-2026 (US$ Million)
Figure 02: Global POP Display Market Volume Projection and Y – o – Y Growth, 2016-2026 (Million Units)
Figure 03: Porter’s Five Forces
Figure 04: Value Chain Analysis
Figure 05: Global POP Display Market Overview (US$ Million)
Figure 06: Global POP Display Market Overview (Million Units)
Figure 07: Global POP Display Market, by Product Type (2018)
Figure 08: Global POP Display Market, by Material Type (2018)
Figure 09: Global POP Display Market, by Sales Channel (2018)
Figure 10: Global POP Display Market, by Application (2018)
Figure 11: Global POP Display Market Share Analysis, by Product Type, 2018 and 2026
Figure 12: Segment Growth Matrix, 2018 - 26 (%)
Figure 13: Segment Revenue Contribution, 2018 - 26 (%)
Figure 14: Segment Compounded Growth Matrix (CAGR %)
Figure 15: POP Display Market Attractiveness Analysis, by Product Type
Figure 16: Global POP Display Market Share Analysis, by Material Type, 2018 and 2026
Figure 17: Segment Growth Matrix, 2018 - 26 (%)
Figure 18: Segment Revenue Contribution, 2018 - 26 (%)
Figure 19: Segment Compounded Growth Matrix (CAGR %)
Figure 20: POP Display Market Attractiveness Analysis, by Product Type
Figure 21: Global POP Display Market Share Analysis, by Sales Channel, 2018 and 2026
Figure 22: Segment Growth Matrix, 2018 - 26 (%)
Figure 23: Segment Revenue Contribution, 2018 - 26 (%)
Figure 24: Segment Compounded Growth Matrix (CAGR %)
Figure 25: POP Display Market Attractiveness Analysis, by Sales Channel
Figure 26: Global POP Display Market Share Analysis, by Application, 2018 and 2026
Figure 27: Segment Compounded Growth Matrix (CAGR %)
Figure 28: POP Display Market Attractiveness Analysis, by Application
Figure 34: POP Display Market, by Region, North America
Figure 35: POP Display Market, by Region, Europe
Figure 36: POP Display Market, by Region, Asia Pacific
Figure 37: POP Display Market, by Region, Middle East & Africa
Figure 38: POP Display Market, by Region, South America
Figure 29: POP Display Market Attractiveness Analysis, by Region
Figure 30: North America POP Display Market Share Analysis, by Product Type, 2018 and 2026
Figure 31: North America POP Display Market Share Analysis, by Material Type, 2018 and 2026
Figure 32: North America POP Display Market Share Analysis, by Sales Channel, 2018 and 2026
Figure 33: North America POP Display Market Share Analysis, by Application, 2018 and 2026
Figure 34: North America POP Display Market Share Analysis, by Country, 2018 and 2026
Figure 35: North America POP Display Market Attractiveness Analysis, by Product Type
Figure 36: North America POP Display Market Attractiveness Analysis, by Material Type
Figure 37: North America POP Display Market Attractiveness Analysis, by Sales Channel
Figure 38: North America POP Display Market Attractiveness Analysis, by Application
Figure 39: North America POP Display Market Attractiveness Analysis, by Country
Figure 40: Europe POP Display Market Share Analysis, by Product Type, 2018 and 2026
Figure 41: Europe POP Display Market Share Analysis, by Material Type, 2018 and 2026
Figure 42: Europe POP Display Market Share Analysis, by Sales Channel, 2018 and 2026
Figure 43: Europe POP Display Market Share Analysis, by Application, 2018 and 2026
Figure 44: Europe POP Display Market Share Analysis, by Country, 2018 and 2026
Figure 45: Europe POP Display Market Attractiveness Analysis, by Product Type
Figure 46: Europe POP Display Market Attractiveness Analysis, by Material Type
Figure 47: Europe POP Display Market Attractiveness Analysis, by Sales Channel
Figure 48: Europe POP Display Market Attractiveness Analysis, by Application
Figure 49: Europe POP Display Market Attractiveness Analysis, by Country
Figure 50: Asia Pacific POP Display Market Share Analysis, by Product Type, 2018 and 2026
Figure 51: Asia Pacific POP Display Market Share Analysis, by Material Type, 2018 and 2026
Figure 52: Asia Pacific POP Display Market Share Analysis, by Sales Channel, 2018 and 2026
Figure 53: Asia Pacific POP Display Market Share Analysis, by Application, 2018 and 2026
Figure 54: Asia Pacific POP Display Market Share Analysis, by Country, 2018 and 2026
Figure 55: Asia Pacific POP Display Market Attractiveness Analysis, by Product Type
Figure 56: Asia Pacific POP Display Market Attractiveness Analysis, by Material Type
Figure 57: Asia Pacific POP Display Market Attractiveness Analysis, by Sales Channel
Figure 58: Asia Pacific POP Display Market Attractiveness Analysis, by Application
Figure 59: Asia Pacific POP Display Market Attractiveness Analysis, by Country
Figure 60: Middle East & Africa POP Display Market Share Analysis, by Product Type, 2018 and 2026
Figure 61: Middle East & Africa POP Display Market Share Analysis, by Material Type, 2018 and 2026
Figure 62: Middle East & Africa POP Display Market Share Analysis, by Sales Channel, 2018 and 2026
Figure 63: Middle East & Africa POP Display Market Share Analysis, by Application, 2018 and 2026
Figure 64: Middle East & Africa POP Display Market Share Analysis, by Country, 2018 and 2026
Figure 65: Middle East & Africa POP Display Market Attractiveness Analysis, by Product Type
Figure 66: Middle East & Africa POP Display Market Attractiveness Analysis, by Material Type
Figure 67: Middle East & Africa POP Display Market Attractiveness Analysis, by Sales Channel
Figure 68: Middle East & Africa POP Display Market Attractiveness Analysis, by Application
Figure 69: Middle East & Africa POP Display Market Attractiveness Analysis, by Country
Figure 70: South America POP Display Market Share Analysis, by Product Type, 2018 and 2026
Figure 71: South America POP Display Market Share Analysis, by Material Type, 2018 and 2026
Figure 72: South America POP Display Market Share Analysis, by Sales Channel, 2018 and 2026
Figure 73: South America POP Display Market Share Analysis, by Application, 2018 and 2026
Figure 74: South America POP Display Market Share Analysis, by Country, 2018 and 2026
Copyright © Transparency Market Research, Inc. All Rights reserved
Trust Online

POP Display Market, Forecast 2018 - 2026