
Reports
Reports
Analysts’ Viewpoint on Polymer Foam Market Scenario
The building & construction industry is expected to be a dominant end-user of polymer foam during the forecast period. One of the main applications of polymer foams in the construction sector is for insulating building components such as doors, roofs, sealants, and foundations of doors and windows. Increase in demand for insulated polymer foams in the building and construction sector is a key factor boosting the polymer foams market. Moreover, increase in number of construction activities in developed as well as developing regions, such as Europe, North America, and Asia Pacific, is propelling the building & construction industry. For instance, the ‘Housing for All’ initiative by the Government of India aims to build 20 million affordable houses for the urban poor by 2022. This initiative is expected to significantly boost residential construction across the country. Additionally, investments in energy infrastructure projects are expected to rise due to the increase in focus on expansion of renewable energy resources. This, in turn, is likely to augment the polymer foam market in Asia Pacific.
Polymer foam is a dispersion of gas in a polymer matrix. It is made of minimum two phases: solid phase and gaseous phase. Polymer foams offer lightness of weight and high strength-to-weight properties. Advantages of using polymer foams include superior thermal & acoustic insulation and energy absorptivity. These benefits make polymer foams a perfect choice of material for insulation of buildings and infrastructure. Thus, increase in number of construction projects and rise in reconstruction activities are expected to fuel the polymer foam market.
According to the Confederation of International Contractors’ Association, the global construction industry is valued at about US$ 7 Trillion and employs around 120 million people. According to U.S. Energy Information Administration, 2014, buildings accounted for approximately 35% to 40% of total energy consumed in developing nations. Rise in initiatives, such as sustainable building, is likely to drive the demand for energy-efficient construction materials across the globe. Various countries across the globe are striving to enhance their residential and public infrastructure. This is likely to boost the market in the near future.
Beneficial attributes of polymer foams, such as light weight, insulation, flexibility, low heat or sound transfer, called as optimal insulators, are projected to drive their demand in the building & construction sector, as polymer foams are extensively used for insulation purposes in the building sector. Increase in legislations and building standards to reduce heat loss is projected to propel the demand for polymer foams during the forecast period.
Asia Pacific is anticipated to be a lucrative region in terms of usage of polymeric foams during the forecast period, due to the increase in per capita income of people and rise in urbanization in the region. These factors have augmented the purchasing power of people, which in turn, has boosted the demand for automotive and housing facilities across the region. Polymer foams are primarily employed to decrease the weight of the structure and in the manufacturing of various parts of vehicles. Government programs, such as Smart Cities Mission, are projected to boost the construction industry in India. This, in turn, is anticipated to augment the market for polymer foams in the country.
In terms of type, the global polymer foam market has been split into polyurethane, polystyrene, polyvinyl chloride, polyolefin and others. Based on volume, the polyurethane segment is expected to dominate the market during the forecast period due to extensive usage of polyurethane foams in the building & construction sector.
Polystyrene and polyolefin segments are anticipated to expand at a moderate pace during the forecast period. Attributes of polyurethane foams, such as high impact resistance and excellent load bearing capacity, are likely to augment the usage of these foams in the construction industry. Desirable characteristics of polystyrene foam, such as lightweight, stiffness, and excellent thermal insulation, are projected to boost the usage of these foams in the packaging sector.
In terms of application, the global polymer foam market has been classified into building & construction, packaging, furniture, automotive, footwear and others. The building & construction segment is likely to constitute a major share, i.e. 24.5%, of the global polymer foam market during the forecast period.
Polyurethane foams sheets are extensively employed as an insulation material in housing products and refrigerators. Additionally, a detailed global market study on polymer foam reveals that an increase in demand for residential & commercial construction and appliances across the globe is fueling the demand for polymer foams.
Rise in demand for automobiles across the globe is fueling the demand for flexible polymer foam and molded foams in automotive seating and auto-bumper systems. This, in turn, is driving the global polymer foams market.
In terms of volume, Asia Pacific held a notable share of 62.3% of the global polymer foam market in 2021. The share is largely attributed to factors such as high population, increase in middle-class income, and low labor and raw materials cost in the region. Moreover, rise in use of rigid polymer foam and low density polymer foam in the building & construction sector is due to their high energy absorption capacity and low density.
Additionally, increase in number of end-use industries in the region is also leading to innovation and developments in the field of polymer foams, which in turn is fueling the polymer foam market in Asia Pacific. Furthermore, rise in per capita income and changing lifestyles in developing countries are anticipated to boost the demand for polymer foam in the near future. Rise in population in the region is also fueling the demand for housing facilities, especially China and India. This, in turn, is driving the demand of polymer foam market.
The polymer foams market in Latin America and Middle East & Africa is anticipated to contract marginally by the end of the forecast period, due to lack of funding from governments in these regions.
The global market is consolidated with a small number of large-scale vendors controlling majority share of the polymer foam market size. A majority of polymer foam manufacturers are spending significantly on comprehensive research and development activities, primarily to develop environment-friendly products. Expansion of product portfolios and mergers and acquisitions are notable strategies adopted by key players. SABIC, BASF SE, Covestro AG, Sealed Air Corporation, Recticel NV, Rogers Corporation, Zotefoams PLC, Toray Industries Inc., Total S.A., Kaneka Corporation, Polymer Technologies, Inc., and DowDuPont Inc. are the prominent entities operating in the market.
Key players have been profiled in the polymer foam market report based on parameters such as company overview, financial overview, business strategies, product portfolio, business segments, and recent developments.
|
Attribute |
Detail |
|
Market Size Value in 2021 |
US$ 94.6 Bn |
|
Market Forecast Value in 2031 |
US$ 144.4 Bn |
|
Growth Rate (CAGR) |
4.2% |
|
Forecast Period |
2022–2031 |
|
Historical Data Available for |
2020 |
|
Quantitative Units |
US$ Bn for Value & Kilo Tons for Volume |
|
Market Analysis |
It includes cross segment analysis at global as well as regional level. Furthermore, qualitative analysis includes drivers, restraints, opportunities, key trends, Porter’s Five Forces analysis, value chain analysis, and key trend analysis. |
|
Competition Landscape |
|
|
Format |
Electronic (PDF) + Excel |
|
Market Segmentation |
|
|
Regions Covered |
|
|
Countries Covered |
|
|
Companies Profiled |
|
|
Customization Scope |
Available upon request |
|
Pricing |
Available upon request |
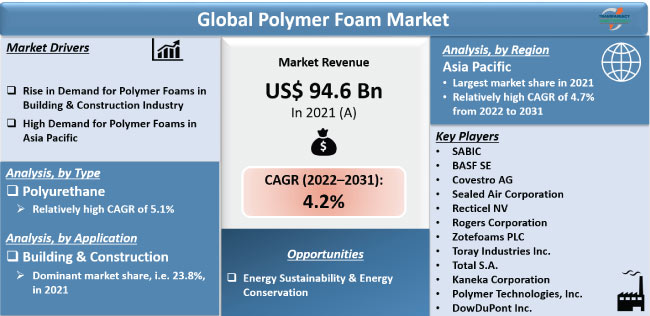
The polymer foam market stood at US$ 94.6 Bn in 2021.
The market is expected to grow at a CAGR of 4.2% from 2022 to 2031.
Rise in demand for polymer foams in the building & construction industry and high demand for polymer foam in Asia Pacific.
Polyurethane foam type was the largest segment and held 28.4% share in 2021.
Asia Pacific was the most lucrative region of the global polymer foam market in 2021.
SABIC, BASF SE, Covestro AG, Sealed Air Corporation, Recticel NV, Rogers Corporation, Zotefoams PLC, Toray Industries Inc., Total S.A., Kaneka Corporation, Polymer Technologies, Inc., and DowDuPont Inc.
1. Executive Summary
1.1. Polymer Foam Market Snapshot
1.2. Key Market Trends
1.3. Current Market and Future Potential
1.4. TMR’s Growth Opportunity Wheel
2. Market Overview
2.1. Market Segmentation
2.2. Market Indicators
2.3. Market Definitions
2.4. Market Dynamics
2.4.1. Drivers
2.4.2. Restraints
2.4.3. Opportunities
2.5. Porter’s Five Forces Analysis
2.6. Value Chain Analysis
2.6.1. List of Raw Material
2.6.2. List of Manufacturer
2.6.3. List of Dealers/Distributors
2.6.4. List of Potential Customers
2.7. Production Analysis/Route of Synthesis
2.8. Product Specification Analysis
3. COVID-19 Impact Analysis
4. Polymer Foam Market Production Outlook
5. Polymer Foam Price Trend Analysis, 2020–2031
5.1. By Type
5.2. By Region
6. Global Polymer Foam Market Analysis and Forecast, by Type, 2020–2031
6.1. Key Findings
6.2. Global Polymer Foam Market Volume (Kilo Tons) and Value (US$ Bn) Forecast, by Type, 2020–2031
6.2.1. Polyurethane
6.2.2. Polystyrene
6.2.3. Polyvinyl Chloride
6.2.4. Polyolefin
6.2.5. Others
6.3. Global Polymer Foam Market Attractiveness, by Type
7. Global Polymer Foam Market Analysis and Forecast, by Application, 2020–2031
7.1. Key Findings
7.2. Global Polymer Foam Market Volume (Kilo Tons) and Value (US$ Bn) Forecast, by Application, 2020–2031
7.2.1. Building & Construction
7.2.2. Packaging
7.2.3. Furniture
7.2.4. Automotive
7.2.5. Footwear
7.2.6. Others
7.3. Global Polymer Foam Market Attractiveness, by Application
8. Global Polymer Foam Market Analysis and Forecast, by Region, 2020–2031
8.1. Key Findings
8.2. Global Polymer Foam Market Volume (Kilo Tons) and Value (US$ Bn) Forecast, by Region, 2020–2031
8.2.1. North America
8.2.2. Europe
8.2.3. Asia Pacific
8.2.4. Latin America
8.2.5. Middle East & Africa
8.3. Global Polymer Foam Market Attractiveness, by Region
9. North America Polymer Foam Market Analysis and Forecast, 2020–2031
9.1. Key Findings
9.2. North America Polymer Foam Market Volume (Kilo Tons) and Value (US$ Bn) Forecast, by Type, 2020–2031
9.3. North America Polymer Foam Market Volume (Kilo Tons) and Value (US$ Bn) Forecast, by Application, 2020–2031
9.4. North America Polymer Foam Market Volume (Kilo Tons) and Value (US$ Bn) Forecast, by Country, 2020–2031
9.4.1. U.S. Polymer Foam Market Volume (Kilo Tons) and Value (US$ Bn) Forecast, by Type, 2020–2031
9.4.2. U.S. Polymer Foam Market Volume (Kilo Tons) and Value (US$ Bn) Forecast, by Application, 2020–2031
9.4.3. Canada Polymer Foam Market Volume (Kilo Tons) and Value (US$ Bn) Forecast, by Type, 2020–2031
9.4.4. Canada Polymer Foam Market Volume (Kilo Tons) and Value (US$ Bn) Forecast, by Application, 2020–2031
9.5. North America Polymer Foam Market Attractiveness Analysis
10. Europe Polymer Foam Market Analysis and Forecast, 2020–2031
10.1. Key Findings
10.2. Europe Polymer Foam Market Volume (Kilo Tons) and Value (US$ Bn) Forecast, by Type, 2020–2031
10.3. Europe Polymer Foam Market Volume (Kilo Tons) and Value (US$ Bn) Forecast, by Application, 2020–2031
10.4. Europe Polymer Foam Market Volume (Kilo Tons) and Value (US$ Bn) Forecast, by Country and Sub-region, 2020–2031
10.4.1. Germany Polymer Foam Market Volume (Kilo Tons) and Value (US$ Bn) Forecast, by Type, 2020–2031
10.4.2. Germany Polymer Foam Market Volume (Kilo Tons) and Value (US$ Bn) Forecast, by Application, 2020–2031
10.4.3. France Polymer Foam Market Volume (Kilo Tons) and Value (US$ Bn) Forecast, by Type, 2020–2031
10.4.4. France Polymer Foam Market Volume (Kilo Tons) and Value (US$ Bn) Forecast, by Application, 2020–2031
10.4.5. U.K. Polymer Foam Market Volume (Kilo Tons) and Value (US$ Bn) Forecast, by Type, 2020–2031
10.4.6. U.K. Polymer Foam Market Volume (Kilo Tons) and Value (US$ Bn) Forecast, by Application, 2020–2031
10.4.7. Italy Polymer Foam Market Volume (Kilo Tons) and Value (US$ Bn) Forecast, by Type, 2020–2031
10.4.8. Italy Polymer Foam Market Volume (Kilo Tons) and Value (US$ Bn) Forecast, by Application, 2020–2031
10.4.9. Spain Polymer Foam Market Volume (Kilo Tons) and Value (US$ Bn) Forecast, by Type, 2020–2031
10.4.10. Spain Polymer Foam Market Volume (Kilo Tons) and Value (US$ Bn) Forecast, by Application, 2020–2031
10.4.11. Russia & CIS Polymer Foam Market Volume (Kilo Tons) and Value (US$ Bn) Forecast, by Type, 2020–2031
10.4.12. Russia & CIS Polymer Foam Market Volume (Kilo Tons) and Value (US$ Bn) Forecast, by Application, 2020–2031
10.4.13. Rest of Europe Polymer Foam Market Volume (Kilo Tons) and Value (US$ Bn) Forecast, by Type, 2020–2031
10.4.14. Rest of Europe Polymer Foam Market Volume (Kilo Tons) and Value (US$ Bn) Forecast, by Application, 2020–2031
10.5. Europe Polymer Foam Market Attractiveness Analysis
11. Asia Pacific Polymer Foam Market Analysis and Forecast, 2020–2031
11.1. Key Findings
11.2. Asia Pacific Polymer Foam Market Volume (Kilo Tons) and Value (US$ Bn) Forecast, by Type, 2020–2031
11.3. Asia Pacific Polymer Foam Market Volume (Kilo Tons) and Value (US$ Bn) Forecast, by Application, 2020–2031
11.4. Asia Pacific Polymer Foam Market Volume (Kilo Tons) and Value (US$ Bn) Forecast, by Country and Sub-region, 2020–2031
11.4.1. China Polymer Foam Market Volume (Kilo Tons) and Value (US$ Bn) Forecast, by Type, 2020–2031
11.4.2. China Polymer Foam Market Volume (Kilo Tons) and Value (US$ Bn) Forecast, by Application, 2020–2031
11.4.3. Japan Polymer Foam Market Volume (Kilo Tons) and Value (US$ Bn) Forecast, by Type, 2020–2031
11.4.4. Japan Polymer Foam Market Volume (Kilo Tons) and Value (US$ Bn) Forecast, by Application, 2020–2031
11.4.5. India Polymer Foam Market Volume (Kilo Tons) and Value (US$ Bn) Forecast, by Type, 2020–2031
11.4.6. India Polymer Foam Market Volume (Kilo Tons) and Value (US$ Bn) Forecast, by Application, 2020–2031
11.4.7. ASEAN Polymer Foam Market Volume (Kilo Tons) and Value (US$ Bn) Forecast, by Type, 2020–2031
11.4.8. ASEAN Polymer Foam Market Volume (Kilo Tons) and Value (US$ Bn) Forecast, by Application, 2020–2031
11.4.9. Rest of Asia Pacific Polymer Foam Market Volume (Kilo Tons) and Value (US$ Bn) Forecast, by Type, 2020–2031
11.4.10. Rest of Asia Pacific Polymer Foam Market Volume (Kilo Tons) and Value (US$ Bn) Forecast, by Application, 2020–2031
11.5. Asia Pacific Polymer Foam Market Attractiveness Analysis
12. Latin America Polymer Foam Market Analysis and Forecast, 2020–2031
12.1. Key Findings
12.2. Latin America Polymer Foam Market Volume (Kilo Tons) and Value (US$ Bn) Forecast, by Type, 2020–2031
12.3. Latin America Polymer Foam Market Volume (Kilo Tons) and Value (US$ Bn) Forecast, by Application, 2020–2031
12.4. Latin America Polymer Foam Market Volume (Kilo Tons) and Value (US$ Bn) Forecast, by Country and Sub-region, 2020–2031
12.4.1. Brazil Polymer Foam Market Volume (Kilo Tons) and Value (US$ Bn) Forecast, by Type, 2020–2031
12.4.2. Brazil Polymer Foam Market Volume (Kilo Tons) and Value (US$ Bn) Forecast, by Application, 2020–2031
12.4.3. Mexico Polymer Foam Market Volume (Kilo Tons) and Value (US$ Bn) Forecast, by Type, 2020–2031
12.4.4. Mexico Polymer Foam Market Volume (Kilo Tons) and Value (US$ Bn) Forecast, by Application, 2020–2031
12.4.5. Rest of Latin America Polymer Foam Market Volume (Kilo Tons) and Value (US$ Bn) Forecast, by Type, 2020–2031
12.4.6. Rest of Latin America Polymer Foam Market Volume (Kilo Tons) and Value (US$ Bn) Forecast, by Application, 2020–2031
12.5. Latin America Polymer Foam Market Attractiveness Analysis
13. Middle East & Africa Polymer Foam Market Analysis and Forecast, 2020–2031
13.1. Key Findings
13.2. Middle East & Africa Polymer Foam Market Volume (Kilo Tons) and Value (US$ Bn) Forecast, by Type, 2020–2031
13.3. Middle East & Africa Polymer Foam Market Volume (Kilo Tons) and Value (US$ Bn) Forecast, by Application, 2020–2031
13.4. Middle East & Africa Polymer Foam Market Volume (Kilo Tons) and Value (US$ Bn) Forecast, by Country and Sub-region, 2020–2031
13.4.1. South Africa Polymer Foam Market Volume (Kilo Tons) and Value (US$ Bn) Forecast, by Type, 2020–2031
13.4.2. South Africa Polymer Foam Market Volume (Kilo Tons) and Value (US$ Bn) Forecast, by Application, 2020–2031
13.4.3. GCC Polymer Foam Market Volume (Kilo Tons) and Value (US$ Bn) Forecast, by Type, 2020–2031
13.4.4. GCC Polymer Foam Market Volume (Kilo Tons) and Value (US$ Bn) Forecast, by Application, 2020–2031
13.4.5. Rest of Middle East & Africa Polymer Foam Market Volume (Kilo Tons) and Value (US$ Bn) Forecast, by Type, 2020–2031
13.4.6. Rest of Middle East & Africa Polymer Foam Market Volume (Kilo Tons) and Value (US$ Bn) Forecast, by Application, 2020–2031
13.5. Middle East & Africa Polymer Foam Market Attractiveness Analysis
14. Competition Landscape
14.1. Global Polymer Foam Company Market Share Analysis, 2021
14.2. Competition Matrix
14.3. Market Footprint Analysis
14.3.1. By Type
14.3.2. By Application
14.4. Company Profiles (Details – Overview, Financials, Recent Developments, and Strategy)
14.4.1. SABIC
14.4.1.1. Company Description
14.4.1.2. Business Overview
14.4.1.3. Financial Details
14.4.1.4. Strategic Overview
14.4.2. BASF SE
14.4.2.1. Company Description
14.4.2.2. Business Overview
14.4.2.3. Financial Details
14.4.2.4. Strategic Overview
14.4.3. Covestro AG
14.4.3.1. Company Description
14.4.3.2. Business Overview
14.4.4. Sealed Air Corporation
14.4.4.1. Company Description
14.4.4.2. Business Overview
14.4.5. Recticel NV
14.4.5.1. Company Description
14.4.5.2. Business Overview
14.4.6. Rogers Corporation
14.4.6.1. Company Description
14.4.6.2. Business Overview
14.4.7. Zotefoams PLC
14.4.7.1. Company Description
14.4.7.2. Business Overview
14.4.8. Toray Industries Inc.
14.4.8.1. Company Description
14.4.8.2. Business Overview
14.4.9. Total S.A.
14.4.9.1. Company Description
14.4.9.2. Business Overview
14.4.10. Kaneka Corporation
14.4.10.1. Company Description
14.4.10.2. Business Overview
14.4.11. Polymer Technologies, Inc.
14.4.11.1. Company Description
14.4.11.2. Business Overview
14.4.12. DowDuPont Inc.
14.4.12.1. Company Description
14.4.12.2. Business Overview
15. Primary Research: Key Insights
16. Appendix
List of Tables
Table 1: Global Polymer Foam Market Volume (Kilo Tons) Forecast, by Type, 2020–2031
Table 2: Global Polymer Foam Market Value (US$ Bn) Forecast, by Type, 2020–2031
Table 3: Global Polymer Foam Market Volume (Kilo Tons) Forecast, by Application, 2020–2031
Table 4: Global Polymer Foam Market Value (US$ Bn) Forecast, by Application, 2020–2031
Table 5: Global Polymer Foam Market Volume (Kilo Tons) Forecast, by Region, 2020–2031
Table 6: Global Polymer Foam Market Value (US$ Bn) Forecast, by Region, 2020–2031
Table 7: North America Polymer Foam Market Volume (Kilo Tons) Forecast, by Type, 2020–2031
Table 8: North America Polymer Foam Market Value (US$ Bn) Forecast, by Type, 2020–2031
Table 9: North America Polymer Foam Market Volume (Kilo Tons) Forecast, by Application, 2020–2031
Table 10: North America Polymer Foam Market Value (US$ Bn) Forecast, by Application, 2020–2031
Table 11: North America Polymer Foam Market Volume (Kilo Tons) Forecast, by Country, 2020–2031
Table 12: North America Polymer Foam Market Value (US$ Bn) Forecast, by Country, 2020–2031
Table 13: U.S. Polymer Foam Market Volume (Kilo Tons) Forecast, by Type, 2020–2031
Table 14: U.S. Polymer Foam Market Value (US$ Bn) Forecast, by Type, 2020–2031
Table 15: U.S. Polymer Foam Market Volume (Kilo Tons) Forecast, by Application, 2020–2031
Table 16: U.S. Polymer Foam Market Value (US$ Bn) Forecast, by Application, 2020–2031
Table 17: Canada Polymer Foam Market Volume (Kilo Tons) Forecast, by Type, 2020–2031
Table 18: Canada Polymer Foam Market Value (US$ Bn) Forecast, by Type, 2020–2031
Table 19: Canada Polymer Foam Market Volume (Kilo Tons) Forecast, by Application, 2020–2031
Table 20: Canada Polymer Foam Market Value (US$ Bn) Forecast, by Application, 2020–2031
Table 21: Europe Polymer Foam Market Volume (Kilo Tons) Forecast, by Type, 2020–2031
Table 22: Europe Polymer Foam Market Value (US$ Bn) Forecast, by Type, 2020–2031
Table 23: Europe Polymer Foam Market Volume (Kilo Tons) Forecast, by Application, 2020–2031
Table 24: Europe Polymer Foam Market Value (US$ Bn) Forecast, by Application, 2020–2031
Table 25: Europe Polymer Foam Market Volume (Kilo Tons) Forecast, by Country and Sub-region, 2020–2031
Table 26: Europe Polymer Foam Market Value (US$ Bn) Forecast, by Country and Sub-region, 2020–2031
Table 27: Germany Polymer Foam Market Volume (Kilo Tons) Forecast, by Type, 2020–2031
Table 28: Germany Polymer Foam Market Value (US$ Bn) Forecast, by Type, 2020–2031
Table 29: Germany Polymer Foam Market Volume (Kilo Tons) Forecast, by Application, 2020–2031
Table 30: Germany Polymer Foam Market Value (US$ Bn) Forecast, by Application, 2020–2031
Table 31: U.K. Polymer Foam Market Volume (Kilo Tons) Forecast, by Type, 2020–2031
Table 32: U.K. Polymer Foam Market Value (US$ Bn) Forecast, by Type, 2020–2031
Table 33: U.K. Polymer Foam Market Volume (Kilo Tons) Forecast, by Application, 2020–2031
Table 34: U.K. Polymer Foam Market Value (US$ Bn) Forecast, by Application, 2020–2031
Table 35: France Polymer Foam Market Volume (Kilo Tons) Forecast, by Type, 2020–2031
Table 36: France Polymer Foam Market Value (US$ Bn) Forecast, by Type, 2020–2031
Table 37: France Polymer Foam Market Volume (Kilo Tons) Forecast, by Application, 2020–2031
Table 38: France Polymer Foam Market Value (US$ Bn) Forecast, by Application, 2020–2031
Table 39: Italy Polymer Foam Market Volume (Kilo Tons) Forecast, by Type, 2020–2031
Table 40: Italy Polymer Foam Market Value (US$ Bn) Forecast, by Type, 2020–2031
Table 41: Italy Polymer Foam Market Volume (Kilo Tons) Forecast, by Application, 2020–2031
Table 42: Italy Polymer Foam Market Value (US$ Bn) Forecast, by Application, 2020–2031
Table 43: Spain Polymer Foam Market Volume (Kilo Tons) Forecast, by Type, 2020–2031
Table 44: Spain Polymer Foam Market Value (US$ Bn) Forecast, by Type, 2020–2031
Table 45: Spain Polymer Foam Market Volume (Kilo Tons) Forecast, by Application, 2020–2031
Table 46: Spain Polymer Foam Market Value (US$ Bn) Forecast, by Application, 2020–2031
Table 47: Russia & CIS Polymer Foam Market Volume (Kilo Tons) Forecast, by Type, 2020–2031
Table 48: Russia & CIS Polymer Foam Market Value (US$ Bn) Forecast, by Type, 2020–2031
Table 49: Russia & CIS Polymer Foam Market Volume (Kilo Tons) Forecast, by Application, 2020–2031
Table 50: Russia & CIS Polymer Foam Market Value (US$ Bn) Forecast, by Application, 2020–2031
Table 51: Rest of Europe Polymer Foam Market Volume (Kilo Tons) Forecast, by Type, 2020–2031
Table 52: Rest of Europe Polymer Foam Market Value (US$ Bn) Forecast, by Type, 2020–2031
Table 53: Rest of Europe Polymer Foam Market Volume (Kilo Tons) Forecast, by Application, 2020–2031
Table 54: Rest of Europe Polymer Foam Market Value (US$ Bn) Forecast, by Application, 2020–2031
Table 55: Asia Pacific Polymer Foam Market Volume (Kilo Tons) Forecast, by Type, 2020–2031
Table 56: Asia Pacific Polymer Foam Market Value (US$ Bn) Forecast, by Type, 2020–2031
Table 57: Asia Pacific Polymer Foam Market Volume (Kilo Tons) Forecast, by Application, 2020–2031
Table 58: Asia Pacific Polymer Foam Market Value (US$ Bn) Forecast, by Application, 2020–2031
Table 59: Asia Pacific Polymer Foam Market Volume (Kilo Tons) Forecast, by Country and Sub-region, 2020–2031
Table 60: Asia Pacific Polymer Foam Market Value (US$ Bn) Forecast, by Country and Sub-region, 2020–2031
Table 61: China Polymer Foam Market Volume (Kilo Tons) Forecast, by Type, 2020–2031
Table 62: China Polymer Foam Market Value (US$ Bn) Forecast, by Type, 2020–2031
Table 63: China Polymer Foam Market Volume (Kilo Tons) Forecast, by Application, 2020–2031
Table 64: China Polymer Foam Market Value (US$ Bn) Forecast, by Application, 2020–2031
Table 65: Japan Polymer Foam Market Volume (Kilo Tons) Forecast, by Type, 2020–2031
Table 66: Japan Polymer Foam Market Value (US$ Bn) Forecast, by Type, 2020–2031
Table 67: Japan Polymer Foam Market Volume (Kilo Tons) Forecast, by Application, 2020–2031
Table 68: Japan Polymer Foam Market Value (US$ Bn) Forecast, by Application, 2020–2031
Table 69: India Polymer Foam Market Volume (Kilo Tons) Forecast, by Type, 2020–2031
Table 70: India Polymer Foam Market Value (US$ Bn) Forecast, by Type, 2020–2031
Table 71: India Polymer Foam Market Volume (Kilo Tons) Forecast, by Application, 2020–2031
Table 72: India Polymer Foam Market Value (US$ Bn) Forecast, by Application, 2020–2031
Table 73: ASEAN Polymer Foam Market Volume (Kilo Tons) Forecast, by Type, 2020–2031
Table 74: ASEAN Polymer Foam Market Value (US$ Bn) Forecast, by Type, 2020–2031
Table 75: ASEAN Polymer Foam Market Volume (Kilo Tons) Forecast, by Application, 2020–2031
Table 76: ASEAN Polymer Foam Market Value (US$ Bn) Forecast, by Application, 2020–2031
Table 77: Rest of Asia Pacific Polymer Foam Market Volume (Kilo Tons) Forecast, by Type, 2020–2031
Table 78: Rest of Asia Pacific Polymer Foam Market Value (US$ Bn) Forecast, by Type, 2020–2031
Table 79: Rest of Asia Pacific Polymer Foam Market Volume (Kilo Tons) Forecast, by Application, 2020–2031
Table 80: Rest of Asia Pacific Polymer Foam Market Value (US$ Bn) Forecast, by Application, 2020–2031
Table 81: Latin America Polymer Foam Market Volume (Kilo Tons) Forecast, by Type, 2020–2031
Table 82: Latin America Polymer Foam Market Value (US$ Bn) Forecast, by Type, 2020–2031
Table 83: Latin America Polymer Foam Market Volume (Kilo Tons) Forecast, by Application, 2020–2031
Table 84: Latin America Polymer Foam Market Value (US$ Bn) Forecast, by Application, 2020–2031
Table 85: Latin America Polymer Foam Market Volume (Kilo Tons) Forecast, by Country and Sub-region, 2020–2031
Table 86: Latin America Polymer Foam Market Value (US$ Bn) Forecast, by Country and Sub-region, 2020–2031
Table 87: Brazil Polymer Foam Market Volume (Kilo Tons) Forecast, by Type, 2020–2031
Table 88: Brazil Polymer Foam Market Value (US$ Bn) Forecast, by Type, 2020–2031
Table 99: Brazil Polymer Foam Market Volume (Kilo Tons) Forecast, by Application, 2020–2031
Table 100: Brazil Polymer Foam Market Value (US$ Bn) Forecast, by Application, 2020–2031
Table 101: Mexico Polymer Foam Market Volume (Kilo Tons) Forecast, by Type, 2020–2031
Table 102: Mexico Polymer Foam Market Value (US$ Bn) Forecast, by Type, 2020–2031
Table 103: Mexico Polymer Foam Market Volume (Kilo Tons) Forecast, by Application, 2020–2031
Table 104: Mexico Polymer Foam Market Value (US$ Bn) Forecast, by Application, 2020–2031
Table 105: Rest of Latin America Polymer Foam Market Volume (Kilo Tons) Forecast, by Type, 2020–2031
Table 106: Rest of Latin America Polymer Foam Market Value (US$ Bn) Forecast, by Type, 2020–2031
Table 107: Rest of Latin America Polymer Foam Market Volume (Kilo Tons) Forecast, by Application, 2020–2031
Table 108: Rest of Latin America Polymer Foam Market Value (US$ Bn) Forecast, by Application, 2020–2031
Table 109: Middle East & Africa Polymer Foam Market Volume (Kilo Tons) Forecast, by Type, 2020–2031
Table 110: Middle East & Africa Polymer Foam Market Value (US$ Bn) Forecast, by Type, 2020–2031
Table 111: Middle East & Africa Polymer Foam Market Volume (Kilo Tons) Forecast, by Application, 2020–2031
Table 112: Middle East & Africa Polymer Foam Market Value (US$ Bn) Forecast, by Application, 2020–2031
Table 113: Middle East & Africa Polymer Foam Market Volume (Kilo Tons) Forecast, by Country and Sub-region, 2020–2031
Table 114: Middle East & Africa Polymer Foam Market Value (US$ Bn) Forecast, by Country and Sub-region, 2020–2031
Table 115: GCC Polymer Foam Market Volume (Kilo Tons) Forecast, by Type, 2020–2031
Table 116: GCC Polymer Foam Market Value (US$ Bn) Forecast, by Type, 2020–2031
Table 117: GCC Polymer Foam Market Volume (Kilo Tons) Forecast, by Application, 2020–2031
Table 118: GCC Polymer Foam Market Value (US$ Bn) Forecast, by Application, 2020–2031
Table 119: South Africa Polymer Foam Market Volume (Kilo Tons) Forecast, by Type, 2020–2031
Table 120: South Africa Polymer Foam Market Value (US$ Bn) Forecast, by Type, 2020–2031
Table 121: South Africa Polymer Foam Market Volume (Kilo Tons) Forecast, by Application, 2020–2031
Table 122: South Africa Polymer Foam Market Value (US$ Bn) Forecast, by Application, 2020–2031
Table 123: Rest of Middle East & Africa Polymer Foam Market Volume (Kilo Tons) Forecast, by Type, 2020–2031
Table 124: Rest of Middle East & Africa Polymer Foam Market Value (US$ Bn) Forecast, by Type, 2020–2031
Table 125: Rest of Middle East & Africa Polymer Foam Market Volume (Kilo Tons) Forecast, by Application, 2020–2031
Table 126: Rest of Middle East & Africa Polymer Foam Market Value (US$ Bn) Forecast, by Application, 2020–2031
List of Figures
Figure 1: Global Polymer Foam Price Trend, by Type, 2020–2031 (US$/Ton)
Figure 2: Global Polymer Foam Price Trend, by Region, 2020–2031 (US$/Ton)
Figure 3: Global Polymer Foam Market Volume Share, By Type, 2021, 2025, and 2031
Figure 4: Global Polymer Foam Market Attractiveness, by Type
Figure 5: Global Polymer Foam Market Volume Share, by Application, 2021, 2025, and 2031
Figure 6: Global Polymer Foam Market Attractiveness, by Application
Figure 7: Global Polymer Foam Market Volume Share, by Region, 2021, 2025, and 2031
Figure 8: Global Polymer Foam Market Attractiveness, by Region
Figure 9: North America Polymer Foam Market Volume Share, By Type, 2021, 2025, and 2031
Figure 10: North America Polymer Foam Market Attractiveness, by Type
Figure 11: North America Polymer Foam Market Volume Share, by Application, 2021, 2025, and 2031
Figure 12: North America Polymer Foam Market Attractiveness, by Application
Figure 13: North America Polymer Foam Market Volume Share, by Country, 2021, 2025, and 2031
Figure 14: North America Polymer Foam Market Attractiveness, by Country
Figure 15: Europe Polymer Foam Market Volume Share, By Type, 2021, 2025, and 2031
Figure 16: Europe Polymer Foam Market Attractiveness, by Type
Figure 17: Europe Polymer Foam Market Volume Share, by Application, 2021, 2025, and 2031
Figure 18: Europe Polymer Foam Market Attractiveness, by Application
Figure 19: Europe Polymer Foam Market Volume Share, by Country and Sub-region, 2021, 2025, and 2031
Figure 20: Europe Polymer Foam Market Attractiveness, by Country and Sub-region
Figure 21: Asia Pacific Polymer Foam Market Volume Share, By Type, 2021, 2025, and 2031
Figure 22: Asia Pacific Polymer Foam Market Attractiveness, by Type
Figure 23: Asia Pacific Polymer Foam Market Volume Share, by Application, 2021, 2025, and 2031
Figure 24: Asia Pacific Polymer Foam Market Attractiveness, by Application
Figure 25: Asia Pacific Polymer Foam Market Volume Share, by Country and Sub-region, 2021, 2025, and 2031
Figure 26: Asia Pacific Polymer Foam Market Attractiveness, by Country and Sub-region
Figure 27: Latin America Polymer Foam Market Volume Share, By Type, 2021, 2025, and 2031
Figure 28: Latin America Polymer Foam Market Attractiveness, by Type
Figure 29: Latin America Polymer Foam Market Volume Share, by Application, 2021, 2025, and 2031
Figure 30: Latin America Polymer Foam Market Attractiveness, by Application
Figure 31: Latin America Polymer Foam Market Volume Share, by Country and Sub-region, 2021, 2025, and 2031
Figure 32: Latin America Polymer Foam Market Attractiveness, by Country and Sub-region
Figure 33: Middle East & Africa Polymer Foam Market Volume Share, By Type, 2021, 2025, and 2031
Figure 34: Middle East & Africa Polymer Foam Market Attractiveness, by Type
Figure 35: Middle East & Africa Polymer Foam Market Volume Share, by Application, 2021, 2025, and 2031
Figure 36: Middle East & Africa Polymer Foam Market Attractiveness, by Application
Figure 37: Middle East & Africa Polymer Foam Market Volume Share, by Country and Sub-region, 2021, 2025, and 2031
Figure 38: Middle East & Africa Polymer Foam Market Attractiveness, by Country and Sub-region
Figure 39: Global Polymer Foam Market Share Analysis, by Company, 2020
Copyright © Transparency Market Research, Inc. All Rights reserved
Trust Online

Polymer Foam Market