
Reports
Reports
The global polyacrylamide market is anticipated to be driven within the forecast years i.e. 2019 to 2027 owing to the increasing usage of polyacrylamide as absorbent, agent in secondary oil recovery, thickening agent, and flocculent. Furthermore, the utilization of polyacrylamide for separating macromolecules of various molecular weights is also likely to positively influence the demand within the global polyacrylamide market in coming years. The research report on the global polyacrylamide market predicts that the industry will record a considerable growth rate of 6.2 % over the forecast period. It also projects that the global polyacrylamide market will expand from its initial evaluation of US$ 4,976 million in 2018 and hit the evaluation mark of US$ 8,571.9 million by the end of the forecast period i.e. in 2027.
The types of products and solutions offered by the manufacturers and players functional within the global polyacrylamide market include cationic, anionic, and non-ionic, among others. The segments in the global polyacrylamide market based on the form of the products include emulsion, powder, and gel, among others. Some of the major applications for the solutions provided by the players in the global polyacrylamide market include oil and gas extraction, agriculture, paints and coatings, food, waste water treatment, mining, paper and pulp, and textiles, among others.
The solutions offered by the manufacturers and players functional within the global polyacrylamide market are used on a massive scale in oil and gas sector in order to enhance the oil recovery. Moreover, thee solutions in the global polyacrylamide market are also used in oil and gas industry for polymer flooding. Furthermore, the rising usage of polyacrylamide for shale gas exploration in oil and gas sector is also likely to influence the growth trajectory of global polyacrylamide market in coming years. The products in the global polyacrylamide market help in decreasing the friction and thereby aids in excellent oil recovery.
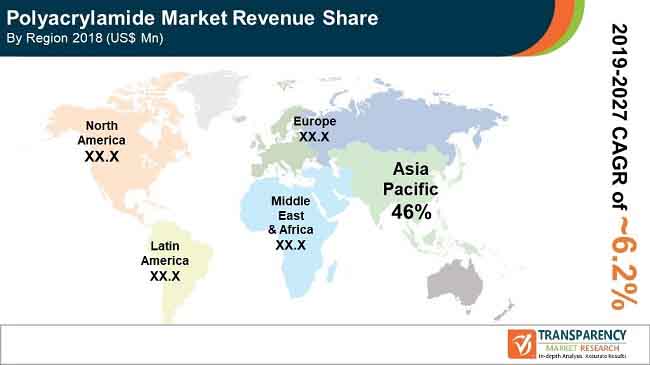
Key regions evaluated in the research report on the global polyacrylamide market are Europe, Latin America, North America, and Asia Pacific. Among these, Asia Pacific emerged as one of the leading consumers as well as producers of polyacrylamide around the world. With a massive number of suppliers and manufacturers present in the regional economy of China, the Asia Pacific region is expected to lead the global polyacrylamide market in coming years. Some of the major drivers bolstering the development of the global polyacrylamide market in Asia Pacific include increasing awareness pertaining to the importance of waste water treatment as well as the increasing pool of population in the region.
Some of the most notable players and manufacturers covered in the business intelligence report on the global polyacrylamide market include PetroChina Company Ltd., BASF, Xitao Polymer Co Ltd., Kemira, Mitsubishi Rayon Co Ltd., Anhui Jucheng Fine Chemicals Co. Ltd., and SNF Floerger Group, among others. The global polyacrylamide market is considered to be highly fragmented with BASF SE, Ashland Inc., Kemira, Inc., SNF Group, and Bio-Rad Laboratories emerging as the leading players in the industry.
Players and manufacturers in the global polyacrylamide market are focused on developing and producing new and innovative products in order to expand their current base of conusmers. This trend is likely to result in intensification of the competition in the global polyacrylamide market in coming years. Furthermore, the leading players in the global polyacrylamide market are also investing heavily in research and development activities in a bid to enhance the quality of their products. One of the most prominent corporate development strategies adopted by the players and manufacturers in the global polyacrylamide market is collaborative agreements.
Polyacrylamide Market is expected to reach US$ 8,571.9 mn By 2027
Polyacrylamide Market is estimated to rise at a CAGR of 6.2% during forecast period
Rise in demand for waste water treatment to driving the growth of the Polyacrylamide Market
Asia Pacific is more attractive region for vendors in the Polyacrylamide Market
Major players operating in the Polyacrylamide market are BASF SE, SNF Group, Ashland Inc., Bio-Rad Laboratories, Kemira Inc. and others
1. Preface
1.1. Report Scope and Market Segmentation
1.2. Research Highlights
1.3. Research Objectives
1.4. Key Questions Answered
2. Assumptions and Research Methodology
2.1. Assumptions and Acronyms Used
2.2. Research Methodology
3. Executive Summary
3.1. Global Polyacrylamides Market Size, by Market Value (US$ Mn) and Market Value Share, by Region, 2018
3.2. Regional Overview, 2027
4. Market Overview
4.1. Product Overview
4.2. Key Market Indicators
4.3. Drivers and Restraints Snapshot Analysis
4.4. Polyacrylamides Market - Global Supply Demand Scenario
4.5. Global Demand-Supply Scenario, 2018–2027
4.6. Porter’s Analysis
4.7. Value Chain Analysis
4.8. SWOT Analysis
5. Global Polyacrylamides Market Analysis, By Type
5.1. Introduction
5.2. Key Findings
5.3. Key Trends
5.4. Market Size (US$ Mn) and Volume (Kilo Tons) Forecast, by Type
5.4.1. Anionic
5.4.2. Cationic
5.4.3. Non-ionic
5.4.4. Others
5.5. Market Attractiveness, by Type
6. Global Polyacrylamides Market Analysis, By Form
6.1. Introduction
6.2. Key Findings
6.3. Key Trends
6.4. Market Size (US$ Mn) and Volume (Kilo Tons) Forecast, by Form
6.4.1. Powder
6.4.2. Emulsion
6.4.3. Gel
6.4.4. Others
6.5. Market Attractiveness, by Form
7. Global Polyacrylamides Market Analysis, By Application
7.1. Introduction
7.2. Key Findings
7.3. Key Trends
7.4. Market Size (US$ Mn) and Volume (Kilo Tons) Forecast, by Application
7.4.1. Waste Water Treatment
7.4.2. Oil & Gas
7.4.3. Mining
7.4.4. Agriculture
7.4.5. Paper & Pulp
7.4.6. Paints & Coatings
7.4.7. Textiles
7.4.8. Food
7.4.9. Others
7.5. Market Attractiveness, by Form
8. Global Polyacrylamides Market Analysis, By Region
8.1. Global Polyacrylamides Market Scenario, by Region, 2018
8.2. Key Findings
8.3. Market Size (US$ Mn) and Volume (Kilo Tons) Forecast, by Region
8.3.1. North America
8.3.2. Europe
8.3.3. Asia Pacific
8.3.4. Latin America
8.3.5. Middle East & Africa
8.4. Market Attractiveness, by Country/Region
9. North America Polyacrylamides Market Analysis
9.1. Key Findings
9.2. Market Trends- Policies & Regulations
9.3. North America Polyacrylamides Market Size (US$ Mn) and Volume (Kilo Tons) Forecast, by Type, 2018-2027
9.4. North America Polyacrylamides Market Size (US$ Mn) and Volume (Kilo Tons) Forecast, by Form, 2018-2027
9.5. North America Polyacrylamides Market Size (US$ Mn) and Volume (Kilo Tons) Forecast, by Application, 2018-2027
9.6. North America Polyacrylamides Market Size (US$ Mn) and Volume (Kilo Tons) Forecast, by Country, 2018-2027
9.6.1. U.S. Polyacrylamides Market Size (US$ Mn) and Volume (Kilo Tons) Forecast, by Type, 2018-2027
9.6.2. U.S. Polyacrylamides Market Size (US$ Mn) and Volume (Kilo Tons) Forecast, by Form, 2018-2027
9.6.3. U.S. Polyacrylamides Market Size (US$ Mn) and Volume (Kilo Tons) Forecast, by Application, 2018-2027
9.6.4. Canada Polyacrylamides Market Size (US$ Mn) and Volume (Kilo Tons) Forecast, by Type, 2018-2027
9.6.5. Canada Polyacrylamides Market Size (US$ Mn) and Volume (Kilo Tons) Forecast, by Form, 2018-2027
9.6.6. Canada Polyacrylamides Market Size (US$ Mn) and Volume (Kilo Tons) Forecast, by Application, 2018-2027
9.7. North America Polyacrylamides Market Attractiveness Overview
9.8. PEST Analysis
10. Europe Polyacrylamides Market Analysis
10.1. Key Findings
10.2. Market Trends- Policies & Regulations
10.3. Europe Polyacrylamides Market Size (US$ Mn) and Volume (Kilo Tons) Forecast, by Type, 2018-2027
10.4. Europe Polyacrylamides Market Size (US$ Mn) and Volume (Kilo Tons) Forecast, by Form, 2018-2027
10.5. Europe Polyacrylamides Market Size (US$ Mn) and Volume (Kilo Tons) Forecast, by Application, 2018-2027
10.6. Europe Polyacrylamides Market Size (US$ Mn) and Volume (Kilo Tons) Forecast, by Country, 2018-2027
10.6.1. Germany Polyacrylamides Market Size (US$ Mn) and Volume (Kilo Tons) Forecast, by Type, 2018-2027
10.6.2. Germany Polyacrylamides Market Size (US$ Mn) and Volume (Kilo Tons) Forecast, by Form, 2018-2027
10.6.3. Germany Polyacrylamides Market Size (US$ Mn) and Volume (Kilo Tons) Forecast, by Application, 2018-2027
10.6.4. France Polyacrylamides Market Size (US$ Mn) and Volume (Kilo Tons) Forecast, by Type, 2018-2027
10.6.5. France Polyacrylamides Market Size (US$ Mn) and Volume (Kilo Tons) Forecast, by Form, 2018-2027
10.6.6. France Polyacrylamides Market Size (US$ Mn) and Volume (Kilo Tons) Forecast, by Application, 2018-2027
10.6.7. U.K. Polyacrylamides Market Size (US$ Mn) and Volume (Kilo Tons) Forecast, by Type, 2018-2027
10.6.8. U.K. Polyacrylamides Market Size (US$ Mn) and Volume (Kilo Tons) Forecast, by Form, 2018-2027
10.6.9. U.K. Polyacrylamides Market Size (US$ Mn) and Volume (Kilo Tons) Forecast, by Application, 2018-2027
10.6.10. Italy Polyacrylamides Market Size (US$ Mn) and Volume (Kilo Tons) Forecast, by Type, 2018-2027
10.6.11. Italy Polyacrylamides Market Size (US$ Mn) and Volume (Kilo Tons) Forecast, by Form, 2018-2027
10.6.12. Italy Polyacrylamides Market Size (US$ Mn) and Volume (Kilo Tons) Forecast, by Application, 2018-2027
10.6.13. Spain Polyacrylamides Market Size (US$ Mn) and Volume (Kilo Tons) Forecast, by Type, 2018-2027
10.6.14. Spain Polyacrylamides Market Size (US$ Mn) and Volume (Kilo Tons) Forecast, by Form, 2018-2027
10.6.15. Spain Polyacrylamides Market Size (US$ Mn) and Volume (Kilo Tons) Forecast, by Application, 2018-2027
10.6.16. Rest of Europe Polyacrylamides Market Size (US$ Mn) and Volume (Kilo Tons) Forecast, by Type, 2018-2027
10.6.17. Rest of Europe Polyacrylamides Market Size (US$ Mn) and Volume (Kilo Tons) Forecast, by Form, 2018-2027
10.6.18. Rest of Europe Polyacrylamides Market Size (US$ Mn) and Volume (Kilo Tons) Forecast, by Application, 2018-2027
10.7. Europe Polyacrylamides Market Attractiveness Overview
10.8. PEST Analysis
11. Asia Pacific Polyacrylamides Market Analysis
11.1. Key Findings
11.2. Market Trends- Policies & Regulations
11.3. Asia Pacific Polyacrylamides Market Size (US$ Mn) and Volume (Kilo Tons) Forecast, by Type, 2018-2027
11.4. Asia Pacific Polyacrylamides Market Size (US$ Mn) and Volume (Kilo Tons) Forecast, by Form, 2018-2027
11.5. Asia Pacific Polyacrylamides Market Size (US$ Mn) and Volume (Kilo Tons) Forecast, by Application, 2018-2027
11.6. Asia Pacific Polyacrylamides Market Size (US$ Mn) and Volume (Kilo Tons) Forecast, by Country, 2018-2027
11.6.1. China Polyacrylamides Market Size (US$ Mn) and Volume (Kilo Tons) Forecast, by Type, 2018-2027
11.6.2. China Polyacrylamides Market Size (US$ Mn) and Volume (Kilo Tons) Forecast, by Form, 2018-2027
11.6.3. China Polyacrylamides Market Size (US$ Mn) and Volume (Kilo Tons) Forecast, by Application, 2018-2027
11.6.4. Japan Polyacrylamides Market Size (US$ Mn) and Volume (Kilo Tons) Forecast, by Type, 2018-2027
11.6.5. Japan Polyacrylamides Market Size (US$ Mn) and Volume (Kilo Tons) Forecast, by Form, 2018-2027
11.6.6. Japan Polyacrylamides Market Size (US$ Mn) and Volume (Kilo Tons) Forecast, by Application, 2018-2027
11.6.7. India Polyacrylamides Market Size (US$ Mn) and Volume (Kilo Tons) Forecast, by Type, 2018-2027
11.6.8. India Polyacrylamides Market Size (US$ Mn) and Volume (Kilo Tons) Forecast, by Form, 2018-2027
11.6.9. India Polyacrylamides Market Size (US$ Mn) and Volume (Kilo Tons) Forecast, by Application, 2018-2027
11.6.10. ASEAN Polyacrylamides Market Size (US$ Mn) and Volume (Kilo Tons) Forecast, by Type, 2018-2027
11.6.11. ASEAN Polyacrylamides Market Size (US$ Mn) and Volume (Kilo Tons) Forecast, by Form, 2018-2027
11.6.12. ASEAN Polyacrylamides Market Size (US$ Mn) and Volume (Kilo Tons) Forecast, by Application, 2018-2027
11.6.13. Rest of Asia Pacific Polyacrylamides Market Size (US$ Mn) and Volume (Kilo Tons) Forecast, by Type, 2018-2027
11.6.14. Rest of Asia Pacific Polyacrylamides Market Size (US$ Mn) and Volume (Kilo Tons) Forecast, by Form, 2018-2027
11.6.15. Rest of Asia Pacific Polyacrylamides Market Size (US$ Mn) and Volume (Kilo Tons) Forecast, by Application, 2018-2027
11.7. Asia Pacific Polyacrylamides Market Attractiveness Overview
11.8. PEST Analysis
12. Middle East & Africa Polyacrylamides Market Analysis
12.1. Key Findings
12.2. Market Trends- Policies & Regulations
12.3. Middle East & Africa (MEA) Polyacrylamides Market Size (US$ Mn) and Volume (Kilo Tons) Forecast, by Type, 2018-2027
12.4. Middle East & Africa (MEA) Polyacrylamides Market Size (US$ Mn) and Volume (Kilo Tons) Forecast, by Form, 2018-2027
12.5. Middle East & Africa (MEA) Polyacrylamides Market Size (US$ Mn) and Volume (Kilo Tons) Forecast, by Application, 2018-2027
12.6. Middle East & Africa (MEA) Polyacrylamides Market Size (US$ Mn) and Volume (Kilo Tons) Forecast, by Country, 2018-2027
12.6.1. GCC Polyacrylamides Market Size (US$ Mn) and Volume (Kilo Tons) Forecast, by Type, 2018-2027
12.6.2. GCC Polyacrylamides Market Size (US$ Mn) and Volume (Kilo Tons) Forecast, by Form, 2018-2027
12.6.3. GCC Polyacrylamides Market Size (US$ Mn) and Volume (Kilo Tons) Forecast, by Application, 2018-2027
12.6.4. South Africa Polyacrylamides Market Size (US$ Mn) and Volume (Kilo Tons) Forecast, by Type, 2018-2027
12.6.5. South Africa Polyacrylamides Market Size (US$ Mn) and Volume (Kilo Tons) Forecast, by Form, 2018-2027
12.6.6. South Africa Polyacrylamides Market Size (US$ Mn) and Volume (Kilo Tons) Forecast, by Application, 2018-2027
12.6.7. Rest of MEA Polyacrylamides Market Size (US$ Mn) and Volume (Kilo Tons) Forecast, by Type, 2018-2027
12.6.8. Rest of MEA Polyacrylamides Market Size (US$ Mn) and Volume (Kilo Tons) Forecast, by Form, 2018-2027
12.6.9. Rest of MEA Polyacrylamides Market Size (US$ Mn) and Volume (Kilo Tons) Forecast, by Application, 2018-2027
12.7. Middle East & Africa (MEA) Polyacrylamides Market Attractiveness Overview
12.8. PEST Analysis
13. Latin America Polyacrylamides Market Analysis
13.1. Key Findings
13.2. Market Trends- Policies & Regulations
13.3. Latin America Polyacrylamides Market Size (US$ Mn) and Volume (Kilo Tons) Forecast, by Type, 2018-2027
13.4. Latin America Polyacrylamides Market Size (US$ Mn) and Volume (Kilo Tons) Forecast, by Form, 2018-2027
13.5. Latin America Polyacrylamides Market Size (US$ Mn) and Volume (Kilo Tons) Forecast, by Application, 2018-2027
13.6. Latin America Polyacrylamides Market Size (US$ Mn) and Volume (Kilo Tons) Forecast, by Country, 2018-2027
13.6.1. Brazil Polyacrylamides Market Size (US$ Mn) and Volume (Kilo Tons) Forecast, by Type, 2018-2027
13.6.2. Brazil Polyacrylamides Market Size (US$ Mn) and Volume (Kilo Tons) Forecast, by Form, 2018-2027
13.6.3. Brazil Polyacrylamides Market Size (US$ Mn) and Volume (Kilo Tons) Forecast, by Application, 2018-2027
13.6.4. Mexico Polyacrylamides Market Size (US$ Mn) and Volume (Kilo Tons) Forecast, by Type, 2018-2027
13.6.5. Mexico Polyacrylamides Market Size (US$ Mn) and Volume (Kilo Tons) Forecast, by Form, 2018-2027
13.6.6. Mexico Polyacrylamides Market Size (US$ Mn) and Volume (Kilo Tons) Forecast, by Application, 2018-2027
13.6.7. Rest of Latin America Polyacrylamides Market Size (US$ Mn) and Volume (Kilo Tons) Forecast, by Type, 2018-2027
13.6.8. Rest of Latin America Polyacrylamides Market Size (US$ Mn) and Volume (Kilo Tons) Forecast, by Form, 2018-2027
13.6.9. Rest of Latin America Polyacrylamides Market Size (US$ Mn) and Volume (Kilo Tons) Forecast, by Application, 2018-2027
13.7. Latin America Polyacrylamides Market Attractiveness Overview
13.8. PEST Analysis
14. Competition Landscape
14.1. Market Player – Competition Matrix
14.2. Market Share Analysis by Company (2018)
14.3. Market Players
14.3.1. Accepta
14.3.1.1. Company Description
14.3.1.2. Business Overview
14.3.2. Anhui Jucheng Fine Chemicals Co. Ltd.
14.3.2.1. Company Description
14.3.2.2. Business Overview
14.3.3. Aqua Ben Corporation
14.3.3.1. Company Description
14.3.3.2. Business Overview
14.3.4. Ashland Inc.
14.3.4.1. Company Description
14.3.4.2. Business Overview
14.3.4.3. Financial Details
14.3.4.4. Strategic Overview
14.3.5. BASF SE
14.3.5.1. Company Description
14.3.5.2. Business Overview
14.3.5.3. Financial Details
14.3.5.4. Strategic Overview
14.3.6. Bio-Rad Laboratories
14.3.6.1. Company Description
14.3.6.2. Business Overview
14.3.6.3. Financial Details
14.3.6.4. Strategic Overview
14.3.7. Jiangxi Changjiu Agrochemicals Co. Ltd.
14.3.7.1. Company Description
14.3.7.2. Business Overview
14.3.7.3. Ke Gao Chemical Co. Ltd.
14.3.7.4. Company Description
14.3.7.5. Business Overview
14.3.8. Kemira Oyj
14.3.8.1. Company Description
14.3.8.2. Business Overview
14.3.8.3. Strategic Overview
14.3.9. Polysciences Inc.
14.3.9.1. Company Description
14.3.9.2. Business Overview
14.3.9.3. Strategic Overview
14.3.10. Shandong Jiahua Water Treatment Technology Co. Ltd.
14.3.10.1. Company Description
14.3.10.2. Business Overview
14.3.11. SNF Group
14.3.11.1. Company Description
14.3.11.2. Business Overview
14.3.11.3. Strategic Overview
14.3.12. Solenis LLC
14.3.12.1. Company Description
14.3.12.2. Business Overview
14.3.12.3. Strategic Overview
14.3.13. Yixing Bluwat Chemicals Co. Ltd.
14.3.13.1. Company Description
14.3.13.2. Business Overview
14.3.14. Zhejiang Xinyong Bio-chemical Co. Ltd.
14.3.14.1. Company Description
14.3.14.2. Business Overview
15. Primary Research – Key Insights
List of Tables
Table 01: Global Polyacrylamide Market Size (US$ Mn) and Volume (Kilo Tons) Forecast, By Type, 2018–2027
Table 02: Global Polyacrylamide Market Size (US$ Mn) and Volume (Kilo Tons) Forecast, By Form, 2018–2027
Table 03: Global Polyacrylamide Market Size (US$ Mn) and Volume (Kilo Tons) Forecast, By Application, 2018–2027
Table 04: Global Polyacrylamide Market Size (US$ Mn) and Volume (Kilo Tons) Forecast, By Application, 2018–2027
Table 05: Global Polyacrylamide Market Size (US$ Mn) and Volume (Kilo Tons) Forecast, By Region, 2018–2027
Table 06: North America Polyacrylamide Market Size (US$ Mn) and Market Volume (Kilo Tons) Forecast, By Type, 2018–2027
Table 07: North America Polyacrylamide Market Size (US$ Mn) and Market Volume (Kilo Tons) Forecast, By Form, 2018–2027
Table 08: North America Polyacrylamide Market Size (US$ Mn) and Market Volume (Kilo Tons) Forecast, By Application, 2018–2027
Table 09: North America Polyacrylamide Market Size (US$ Mn) and Market Volume (Kilo Tons) Forecast, By Application, 2018–2027
Table 10: North America Polyacrylamide Market Size (US$ Mn) and Market Volume (Kilo Tons) Forecast, By Country, 2018–2027
Table 11: U.S. Polyacrylamide Market Size (US$ Mn) and Market Volume (Kilo Tons) Forecast, By Type, 2018–2027
Table 12: U.S. Polyacrylamide Market Size (US$ Mn) and Market Volume (Kilo Tons) Forecast, By Form, 2018–2027
Table 13: U.S. Polyacrylamide Market Size (US$ Mn) and Market Volume (Kilo Tons) Forecast, By Application, 2018–2027
Table 14: U.S. Polyacrylamide Market Size (US$ Mn) and Market Volume (Kilo Tons) Forecast, By Application, 2018–2027
Table 15: Canada Polyacrylamide Market Size (US$ Mn) and Market Volume (Kilo Tons) Forecast, By Type, 2018–2027
Table 16: Canada Polyacrylamide Market Size (US$ Mn) and Market Volume (Kilo Tons) Forecast, By Form, 2018–2027
Table 17: Canada Polyacrylamide Market Size (US$ Mn) and Market Volume (Kilo Tons) Forecast, By Application, 2018–2027
Table 18: Canada Polyacrylamide Market Size (US$ Mn) and Market Volume (Kilo Tons) Forecast, By Application, 2018–2027
Table 19: Europe Polyacrylamide Market Size (US$ Mn) and Market Volume (Kilo Tons) Forecast, By Type, 2018–2027
Table 20: Europe Polyacrylamide Market Size (US$ Mn) and Market Volume (Kilo Tons) Forecast, By Form, 2018–2027
Table 21: Europe Polyacrylamide Market Size (US$ Mn) and Market Volume (Kilo Tons) Forecast, By Application, 2018–2027
Table 22: Europe Polyacrylamide Market Size (US$ Mn) and Market Volume (Kilo Tons) Forecast, By Application, 2018–2027
Table 23: Europe Polyacrylamide Market Size (US$ Mn) and Market Volume (Kilo Tons) Forecast, By Country, 2018–2027
Table 24: Germany Polyacrylamide Market Size (US$ Mn) and Market Volume (Kilo Tons) Forecast, By Type, 2018–2027
Table 25: Germany Polyacrylamide Market Size (US$ Mn) and Market Volume (Kilo Tons) Forecast, By Form, 2018–2027
Table 26: Germany Polyacrylamide Market Size (US$ Mn) and Market Volume (Kilo Tons) Forecast, By Application, 2018–2027
Table 27: Germany Polyacrylamide Market Size (US$ Mn) and Market Volume (Kilo Tons) Forecast, By Application, 2018–2027
Table 28: France Polyacrylamide Market Size (US$ Mn) and Market Volume (Kilo Tons) Forecast, By Type, 2018–2027
Table 29: France Polyacrylamide Market Size (US$ Mn) and Market Volume (Kilo Tons) Forecast, By Form, 2018–2027
Table 30: France Polyacrylamide Market Size (US$ Mn) and Market Volume (Kilo Tons) Forecast, By Application, 2018–2027
Table 31: France Polyacrylamide Market Size (US$ Mn) and Market Volume (Kilo Tons) Forecast, By Application, 2018–2027
Table 32: U.K. Polyacrylamide Market Size (US$ Mn) and Market Volume (Kilo Tons) Forecast, By Type, 2018–2027
Table 33: U.K. Polyacrylamide Market Size (US$ Mn) and Market Volume (Kilo Tons) Forecast, By Form, 2018–2027
Table 34: U.K. Polyacrylamide Market Size (US$ Mn) and Market Volume (Kilo Tons) Forecast, By Application, 2018–2027
Table 35: U.K. Polyacrylamide Market Size (US$ Mn) and Market Volume (Kilo Tons) Forecast, By Application, 2018–2027
Table 36: Italy Polyacrylamide Market Size (US$ Mn) and Market Volume (Kilo Tons) Forecast, By Type, 2018–2027
Table 37: Italy Polyacrylamide Market Size (US$ Mn) and Market Volume (Kilo Tons) Forecast, By Form, 2018–2027
Table 38: Italy Polyacrylamide Market Size (US$ Mn) and Market Volume (Kilo Tons) Forecast, By Application, 2018–2027
Table 39: Italy Polyacrylamide Market Size (US$ Mn) and Market Volume (Kilo Tons) Forecast, By Application, 2018–2027
Table 40: Spain Polyacrylamide Market Size (US$ Mn) and Market Volume (Kilo Tons) Forecast, By Type, 2018–2027
Table 41: Spain Polyacrylamide Market Size (US$ Mn) and Market Volume (Kilo Tons) Forecast, By Form, 2018–2027
Table 42: Spain Polyacrylamide Market Size (US$ Mn) and Market Volume (Kilo Tons) Forecast, By Application, 2018–2027
Table 43: Spain Polyacrylamide Market Size (US$ Mn) and Market Volume (Kilo Tons) Forecast, By Application, 2018–2027
Table 44: Rest of Europe Polyacrylamide Market Size (US$ Mn) and Market Volume (Kilo Tons) Forecast, By Type, 2018–2027
Table 45: Rest of Europe Polyacrylamide Market Size (US$ Mn) and Market Volume (Kilo Tons) Forecast, By Form, 2018–2027
Table 46: Rest of Europe Polyacrylamide Market Size (US$ Mn) and Market Volume (Kilo Tons) Forecast, By Application, 2018–2027
Table 47: Rest of Europe Polyacrylamide Market Size (US$ Mn) and Market Volume (Kilo Tons) Forecast, By Application, 2018–2027
Table 48: Asia Pacific Polyacrylamide Market Size (US$ Mn) and Market Volume (Kilo Tons) Forecast, By Type, 2018–2027
Table 49: Asia Pacific Polyacrylamide Market Size (US$ Mn) and Market Volume (Kilo Tons) Forecast, By Form, 2018–2027
Table 50: Asia Pacific Polyacrylamide Market Size (US$ Mn) and Market Volume (Kilo Tons) Forecast, By Application, 2018–2027
Table 51: Asia Pacific Polyacrylamide Market Size (US$ Mn) and Market Volume (Kilo Tons) Forecast, By Application, 2018–2027
Table 52: Asia Pacific Polyacrylamide Market Size (US$ Mn) and Market Volume (Kilo Tons) Forecast, By Country, 2018–2027
Table 53: China Polyacrylamide Market Size (US$ Mn) and Market Volume (Kilo Tons) Forecast, By Type, 2018–2027
Table 54: China Polyacrylamide Market Size (US$ Mn) and Market Volume (Kilo Tons) Forecast, By Form, 2018–2027
Table 55: China Polyacrylamide Market Size (US$ Mn) and Market Volume (Kilo Tons) Forecast, By Application, 2018–2027
Table 56: China Polyacrylamide Market Size (US$ Mn) and Market Volume (Kilo Tons) Forecast, By Application, 2018–2027
Table 57: Japan Polyacrylamide Market Size (US$ Mn) and Market Volume (Kilo Tons) Forecast, By Type, 2018–2027
Table 58: Japan Polyacrylamide Market Size (US$ Mn) and Market Volume (Kilo Tons) Forecast, By Form, 2018–2027
Table 59: Japan Polyacrylamide Market Size (US$ Mn) and Market Volume (Kilo Tons) Forecast, By Application, 2018–2027
Table 60: Japan Polyacrylamide Market Size (US$ Mn) and Market Volume (Kilo Tons) Forecast, By Application, 2018–2027
Table 61: India Polyacrylamide Market Size (US$ Mn) and Market Volume (Kilo Tons) Forecast, By Type, 2018–2027
Table 62: India Polyacrylamide Market Size (US$ Mn) and Market Volume (Kilo Tons) Forecast, By Form, 2018–2027
Table 63: India Polyacrylamide Market Size (US$ Mn) and Market Volume (Kilo Tons) Forecast, By Application, 2018–2027
Table 64: India Polyacrylamide Market Size (US$ Mn) and Market Volume (Kilo Tons) Forecast, By Application, 2018–2027
Table 65: ASEAN Polyacrylamide Market Size (US$ Mn) and Market Volume (Kilo Tons) Forecast, By Type, 2018–2027
Table 66: ASEAN Polyacrylamide Market Size (US$ Mn) and Market Volume (Kilo Tons) Forecast, By Form, 2018–2027
Table 67: ASEAN Polyacrylamide Market Size (US$ Mn) and Market Volume (Kilo Tons) Forecast, By Application, 2018–2027
Table 68: ASEAN Polyacrylamide Market Size (US$ Mn) and Market Volume (Kilo Tons) Forecast, By Application, 2018–2027
Table 69: Rest of Asia Pacific Polyacrylamide Market Size (US$ Mn) and Market Volume (Kilo Tons) Forecast, By Type, 2018–2027
Table 70: Rest of Asia Pacific Polyacrylamide Market Size (US$ Mn) and Market Volume (Kilo Tons) Forecast, By Form, 2018–2027
Table 71: Rest of Asia Pacific Polyacrylamide Market Size (US$ Mn) and Market Volume (Kilo Tons) Forecast, By Application, 2018–2027
Table 72: Rest of Asia Pacific Polyacrylamide Market Size (US$ Mn) and Market Volume (Kilo Tons) Forecast, By Application, 2018–2027
Table 73: Latin America Polyacrylamide Market Size (US$ Mn) and Market Volume (Kilo Tons) Forecast, By Type,
Table 74: Latin America Polyacrylamide Market Size (US$ Mn) and Market Volume (Kilo Tons) Forecast, By Form, 2018–2027
Table 75: Latin America Polyacrylamide Market Size (US$ Mn) and Market Volume (Kilo Tons) Forecast, By Application, 2018–2027
Table 76: Latin America Polyacrylamide Market Size (US$ Mn) and Market Volume (Kilo Tons) Forecast, By Application, 2018–2027
Table 77: Latin America Polyacrylamide Market Size (US$ Mn) and Market Volume (Kilo Tons) Forecast, By Country, 2018–2027
Table 78: Brazil Polyacrylamide Market Size (US$ Mn) and Market Volume (Kilo Tons) Forecast, By Type, 2018–2027
Table 79: Brazil Polyacrylamide Market Size (US$ Mn) and Market Volume (Kilo Tons) Forecast, By Form, 2018–2027
Table 80: Brazil Polyacrylamide Market Size (US$ Mn) and Market Volume (Kilo Tons) Forecast, By Application, 2018–2027
Table 81: Brazil Polyacrylamide Market Size (US$ Mn) and Market Volume (Kilo Tons) Forecast, By Application, 2018–2027
Table 82: Mexico Polyacrylamide Market Size (US$ Mn) and Market Volume (Kilo Tons) Forecast, By Type, 2018–2027
Table 83: Mexico Polyacrylamide Market Size (US$ Mn) and Market Volume (Kilo Tons) Forecast, By Form, 2018–2027
Table 84: Mexico Polyacrylamide Market Size (US$ Mn) and Market Volume (Kilo Tons) Forecast, By Application, 2018–2027
Table 85: Mexico Polyacrylamide Market Size (US$ Mn) and Market Volume (Kilo Tons) Forecast, By Application, 2018–2027
Table 86: Rest of Latin America Polyacrylamide Market Size (US$ Mn) and Market Volume (Kilo Tons) Forecast, By Type, 2018–2027
Table 87: Rest of Latin America Polyacrylamide Market Size (US$ Mn) and Market Volume (Kilo Tons) Forecast, By Form, 2018–2027
Table 88: Rest of Latin America Polyacrylamide Market Size (US$ Mn) and Market Volume (Kilo Tons) Forecast, By Application, 2018–2027
Table 89: Rest of Latin America Polyacrylamide Market Size (US$ Mn) and Market Volume (Kilo Tons) Forecast, By Application, 2018–2027
Table 90: Middle East & Africa Polyacrylamide Market Size (US$ Mn) and Market Volume (Kilo Tons) Forecast, By Type, 2018–2027
Table 91: Middle East & Africa Polyacrylamide Market Size (US$ Mn) and Market Volume (Kilo Tons) Forecast, By Form, 2018–2027
Table 92: Middle East & Africa Polyacrylamide Market Size (US$ Mn) and Market Volume (Kilo Tons) Forecast, By Application, 2018–2027
Table 93: Middle East & Africa Polyacrylamide Market Size (US$ Mn) and Market Volume (Kilo Tons) Forecast, By Application, 2018–2027
Table 94: Middle East & Africa Polyacrylamide Market Size (US$ Mn) and Market Volume (Kilo Tons) Forecast, By Country, 2018–2027
Table 95: GCC Polyacrylamide Market Size (US$ Mn) and Market Volume (Kilo Tons) Forecast, By Type, 2018–2027
Table 96: GCC Polyacrylamide Market Size (US$ Mn) and Market Volume (Kilo Tons) Forecast, By Form, 2018–2027
Table 97: GCC Polyacrylamide Market Size (US$ Mn) and Market Volume (Kilo Tons) Forecast, By Application, 2018–2027
Table 98: GCC Polyacrylamide Market Size (US$ Mn) and Market Volume (Kilo Tons) Forecast, By Application, 2018–2027
Table 99: South Africa Polyacrylamide Market Size (US$ Mn) and Market Volume (Kilo Tons) Forecast, By Type, 2018–2027
Table 100: South Africa Polyacrylamide Market Size (US$ Mn) and Market Volume (Kilo Tons) Forecast, By Form, 2018–2027
Table 101: South Africa Polyacrylamide Market Size (US$ Mn) and Market Volume (Kilo Tons) Forecast, By Application, 2018–2027
Table 102: South Africa Polyacrylamide Market Size (US$ Mn) and Market Volume (Kilo Tons) Forecast, By Application, 2018–2027
Table 103: Rest of Middle East & Africa Polyacrylamide Market Size (US$ Mn) and Market Volume (Kilo Tons) Forecast, By Type, 2018–2027
Table 104: Rest of Middle East & Africa Polyacrylamide Market Size (US$ Mn) and Market Volume (Kilo Tons) Forecast, By Form, 2018–2027
Table 105: Rest of Middle East & Africa Polyacrylamide Market Size (US$ Mn) and Market Volume (Kilo Tons) Forecast, By Application, 2018–2027
Table 106: Rest of Middle East & Africa Polyacrylamide Market Size (US$ Mn) and Market Volume (Kilo Tons) Forecast, By Application, 2018–2027
List of Figures
Figure 01: Polyacrylamide Market Size (US$ Mn) and Volume (Kilo Tons) Forecast, 2018–2027
Figure 02: Polyacrylamide Price Trend Analysis (US$/Ton) 2018–2027
Figure 03: Global Polyacrylamide Market, Volume Share Analysis, By Type, 2019 and 2027
Figure 04: Anionic Market Value (US$ Mn) and Volume (Kilo Tons) Forecast, 2018–2027
Figure 05: Cationic Market Value (US$ Mn) and Volume (Kilo Tons) Forecast, 2018–2027
Figure 06: Non-ionic Market Value (US$ Mn) and Volume (Kilo Tons) Forecast, 2018–2027
Figure 07: Others Market Value (US$ Mn) and Volume (Kilo Tons) Forecast, 2018–2027
Figure 08: Global Polyacrylamide Market Attractiveness Analysis, By Type, 2018
Figure 09: Global Polyacrylamide Market, Volume Share Analysis, By Form, 2019 and 2027
Figure 10: Powder Value (US$ Mn) and Volume (Kilo Tons) Forecast, 2018–2027
Figure 11: Emulsion Value (US$ Mn) and Volume (Kilo Tons) Forecast, 2018–2027
Figure 12: Gel Value (US$ Mn) and Volume (Kilo Tons) Forecast, 2018–2027
Figure 13: Others Value (US$ Mn) and Volume (Kilo Tons) Forecast, 2018–2027
Figure 14: Global Polyacrylamide Market Attractiveness Analysis, By Form, 2018
Figure 15: Global Polyacrylamide Market, Value Share Analysis, By Application, 2019 and 2027
Figure 16: Waste Water Treatment Value (US$ Mn) and Volume (Kilo Tons) Forecast, 2018–2027
Figure 17: Oil & Gas Extraction Value (US$ Mn) and Volume (Kilo Tons) Forecast, 2018–2027
Figure 18: Mining Value (US$ Mn) and Volume (Kilo Tons) Forecast, 2018–2027
Figure 19: Agriculture Value (US$ Mn) and Volume (Kilo Tons) Forecast, 2018–2027
Figure 20: Paper & Pulp Value (US$ Mn) and Volume (Kilo Tons) Forecast, 2018–2027
Figure 21: Paints & Coatings Value (US$ Mn) and Volume (Kilo Tons) Forecast, 2018–2027
Figure 22: Textiles Value (US$ Mn) and Volume (Kilo Tons) Forecast, 2018–2027
Figure 23: Food Value (US$ Mn) and Volume (Kilo Tons) Forecast, 2018–2027
Figure 24: Others Value (US$ Mn) and Volume (Kilo Tons) Forecast, 2018–2027
Figure 25: Global Polyacrylamide Market Attractiveness Analysis, By Application, 2018
Figure 26: Global Polyacrylamide Market Volume Share Analysis, By Region, 2019 and 2027
Figure 27: Global Polyacrylamide Market Attractiveness Analysis, By Region, 2018
Figure 28: North America Polyacrylamide Market Size (US$ Mn) and Volume (Kilo Tons) Forecast, 2018–2027
Figure 29: North America Polyacrylamide Market Size and Volume Y-o-Y Growth Projections, 2018–2027
Figure 30: North America Polyacrylamide Market Price (US$/Ton) Forecast, 2018–2027
Figure 31: North America Polyacrylamide Market Volume Share Analysis By Type, 2019 and 2027
Figure 32: North America Polyacrylamide Market Volume Share Analysis By Form, 2019 and 2027
Figure 33: North America Polyacrylamide Market Volume Share Analysis By Application, 2019 and 2027
Figure 34: North America Polyacrylamide Market Volume Share Analysis By Country, 2019 and 2027
Figure 36: North America Polyacrylamide Market Attractiveness, By Form
Figure 38: North America Polyacrylamide Market Attractiveness, By Country
Figure 35: North America Polyacrylamide Market Attractiveness, By Type
Figure 37: North America Polyacrylamide Market Attractiveness, By Application
Figure 39: Europe Polyacrylamide Market Size (US$ Mn) and Volume (Kilo Tons) Forecast, 2018–2027
Figure 40: Europe Polyacrylamide Market Size and Volume Y-o-Y Growth Projections, 2018–2027
Figure 41: Europe Polyacrylamide Market Price (US$/Ton) Forecast, 2018–2027
Figure 42: Europe Polyacrylamide Market Volume Share Analysis By Type, 2019 and 2027
Figure 43: Europe Polyacrylamide Market Volume Share Analysis By Form, 2019 and 2027
Figure 44: Europe Polyacrylamide Market Volume Share Analysis By Application, 2019 and 2027
Figure 45: Europe Market Volume Share Analysis By Country, 2019 and 2027
Figure 47: Europe Polyacrylamide Market Attractiveness, By Form
Figure 49: Europe Polyacrylamide Market Attractiveness, By Country
Figure 46: Europe Polyacrylamide Market Attractiveness, By Type
Figure 48: Europe Polyacrylamide Market Attractiveness, By Application
Figure 50: Asia Pacific Polyacrylamide Market Size (US$ Mn) and Volume (Kilo Tons) Forecast, 2018–2027
Figure 51: Asia Pacific Polyacrylamide Market Size and Volume Y-o-Y Growth Projections, 2018–2027
Figure 52: Asia Pacific Polyacrylamide Market Price (US$/Ton) Forecast, 2018–2027
Figure 53: Asia Pacific Polyacrylamide Market Volume Share Analysis By Type, 2019 and 2027
Figure 54: Asia Pacific Polyacrylamide Market Volume Share Analysis By Form, 2019 and 2027
Figure 55: Asia Pacific Polyacrylamide Market Volume Share Analysis By Application, 2019 and 2027
Figure 56: Asia Pacific Polyacrylamide Market Volume Share Analysis By Country, 2019 and 2027
Figure 58: Asia Pacific Polyacrylamide Market Attractiveness, By Form
Figure 60: Asia Pacific Polyacrylamide Market Attractiveness, By Country
Figure 57: Asia Pacific Polyacrylamide Market Attractiveness, By Type
Figure 59: Asia Pacific Polyacrylamide Market Attractiveness, By Application
Figure 61: Latin America Polyacrylamide Market Size (US$ Mn) and Volume (Kilo Tons) Forecast, 2018–2027
Figure 62: Latin America Polyacrylamide Market Size and Volume Y-o-Y Growth Projections, 2018–2027
Figure 63: Latin America Polyacrylamide Market Price (US$/Ton) Forecast, 2018–2027
Figure 64: Latin America Polyacrylamide Market Volume Share Analysis By Type, 2019 and 2027
Figure 65: Latin America Polyacrylamide Market Volume Share Analysis By Form, 2019 and 2027
Figure 66: Latin America Polyacrylamide Market Volume Share Analysis By Application, 2019 and 2027
Figure 67: Latin America Polyacrylamide Market Volume Share Analysis By Country, 2019 and 2027
Figure 69: Latin America Polyacrylamide Market Attractiveness, By Form
Figure 71: Latin America Polyacrylamide Market Attractiveness, By Country
Figure 68: Latin America Polyacrylamide Market Attractiveness, By Type
Figure 70: Latin America Polyacrylamide Market Attractiveness, By Application
Figure 72: Middle East & Africa Polyacrylamide Market Size (US$ Mn) and Volume (Kilo Tons) Forecast, 2018–2027
Figure 73: Middle East & Africa Polyacrylamide Market Size and Volume Y-o-Y Growth Projections, 2018–2027
Figure 74: Middle East & Africa Region Polyacrylamide Market Price (US$/Ton) Forecast, 2018–2027
Figure 75: Middle East & Africa Polyacrylamide Market Volume Share Analysis By Type, 2019 and 2027
Figure 76: Middle East & Africa Polyacrylamide Market Volume Share Analysis By Form, 2019 and 2027
Figure 77: Middle East & Africa Polyacrylamide Market Volume Share Analysis By Application, 2019 and 2027
Figure 78: Middle East & Africa Polyacrylamide Market Volume Share Analysis By Country, 2019 and 2027
Figure 80: Middle East & Africa Polyacrylamide Market Attractiveness, By Form
Figure 82: Middle East & Africa Polyacrylamide Market Attractiveness, By Country
Figure 79: Middle East & Africa Polyacrylamide Market Attractiveness, By Type
Figure 81: Middle East & Africa Polyacrylamide Market Attractiveness, By Application
Figure 83: Global Polyacrylamide Market Share Analysis By Company (2018)
Copyright © Transparency Market Research, Inc. All Rights reserved
Trust Online

Polyacrylamide Market