
Reports
Reports
Global Plasma Protease C1-inhibitor Treatment Market: Snapshot
The global plasma protease C1-inhibitor treatment market is foreseen to display robust growth in the future due to the increasing cases of acute hereditary angioedema (HAE) and prophylaxis. The emergence of a few drug variants of C1-inhibitor is considered to be a major breakthrough for patients suffering from HAE that are administered either intravenously or subcutaneously.
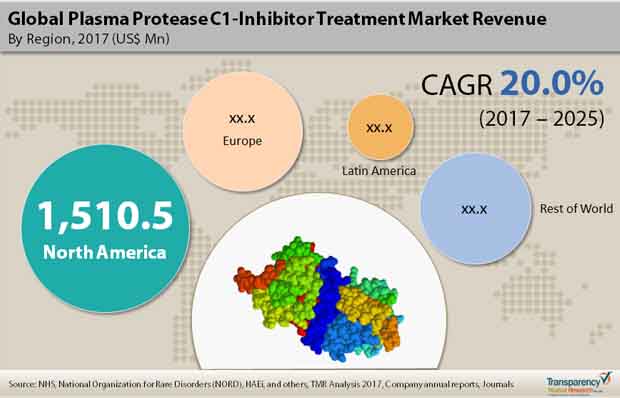
According to a report by Transparency Market Research (TMR), the global plasma protease C1-inhibitor treatment market was evaluated at US$1.5 bn in 2016. The report forecasts the demand in the global plasma protease C1-inhibitor market will rise at a robust 20.0% CAGR for the forecast period of 2017 to 2025, for the market to be valued at US$7.9 bn by the end of 2025.
Extensive Use for HAE Makes C1-inhibitor Drug Class Dominant
Based on drug class, the global plasma protease C1-inhibitor market is classified into C1-inhibitor, Kallikrein inhibitor, and selective Bradykinin B2 receptor antagonist (Firazyr). The C1-inhibitor segment held the leading market share in 2016 as these drugs are widely used for the treatment of acute HAE and prophylaxis. The segment of Selective Bradykining B2 Receptor is anticipated to display the leading growth rate over the forecast period. This is mainly because of expanding R&D activities that key players are engaged in for the development of new C1-inhibitor deficiency drugs that can be administered subcutaneously. On the other hand, the segment of Kallikrein inhibitor (Kalbitor) is predicted to register a moderate CAGR between 2017 and 2025. The growth of Kallikrein inhibitor segment is attributable to the rising preference for self-administrable drugs. Moreover, the rising preference for Firazyr is anticipated to hamper the growth of Kalbitor segment. However, increasing approval of Kallikrein drugs and positive results obtained for pre-clinical treatment of HAE cases are likely to augment the growth rate of this segment moderately over the forecast period.
On the basis of dosage type, the market is segregated into lyophilized and liquid/injectable. Of the two, lyophilized segment held the leading market share in 2016 on the back of increasing practice of intravenous administration of drugs for the treatment of HAE. Further, rising demand for intravenous C1 esterase inhibitor drugs in emerging markets of Asia Pacific and Latin America is anticipated to positively influence the lyophilized segment.
However, the liquid/injectable segment is likely to hold significant market share by 2025 due to several factors. This includes rising demand for subcutaneous administration of drugs, less adverse effects, cost effectiveness, and increased preference for Firazyr over Kalbitor by physicians. The expected launch of subcutaneous Cinryze, Berinert, and DX-2930 will further hamper the growth of lyophilized segment. To stay competitive, companies are vying to introduce the subcutaneous variants of Cinryze and Berinet for prophylactic treatment and are expected to be commercially available by 2019 and 2018 respectively. Despite the liquid/injectable nature of Firazyr and Kalbitor the side-effects associated with them can hamper the liquid/injectable segment over the forecast period.
In terms of distribution channel, the market has been bifurcated into hospital pharmacies and independent pharmacies & outlets in this report. Of the two, independent pharmacies & outlets dominated the market in 2016; the segment is anticipated to hold dominance through 2025.
North America to Lead Plasma Protease C1-inhibitor Treatment Market through 2025
Geographically, the plasma protease C1-inhibitor treatment market is divided into four key regions, namely North America, Europe, Latin America, and Rest of the World. Among these, North America stood as the leading contributor to the worldwide market for plasma protease C1-inhibitor treatment market in 2016. High prevalence of HAE in the U.S. that are actually diagnosed and treated using C1-inhibitor drugs account for the leading growth of this regional market.
The global plasma protease C1-inhibitor treatment market features a highly consolidated vendor landscape. Shire plc, Pharming Group N.V., CSL Limited, and Sanquin are the key companies operating in this market.
Researchers Conscious about Risks of Angioedema to Boost Efficacy of Products in Plasma Protease C1-inhibitor Treatment Market
Human plasma-derived C1-esterase inhibitor has emerged as an effective and safe treatment for hereditary angioedema. The growing incidence of acute hereditary angioedema (HAE) and prophylaxis has propelled research on finding ways to administer and regulate C1-esterase inhibitor (C1-INH), thereby propelling the evolution of the plasma protease C1-inhibitor treatment market. The role of this is crucial in understanding the pathophysiology of HAE and the concentration of complexes C1-esterase inhibitor forms with proteases. Various tests and biomarkers have been developed to ascertain C1-INH deficiency, the reason having to do with the high morbidity and mortality of HAE in patient populations all over the world. Research on finding all possible ways of activating all C1-INH-regulated pathways are stridently expanding the possibilities in the plasma protease C1-inhibitor treatment market. In this regard, advances made in purified proteins and antibodies have expanded the prospects in the market. However, a common side effect in all treatment can be prothrombotic effects. To overcome the constraints, researchers have embarked on evaluating results from a number of vitro assays of coagulation markers and in vivo studies. Various animal models have helped them in their endeavors.
The COVID-19 pandemic and the various waves have played havoc with the healthcare systems of countries across the world. Developed and emerging nations have also been finding it hard to mitigate the morbidity of the disease. The death rates have also reached alarming levels in 2020 in numerous regions across the globe. The ugly aftermath of the pandemic on the economic systems continue to alarm governments and businesses across all industries. Thus, industry players have joined hands to concertedly combat the humanitarian crisis. They are also coming out with new models to connect with prospective customers and adopting strategies to emerge as responsibly organization amid the pandemic. The full impact of plasma protease C1-inhibitor treatment market is still to be ascertained. Unarguably, the pandemic has impeded research and clinical trials, raising the ante for businesses to gain competitiveness in the market.
1. Preface
1.1. Market Definition and Scope
1.2. Market Segmentation
1.3. Key Research Objectives
1.4. Research Highlights
2. Assumptions and Research Methodology
3. Executive Summary : Global Plasma Protease C1-Inhibitor Treatment Market
4. Market Overview
4.1. Introduction
4.2. Overview
4.3. Key Market Indicators
4.4. Market Dynamics
4.4.1. Drivers
4.4.2. Restraints
4.4.3. Opportunity
4.5. Global Plasma Protease C1-Inhibitor Treatment Market Analysis and Forecasts, 2015–2025
4.5.1. Market Revenue Projections (US$ Mn)
4.7. Porter’s Five Force Analysis
4.8. Market Outlook
4.9. Regulatory Scenario
4.10. Pipeline Analysis and Patent Launch/Expiry
4.11. Therapeutic Application & Biological Activities: C1-Esterase Inhibitor
4.12. Global Number of Procedures of Hereditary Angioedema Disease
4.13. Brand Analysis Plasma Protease C1-Inhibitor Drugs
4.14. Product Portfolio of Human C1-INH Plasma Protein
4.15. Research Institutes Involved In Hereditary Angioedema/Others Disease
5. Global Plasma Protease C1-Inhibitor Treatment Market Analysis and Forecasts, By Drug Class
5.1. Introduction & Definition
5.2. Key Trends
5.3. Market Forecast By Drug Class, 2015–2025
5.3.1. C1-Inhibitor
5.3.1.1. C1-Esterase Inhibitor
5.3.1.2. Recombinant Inhibitor
5.3.2. Kallikrein Inhibitor (Kalbitor)
5.3.3. Selective Bradykinin B2 Receptor Antagonist (Firazyr)
5.4. Market Attractiveness By Drug Class
6. Global Plasma Protease C1-Inhibitor Treatment Market Analysis and Forecasts, By Dosage Type
6.1. Introduction & Definition
6.2. Market Forecast By Dosage Type, 2015–2025
6.2.1. Lyophilized
6.2.2. Liquid/Injectable
6.3. Market Attractiveness By Dosage Type
7. Global Plasma Protease C1-Inhibitor Treatment Market Analysis and Forecasts, By Distribution Channel
7.1. Introduction & Definition
7.2. Key Trends
7.3. Market Forecast By Distribution Channel , 2015–2025
7.3.1. Hospital Pharmacies
7.3.2. Independent Pharmacies and Outlets
7.4. Market Attractiveness By Distribution Channel
8. Global Plasma Protease C1-Inhibitor Treatment Market Analysis and Forecasts, By Region
8.1. Key Findings
8.2. Market Forecast By Region
8.2.1. North America
8.2.2. Europe
8.2.3. Latin America
8.2.4. Rest of World
8.4. Market Attractiveness By Country/Region
9. North America Plasma Protease C1-Inhibitor Treatment Market Analysis and Forecast
9.1. Introduction
9.1.1. Key Trends
9.2. Market Forecast By Drug Class, 2015–2025
9.2.1. C1-Inhibitor
9.2.1.1. C1-Esterase Inhibitor
9.2.1.2. Recombinant Inhibitor
9.2.2. Kallikrein Inhibitor (Kalbitor)
9.2.3. Selective Bradykinin B2 Receptor Antagonist (Firazyr)
9.3. Market Forecast By Dosage Type, 2015–2025
9.3.1. Lyophilized
9.3.2. Liquid/Injectable
9.4. Market Forecast By Distribution Channel , 2015–2025
9.4.1. Hospital Pharmacies
9.4.2. Independent Pharmacies and Outlets
9.5. Market Forecast By Country, 2015–2025
9.5.1. U.S.
9.5.2. Canada
9.6. Market Attractiveness Analysis
9.6.1. By Drug Class
9.6.2. By Dosage Type
9.6.3. By Distribution Channel
9.6.4. By Country
10. Europe Plasma Protease C1-Inhibitor Treatment Market Analysis and Forecast
10.1. Introduction
10.1.1. Key Trends
10.2. Market Forecast By Drug Class, 2015–2025
10.2.1. C1-Inhibitor
10.2.1.1. C1-Esterase Inhibitor
10.2.1.2. Recombinant Inhibitor
10.2.2. Kallikrein Inhibitor (Kalbitor)
10.2.3. Selective Bradykinin B2 Receptor Antagonist (Firazyr)
10.3. Market Forecast By Dosage Type, 2015–2025
10.3.1. Lyophilized
10.3.2. Liquid/Injectable
10.4. Market Forecast By Distribution Channel, 2015–2025
10.4.1. Hospital Pharmacies
10.4.2. Independent Pharmacies and Outlets
10.5. Market Forecast By Country, 2015–2025
10.5.1. EU-5 Countries
10.5.2. BENELUX Countries
10.5.3. Rest of Europe
10.6. Market Attractiveness Analysis
10.6.1. By Drug Class
10.6.2. By Dosage Type
10.6.3. By Distribution Channel
10.6.4. By Country
11. Latin America Plasma Protease C1-Inhibitor Treatment Market Analysis and Forecast
11.1. Introduction
11.1.1. Key Trends
11.2. Market Forecast By Drug Class, 2015–2025
11.2.1. C1-Inhibitor
11.2.1.1. C1-Esterase Inhibitor
11.2.1.2. Recombinant Inhibitor
11.2.2. Kallikrein Inhibitor (Kalbitor)
11.2.3. Selective Bradykinin B2 Receptor Antagonist (Firazyr)
11.3. Market Forecast By Dosage Type, 2015–2025
11.3.1. Lyophilized
11.3.2. Liquid/Injectable
11.4. Market Forecast By Distribution Channel, 2015–2025
11.4.1. Hospital Pharmacies
11.4.2. Independent Pharmacies and Outlets
11.5. Market Forecast By Country, 2015–2025
11.5.1. Argentina
11.5.2. Brazil
11.5.3. Rest of Latin America
11.6. Market Attractiveness Analysis
11.6.1. By Drug Class
11.6.2. By Dosage Type
11.6.3. By Distribution Channel
11.6.4. By Country
12. Rest of World Plasma Protease C1-Inhibitor Treatment Market Analysis and Forecast
12.1. Introduction
12.1.1. Key Trends
12.2. Market Forecast By Drug Class, 2015–2025
12.2.1. C1-Inhibitor
12.2.1.1. C1-Esterase Inhibitor
12.2.1.2. Recombinant Inhibitor
12.2.2. Kallikrein Inhibitor (Kalbitor)
12.2.3. Selective Bradykinin B2 Receptor Antagonist (Firazyr)
12.3. Market Forecast By Dosage Type, 2015–2025
12.3.1. Lyophilized
12.3.2. Liquid/Injectable
12.4. Market Forecast By Distribution Channel, 2015–2025
12.4.1. Hospital Pharmacies
12.4.2. Independent Pharmacies and Outlets
12.5. Market Forecast By Country, 2015–2025
12.5.1. Australia
12.5.2. Israel
12.5.3. Rest of World Countries
12.6. Market Attractiveness Analysis
12.6.1. By Drug Class
12.6.2. By Dosage Type
12.6.3. By Distribution Channel
12.6.4. By Country
13. Competition Landscape
13.1. Market Player – Competition Matrix (By Tier and Size of companies)
13.2. Market Share Analysis By Company (2016)
13.3. Company Profiles (Details – Overview, Financials, Recent Developments, Strategy)
13.3.1. Shire plc
13.3.1.1. Overview (HQ, Employee Strength, Business Segments)
13.3.1.2. Financials
13.3.1.3. Recent Developments
13.3.1.4. Strategy
13.3.2. Pharming Group N.V.
13.3.2.1. Overview (HQ, Employee Strength, Business Segments)
13.3.2.2. Financials
13.3.2.3. Recent Developments
13.3.2.4. Strategy
13.3.3. Sanquin
13.3.3.1. Overview (HQ, Employee Strength, Business Segments)
13.3.3.2. Financials
13.3.3.3. Recent Developments
13.3.3.4. Strategy
13.3.4. CSL Limited
13.3.4.1. Overview (HQ, Employee Strength, Business Segments)
13.3.4.2. Financials
13.3.4.3. Recent Developments
13.3.4.4. Strategy
14. Key Take Aways
List of Tables
Table 01: Pipeline Analysis-Phase 3-by Product/Drug Candidate, 2015-2017
Table 02: Pipeline Analysis-Phase 1 & 2 – Preclinical-by Product/Drug Candidate, 2014-2016
Table 03: Pipeline Analysis-Recombinant Hormone/Drugs-by Product/Drug Candidate
Table 04: Pipeline Analysis-Recombinant Hormone/Drugs-by Product/Drug Candidate
Table 05: Pipeline Analysis-Recombinant Hormone/Drugs-by Product/Drug Candidate
Table 06: Pipeline Analysis-Recombinant Hormone/Drugs-by Product/Drug Candidate
Table 07: Pipeline Analysis-Recombinant Hormone/Drugs-by Product/Drug Candidate
Table 08: Pipeline Analysis-Recombinant Hormone/Drugs-by Product/Drug Candidate
Table 09: Pipeline Analysis-Recombinant Hormone/Drugs-by Product/Drug Candidate
Table 10: Pipeline Analysis-Recombinant Hormone/Drugs-by Product/Drug Candidate
Table 11: Orphan Drug Exclusivity-by Approval & Expiry
Table 12: Orphan Drug Exclusivity-by Approval & Expiry
Table 13: Orphan Drug Exclusivity-by Approval & Expiry
Table 14: Product Portfolio of Human C1-INH Plasma Protein-by Sponsor/Company
Table 15: Global Plasma Protease C1-Inhibitor Treatment Market Value (US$ Mn) Forecast, by Drug Class, 2015–2025
Table 16: Global Plasma Protease C1-Inhibitor Treatment Market Value (US$ Mn) Forecast, by Drug Class – C1-Inhibitor, 2015-2025
Table 17: Global Plasma Protease C1-inhibitor Treatment Market Value (US$ Mn) Forecast, by Dosage Type, 2015–2025
Table 18: Global Plasma Protease C1-inhibitor Treatment Market Value (US$ Mn) Forecast, by Distribution Channel, 2015–2025
Table 19: Global Plasma Protease C1-Inhibitor Treatment Market Value (US$ Mn) Forecast, by Region, 2015–2025
Table 20: North America Plasma Protease C1-Inhibitor Treatment Market Value (US$ Mn) Forecast, by Country, 2015-2025
Table 21: North America Plasma Protease C1-Inhibitor Treatment Market Value (US$ Mn) Forecast, by Drug Class, 2015–2025
Table 22: North America Plasma Protease C1-Inhibitor Treatment Market Value (US$ Mn) Forecast, by Drug Class – C1-Inhibitor, 2015–2025
Table 23: North America Plasma Protease C1-Inhibitor Treatment Market Value (US$ Mn) Forecast, by Dosage Type, 2015–2025
Table 24: North America Plasma Protease C1-Inhibitor Treatment Market Value (US$ Mn) Forecast, by Distribution Channel, 2015–2025
Table 25: Europe Plasma Protease C1-Inhibitor Treatment Market Value (US$ Mn) Forecast, by Country, 2015–2025
Table 26: Europe Plasma Protease C1-Inhibitor Treatment Market Value (US$ Mn) Forecast, by Drug Class, 2015–2025
Table 27: Europe Plasma Protease C1-Inhibitor Treatment Market Value (US$ Mn) Forecast, by Drug Class – C1-Inhibitor, 2015–2025
Table 28: Europe Plasma Protease C1-Inhibitor Treatment Market Value (US$ Mn) Forecast, by Dosage Type, 2015–2025
Table 29: Europe Plasma Protease C1-Inhibitor Treatment Market Value (US$ Mn) Forecast, by Distribution Channel, 2015–2025
Table 30: Latin America Plasma Protease C1-Inhibitor Treatment Market Value (US$ Mn) Forecast, by Country,
Table 31: Latin America Plasma Protease C1-Inhibitor Treatment Market Value (US$ Mn) Forecast, by Drug Class, 2015–2025
Table 32: Latin America Plasma Protease C1-Inhibitor Treatment Market Value (US$ Mn) Forecast, by Drug Class – C1-Inhibitor, 2015–2025
Table 33: Latin America Plasma Protease C1-Inhibitor Treatment Market Value (US$ Mn) Forecast, by Dosage Type, 2015–2025
Table 34: Latin America Plasma Protease C1-Inhibitor Treatment Market Value (US$ Mn) Forecast, by Distribution Channel, 2015–2025
Table 35: Rest of the World Plasma Protease C1-Inhibitor Treatment Market Value (US$ Mn) Forecast, by Country, 2015–2025
Table 36: Rest of the World Plasma Protease C1-Inhibitor Treatment Market Value (US$ Mn) Forecast, by Drug Class, 2015–2025
Table 37: Rest of the World Plasma Protease C1-Inhibitor Treatment Market Value (US$ Mn) Forecast, by Drug Class – C1-Inhibitor, 2015–2025
Table 38: Rest of the World Plasma Protease C1-Inhibitor Treatment Market Value (US$ Mn) Forecast, by Dosage Type, 2015–2025
Table 39: Rest of the World Plasma Protease C1-Inhibitor Treatment Market Value (US$ Mn) Forecast, by Distribution Channel, 2015–2025
List of Figures
FIG 01: Global Plasma Protease C1-Inhibitor Treatment Market Size (US$ Mn) Forecast, 2015–2025
FIG 02: Global Plasma Protease C1-Inhibitor Treatment Market Value Share, by Drug Class (2016)
FIG 03: Global Plasma Protease C1-Inhibitor Treatment Market Value Share, by Region (2016)
FIG 04: Global Plasma Protease C1-Inhibitor Treatment Market Value Share, by Distribution Channel (2016)
FIG 05: Global Plasma Protease C1-Inhibitor Treatment Market Value Share, by Dosage Type (2016)
FIG 06: Global Plasma Protease C1-Inhibitor Treatment Market Value Share, by Drug Class, 2017 and 2025
FIG 07: Global Plasma Protease C1-Inhibitor Treatment Market Revenue (US$ Mn) and Y-o-Y Growth (%) Forecast, by C1-Inhibitor, 2015–2025
FIG 08: Global Plasma Protease C1-Inhibitor Treatment Market Revenue (US$ Mn) and Y-o-Y Growth (%) Forecast, by Kallikrein Inhibitor, 2015-2017
FIG 09: Global Plasma Protease C1-Inhibitor Treatment Market Revenue (US$ Mn) and Y-o-Y Growth (%) Forecast, by Selective Bradykinin B2 Receptor Antagonist, 2015–2025
FIG 10: Global Plasma Protease C1-Inhibitor Treatment Market Attractiveness, by Drug Class, 2017–2025
FIG 11: Global Plasma Protease C1-inhibitor Treatment Market Value Share, by Dosage Type, 2017 and 2025
FIG 12: Global Plasma Protease C1-inhibitor Treatment Market Revenue (US$ Mn) and Y-o-Y Growth (%), by Lyophilized, 2015–2025
FIG 13: Global Plasma Protease C1-inhibitor Treatment Market Revenue (US$ Mn) and Y-o-Y Growth (%), by Liquid/Injectable, 2015–2025
FIG 14: Global Plasma Protease C1-inhibitor Treatment Market Attractiveness, by Dosage Type, 2017–2025
FIG 15: Global Plasma Protease C1-inhibitor Treatment Market Value Share, by Distribution Channel, 2017 and 2025
FIG 16: Global Plasma Protease C1-inhibitor Treatment Market Revenue (US$ Mn) and Y-o-Y Growth (%), by Hospital Pharmacies, 2015–2025
FIG 17: Global Plasma Protease C1-inhibitor Treatment Market Revenue (US$ Mn) and Y-o-Y Growth (%), by Independent Pharmacies & Outlets, 2015–2025
FIG 18: Global Plasma Protease C1-inhibitor Treatment Market Attractiveness, by Distribution Channel, 2017–2025
FIG 19: Global Plasma Protease C1-Inhibitor Treatment Market Value Share, by Region, 2017 and 2025
FIG 20: Global Plasma Protease C1-Inhibitor Treatment Market Attractiveness, by Region, 2017–2025
FIG 21: North America Plasma Protease C1-Inhibitor Treatment Market Value (US$ Mn) Forecast and Y-o-Y Growth Projection (%), 2015–2025
FIG 22: North America Plasma Protease C1-Inhibitor Treatment Market Value Share, by Country, 2017–2025
FIG 23: North America Plasma Protease C1-Inhibitor Treatment Market Attractiveness, by Country, 2017–2025
FIG 24: North America Plasma Protease C1-Inhibitor Treatment Market Value Share, by Drug Class, 2017 and 2025
FIG 25: North America Plasma Protease C1-Inhibitor Treatment Market Attractiveness, by Drug Class, 2017–2025
FIG 26: North America Plasma Protease C1-Inhibitor Treatment Market Value Share, by Dosage Type, 2017 and 2025
FIG 27: North America Plasma Protease C1-Inhibitor Treatment Market Attractiveness, by Dosage Type, 2017–2025
FIG 28: North America Plasma Protease C1-Inhibitor Treatment Market Value Share, by Distribution Channel, 2017 and 2025
FIG 29: North America Plasma Protease C1-Inhibitor Treatment Market Attractiveness, by Distribution Channel, 2017–2025
FIG 30: Europe Plasma Protease C1-Inhibitor Treatment Market Value (US$ Mn) Forecast and Y-o-Y Growth Projection (%), 2015–2025
FIG 31: Europe Plasma Protease C1-Inhibitor Treatment Market Value Share, by Country, 2017–2025
FIG 32: Europe Plasma Protease C1-Inhibitor Treatment Market Attractiveness, by Country, 2017–2025
FIG 33: Europe Plasma Protease C1-Inhibitor Treatment Market Value Share, by Drug Class, 2017 and 2025
FIG 34: Europe Plasma Protease C1-Inhibitor Treatment Market Attractiveness, by Drug Class, 2017–2025
FIG 35: Europe Plasma Protease C1-Inhibitor Treatment Market Value Share, by Dosage Type, 2017 and 2025
FIG 36: Europe Plasma Protease C1-Inhibitor Treatment Market Attractiveness, by Dosage Type, 2017–2025
FIG 37: Europe Plasma Protease C1-Inhibitor Treatment Market Value Share, by Distribution Channel, 2017 and 2025
FIG 38: Europe Plasma Protease C1-Inhibitor Treatment Market Attractiveness, by Distribution Channel, 2017–2025
FIG 39: Latin America Plasma Protease C1-Inhibitor Treatment Market Value (US$ Mn) Forecast and Y-o-Y Growth (%) Projection, 2015–2025
FIG 40: Latin America Plasma Protease C1-Inhibitor Treatment Market Value Share, by Country, 2017–2025
FIG 41: Latin America Plasma Protease C1-Inhibitor Treatment Market Attractiveness, by Country, 2017–2025
FIG 42: Latin America Plasma Protease C1-Inhibitor Treatment Market Value Share, by Drug Class, 2017 and 2025
FIG 43: Latin America Plasma Protease C1-Inhibitor Treatment Market Attractiveness, by Drug Class, 2017–2025
FIG 44: Latin America Plasma Protease C1-Inhibitor Treatment Market Value Share, by Dosage Type, 2017 and 2025
FIG 45: Latin America Plasma Protease C1-Inhibitor Treatment Market Attractiveness, by Dosage Type, 2017–2025
FIG 46: Latin America Plasma Protease C1-Inhibitor Treatment Market Value Share, by Distribution Channel, 2017 and 2025
FIG 47: Latin America Plasma Protease C1-Inhibitor Treatment Market Attractiveness, by Distribution Channel, 2017–2025
FIG 48: Rest of the World Plasma Protease C1-Inhibitor Treatment Market Value (US$ Mn) Forecast and Y-o-Y Growth Projection (%), 2015–2025
FIG 49: Rest of the World Plasma Protease C1-Inhibitor Treatment Market Value Share, by Country, 2017–2025
FIG 50: Rest of the World Plasma Protease C1-Inhibitor Treatment Market Attractiveness, by Country, 2017–2025
FIG 51: Rest of the World Plasma Protease C1-Inhibitor Treatment Market Value Share, by Drug Class, 2017 and 2025
FIG 52: Rest of the World Plasma Protease C1-Inhibitor Treatment Market Attractiveness, by Drug Class, 2017–2025
FIG 53: Rest of the World Plasma Protease C1-Inhibitor Treatment Market Value Share, by Dosage Type, 2017 and 2025
FIG 54: Rest of the World Plasma Protease C1-Inhibitor Treatment Market Attractiveness, by Dosage Type, 2017–2025
FIG 55: Rest of the World Plasma Protease C1-Inhibitor Treatment Market Value Share, by Distribution Channel, 2017 and 2025
FIG 56: Rest of the World Plasma Protease C1-Inhibitor Treatment Market Attractiveness, by Distribution Channel, 2017–2025
FIG 57: Global Plasma Protease C1-Inhibitor Treatment Market Share, by Company, 2016
FIG 58: Breakdown of Net Sales (%), by Therapeutic Area, 2016
FIG 59: Product Revenue (US$ Mn) & Y-o-Y Growth (%), 2013–2016
FIG 60: Breakdown of Net Sales (%), by Major Products, 2016
FIG 61: Sales Revenue (US$ Mn) & Y-o-Y Growth (%), 2013–2016
FIG 62: Breakdown of Net Sales (%), by Therapeutic Area, 2016
FIG 63: Product Revenue (US$ Mn) & Y-o-Y Growth (%), 2013–2016
FIG 64: Breakdown of Net Sales (%), by Europe Region, 2016
FIG 65: Plasma Product Revenue (US$ Mn) & Y-o-Y Growth (%), 2013–2016
FIG 66: Product Revenue (US$ Mn) & Y-o-Y Growth (%), 2013–2016
Copyright © Transparency Market Research, Inc. All Rights reserved
Trust Online

Plasma Protease C1-inhibitor Treatment Market