
Reports
Reports
The coronavirus pandemic has affected almost all end markets, whilst not sparing the performance minerals additives market. Performance minerals additives are virtually found in all applications of construction, packaging, and automotive industries. However, the growth of these industries is affecting the performance minerals additives market. In order to stay afloat during the COVID-19 outbreak, manufacturers are focusing on essential industries such as food & beverages (F&B), pharmaceutical, and home care to capitalize on revenue opportunities.
Manufacturers are adopting the plug-and-play mode of production and other business activities due to the volatile demand & supply of products. They are ensuring business continuity for mission critical projects in the packaging, agriculture, and energy industries.
The recycled plastic has become the need of the hour in every end-use industry. However, recycling plastic in order to make it as useful as virgin plastic can be potentially challenging. Imerys - a France-based multinational company is taking the lead to acquire in-depth knowledge of the effects of minerals in polymers. Startups and established companies are realizing the importance of R&D investment in order to gain a competitive edge over other players in the performance minerals additives market.
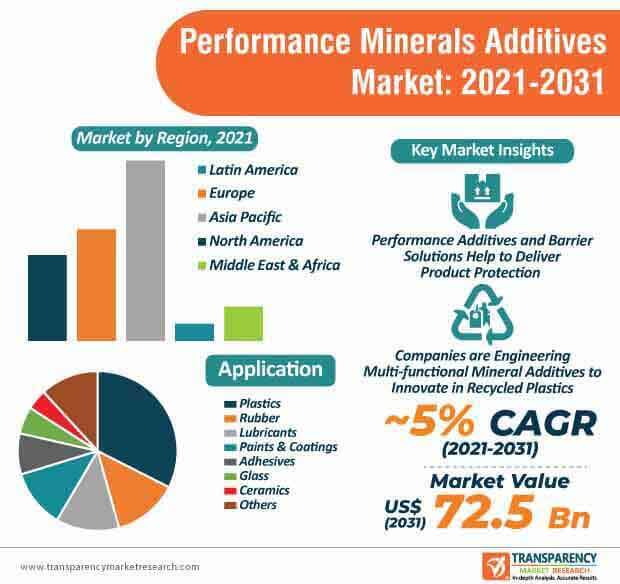
Stakeholders are increasing the availability of recycled plastic made from the groundbreaking polyolefin compatibilization technology. Companies are engineering multi-functional mineral additives to innovate in recycled plastics. These efforts are being made to match recycled plastic properties with virgin polymers to enable their use in high-value applications.
The performance minerals additives market is predicted to reach the valuation of US$ 72.5 Bn by the end of 2031. Manufacturers are bolstering their production capabilities in high performance concrete additives, which are useful in the construction industry. These additives are used for the mixture of water cement and aggregate in small quantities in order to increase the durability of concrete to fix concrete behavior and control setting or hardening. The liquid and powdered form additives are becoming known in concrete mixes.
Companies in the performance minerals additives market are increasing the availability of ready-to-use liquid form additives that can be added to the concrete at the plant or jobsite. The successful use of additives depends on the use of appropriate methods of batching and concreting.
The ever-increasing packaging industry is creating stable income streams for manufacturers in the performance minerals additives market, as packaging plays a pivotal role in engaging consumers with a given brand. Avient Corporation - a global provider of specialized polymer materials and services, has a comprehensive portfolio in performance minerals additives meant for the packaging industry, which help to improve the shelf life of food contained in packaging materials.
Barrier solutions and performance additives help to deliver product protection and extend the shelf life of products to increase the availability of high-quality products to consumers.
The light-duty vehicle performance additives are contributing to the recognition of Afton Chemical Corporation - a developer of petroleum & additives in order to improve fuel economy, power, acceleration, and reduce emissions. Companies in the performance minerals additives market are increasing their output capacities in performance fuel additives that help light duty vehicles to maintain design performance by cleaning vital components in the fuel system and protect them from harm.
An increasing number of passenger vehicles and motorbikes is being built keeping in mind vehicle performance additives. This is evident since additive manufacturers are gaining awareness about newly introduced emission regulations across nations, fuel specifications, alternate fuels, and the new engine technology that are influencing customer experience. Companies are collaborating with OEMs in North America, Asia, and Europe to gain valuable feedback in the vehicles sector.
Analysts’ Viewpoint
Since single use materials have gained popularity amid the ongoing coronavirus crisis, companies in the performance minerals additives market are mapping future growth opportunities in the packaging industry.
The performance minerals additives market is expected to progress at a modest CAGR of 5.3% during the forecast period. This is evident since it is challenging to incorporate the properties of virgin plastics in recycled plastic. Hence, companies in the performance minerals additives market should increase their R&D in the robust polyolefin compatibilization technology to develop additives that help recycled plastics to mimic the properties of virgin plastics. Shelf appeal and consumer engagement of quality products are being achieved with high-quality packaging materials.
Performance Minerals Additives Market: Overview
Growing Packaging, Automotive, and Construction Industries: Key Driver of Performance Minerals Additives Market
Calcium Carbonate Dominates Performance Minerals Additives Market
Rise in Application of Performance Minerals Additives in Plastics
Performance Minerals Additives Market: Competition Landscape
Performance Minerals Additives Market: Key Players
Performance Minerals Additives Market is expected to reach US$ 72.5 Bn By 2031
Performance Minerals Additives Market is estimated to rise at a CAGR of 5.3% during forecast period
Performance minerals additives market is primarily driven by industrialization and expansion of the construction industry
Asia Pacific is more attractive for vendors in the Performance Minerals Additives Market
Key players of Performance Minerals Additives Market are Minerals Technologies Inc., LKAB Minerals, GLC Minerals, LLC, Dicalite Management Group, Inc., EP Minerals, Imerys, ORGANIC INDUSTRIES PVT LTD., Kutch Minerals, Bharat Mines and Minerals, and Upreti Talc Pvt. Ltd
1. Executive Summary
1.1. Performance Minerals Additives Market Snapshot
1.2. Current Market and Future Potential
2. Market Overview
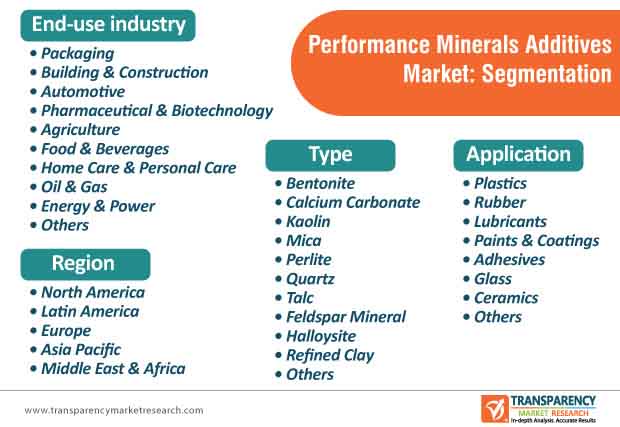
2.1. Market Segmentation
2.2. Market Trends
2.3. Market Dynamics
2.3.1. Drivers
2.3.2. Restraints
2.3.3. Opportunities
2.4. Porter’s Five Forces Analysis
2.5. Regulatory Analysis
2.6. Value Chain Analysis
2.6.1. List of Potential Customers
2.6.2. List of Suppliers/Manufacturers
3. COVID-19 Impact Analysis
4. Global Performance Minerals Additives Market Analysis and Forecast, by Type, 2021–2031
4.1. Introduction and Definitions
4.2. Global Performance Minerals Additives Market Volume (Kilo Tons) and Value (US$ Bn) Forecast, by Type, 2021–2031
4.2.1. Bentonite
4.2.2. Calcium Carbonate
4.2.3. Kaolin
4.2.4. Mica
4.2.5. Perlite
4.2.6. Quartz
4.2.7. Talc
4.2.8. Feldspar Mineral
4.2.9. Halloysite
4.2.10. Refined Clay
4.2.11. Others
4.3. Global Performance Minerals Additives Market Attractiveness, by Type
5. Global Performance Minerals Additives Market Analysis and Forecast, by Application, 2021–2031
5.1. Introduction and Definitions
5.2. Global Performance Minerals Additives Market Volume (Kilo Tons) and Value (US$ Bn) Forecast, by Application, 2021–2031
5.2.1. Plastics
5.2.2. Rubber
5.2.3. Lubricants
5.2.4. Paints & Coatings
5.2.5. Adhesives
5.2.6. Glass
5.2.7. Ceramics
5.2.8. Others
5.3. Global Performance Minerals Additives Market Attractiveness, by Application
6. Global Performance Minerals Additives Market Analysis and Forecast, by End-use Industry, 2021–2031
6.1. Introduction and Definitions
6.2. Global Performance Minerals Additives Market Volume (Kilo Tons) and Value (US$ Bn) Forecast, by End-use Industry, 2021–2031
6.2.1. Packaging
6.2.2. Building & Construction
6.2.3. Automotive
6.2.4. Pharmaceutical & Biotechnology
6.2.5. Agriculture
6.2.6. Food & Beverages
6.2.7. Home Care & Personal Care
6.2.8. Oil & Gas
6.2.9. Energy & Power
6.2.10. Others
6.3. Global Performance Minerals Additives Market Attractiveness, by End-use Industry
7. Global Performance Minerals Additives Market Analysis and Forecast, by Region, 2021–2031
7.1. Key Findings
7.2. Global Performance Minerals Additives Market Volume (Kilo Tons) and Value (US$ Bn) Forecast, by Region, 2021–2031
7.2.1. North America
7.2.2. Europe
7.2.3. Asia Pacific
7.2.4. Latin America
7.2.5. Middle East & Africa
7.3. Global Performance Minerals Additives Market Attractiveness, by Region
8. North America Performance Minerals Additives Market Analysis and Forecast, 2021–2031
8.1. Key Findings
8.2. North America Performance Minerals Additives Market Volume (Kilo Tons) and Value (US$ Bn) Forecast, by Type, 2021–2031
8.3. North America Performance Minerals Additives Market Volume (Kilo Tons) and Value (US$ Bn) Forecast, by Application, 2021–2031
8.4. North America Performance Minerals Additives Market Volume (Kilo Tons) and Value (US$ Bn) Forecast, by End-use Industry, 2021–2031
8.5. North America Performance Minerals Additives Market Volume (Kilo Tons) and Value (US$ Bn) Forecast, by Country, 2021–2031
8.5.1. U.S. Performance Minerals Additives Market Volume (Kilo Tons) and Value (US$ Bn) Forecast, by Type, 2021–2031
8.5.2. U.S. Performance Minerals Additives Market Volume (Kilo Tons) and Value (US$ Bn) Forecast, by Application, 2021–2031
8.5.3. U.S. Performance Minerals Additives Market Volume (Kilo Tons) and Value (US$ Bn) Forecast, by End-use Industry, 2021–2031
8.5.4. Canada Performance Minerals Additives Market Volume (Kilo Tons) and Value (US$ Bn) Forecast, by Type, 2021–2031
8.5.5. Canada Performance Minerals Additives Market Volume (Kilo Tons) and Value (US$ Bn) Forecast, by Application, 2021–2031
8.5.6. Canada Performance Minerals Additives Market Volume (Kilo Tons) and Value (US$ Bn) Forecast, by End-use Industry, 2021–2031
8.6. North America Performance Minerals Additives Market Attractiveness Analysis
9. Europe Performance Minerals Additives Market Analysis and Forecast, 2021–2031
9.1. Key Findings
9.2. Europe Performance Minerals Additives Market Volume (Kilo Tons) and Value (US$ Bn) Forecast, by Type, 2021–2031
9.3. Europe Performance Minerals Additives Market Volume (Kilo Tons) and Value (US$ Bn) Forecast, by Application, 2021–2031
9.4. Europe Performance Minerals Additives Market Volume (Kilo Tons) and Value (US$ Bn) Forecast, by End-use Industry, 2021–2031
9.5. Europe Performance Minerals Additives Market Volume (Kilo Tons) and Value (US$ Bn) Forecast, by Country and Sub-region, 2019-2031
9.5.1. Germany Performance Minerals Additives Market Volume (Kilo Tons) and Value (US$ Bn) Forecast, by Type, 2021–2031
9.5.2. Germany Performance Minerals Additives Market Volume (Kilo Tons) and Value (US$ Bn) Forecast, by Application, 2021–2031
9.5.3. Germany Performance Minerals Additives Market Volume (Kilo Tons) and Value (US$ Bn) Forecast, by End-use Industry, 2021–2031
9.5.4. France Performance Minerals Additives Market Volume (Kilo Tons) and Value (US$ Bn) Forecast, by Type, 2021–2031
9.5.5. France Performance Minerals Additives Market Volume (Kilo Tons) and Value (US$ Bn) Forecast, by Application, 2021–2031
9.5.6. France Performance Minerals Additives Market Volume (Kilo Tons) and Value (US$ Bn) Forecast, by End-use Industry, 2021–2031
9.5.7. U.K. Performance Minerals Additives Market Volume (Kilo Tons) and Value (US$ Bn) Forecast, by Type, 2021–2031
9.5.8. U.K. Performance Minerals Additives Market Volume (Kilo Tons) and Value (US$ Bn) Forecast, by Application, 2021–2031
9.5.9. U.K. Performance Minerals Additives Market Volume (Kilo Tons) and Value (US$ Bn) Forecast, by End-use Industry, 2021–2031
9.5.10. Italy Performance Minerals Additives Market Volume (Kilo Tons) and Value (US$ Bn) Forecast, by Type, 2021–2031
9.5.11. Italy Performance Minerals Additives Market Volume (Kilo Tons) and Value (US$ Bn) Forecast, by Application, 2021–2031
9.5.12. Italy Performance Minerals Additives Market Volume (Kilo Tons) and Value (US$ Bn) Forecast, by End-use Industry, 2021–2031
9.5.13. Russia & CIS Performance Minerals Additives Market Volume (Kilo Tons) and Value (US$ Bn) Forecast, by Type, 2021–2031
9.5.14. Russia & CIS Performance Minerals Additives Market Volume (Kilo Tons) and Value (US$ Bn) Forecast, by Application, 2021–2031
9.5.15. Russia & CIS Performance Minerals Additives Market Volume (Kilo Tons) and Value (US$ Bn) Forecast, by End-use Industry, 2021–2031
9.5.16. Spain Performance Minerals Additives Market Volume (Kilo Tons) and Value (US$ Bn) Forecast, by Type, 2021–2031
9.5.17. Spain Performance Minerals Additives Market Volume (Kilo Tons) and Value (US$ Bn) Forecast, by Application, 2021–2031
9.5.18. Spain Performance Minerals Additives Market Volume (Kilo Tons) and Value (US$ Bn) Forecast, by End-use Industry, 2021–2031
9.5.19. Rest of Europe Performance Minerals Additives Market Volume (Kilo Tons) and Value (US$ Bn) Forecast, by Type, 2021–2031
9.5.20. Rest of Europe Performance Minerals Additives Market Volume (Kilo Tons) and Value (US$ Bn) Forecast, by Application, 2021–2031
9.5.21. Rest of Europe Performance Minerals Additives Market Volume (Kilo Tons) and Value (US$ Bn) Forecast, by End-use Industry, 2021–2031
9.6. Europe Performance Minerals Additives Market Attractiveness Analysis
10. Asia Pacific Performance Minerals Additives Market Analysis and Forecast, 2021–2031
10.1. Key Findings
10.2. Asia Pacific Performance Minerals Additives Market Volume (Kilo Tons) and Value (US$ Bn) Forecast, by Type, 2021–2031
10.3. Asia Pacific Performance Minerals Additives Market Volume (Kilo Tons) and Value (US$ Bn) Forecast, by Application, 2021–2031
10.4. Asia Pacific Performance Minerals Additives Market Volume (Kilo Tons) and Value (US$ Bn) Forecast, by End-use Industry, 2021–2031
10.5. Asia Pacific Performance Minerals Additives Market Volume (Kilo Tons) and Value (US$ Bn) Forecast, by Country and Sub-region, 2019-2031
10.5.1. China Performance Minerals Additives Market Volume (Kilo Tons) and Value (US$ Bn) Forecast, by Type, 2021–2031
10.5.2. China Performance Minerals Additives Market Volume (Kilo Tons) and Value (US$ Bn) Forecast, by Application, 2021–2031
10.5.3. China Performance Minerals Additives Market Volume (Kilo Tons) and Value (US$ Bn) Forecast, by End-use Industry, 2021–2031
10.5.4. Japan Performance Minerals Additives Market Volume (Kilo Tons) and Value (US$ Bn) Forecast, by Type, 2021–2031
10.5.5. Japan Performance Minerals Additives Market Volume (Kilo Tons) and Value (US$ Bn) Forecast, by Application, 2021–2031
10.5.6. Japan Performance Minerals Additives Market Volume (Kilo Tons) and Value (US$ Bn) Forecast, by End-use Industry, 2021–2031
10.5.7. India Performance Minerals Additives Market Volume (Kilo Tons) and Value (US$ Bn) Forecast, by Type, 2021–2031
10.5.8. India Performance Minerals Additives Market Volume (Kilo Tons) and Value (US$ Bn) Forecast, by Application, 2021–2031
10.5.9. India Performance Minerals Additives Market Volume (Kilo Tons) and Value (US$ Bn) Forecast, by End-use Industry, 2021–2031
10.5.10. ASEAN Performance Minerals Additives Market Volume (Kilo Tons) and Value (US$ Bn) Forecast, by Type, 2021–2031
10.5.11. ASEAN Performance Minerals Additives Market Volume (Kilo Tons) and Value (US$ Bn) Forecast, by Application, 2021–2031
10.5.12. ASEAN Performance Minerals Additives Market Volume (Kilo Tons) and Value (US$ Bn) Forecast, by End-use Industry, 2021–2031
10.5.13. Rest of Asia Pacific Performance Minerals Additives Market Volume (Kilo Tons) and Value (US$ Bn) Forecast, by Type, 2021–2031
10.5.14. Rest of Asia Pacific Performance Minerals Additives Market Volume (Kilo Tons) and Value (US$ Bn) Forecast, by Application, 2021–2031
10.6. Asia Pacific Performance Minerals Additives Market Attractiveness Analysis
11. Latin America Performance Minerals Additives Market Analysis and Forecast, 2021–2031
11.1. Key Findings
11.2. Latin America Performance Minerals Additives Market Volume (Kilo Tons) and Value (US$ Bn) Forecast, by Type, 2021–2031
11.3. Latin America Performance Minerals Additives Market Volume (Kilo Tons) and Value (US$ Bn) Forecast, by Application, 2021–2031
11.4. Latin America Performance Minerals Additives Market Volume (Kilo Tons) and Value (US$ Bn) Forecast, by End-use Industry, 2021–2031
11.5. Latin America Performance Minerals Additives Market Volume (Kilo Tons) and Value (US$ Bn) Forecast, by Country and Sub-region, 2019-2031
11.5.1. Brazil Performance Minerals Additives Market Volume (Kilo Tons) and Value (US$ Bn) Forecast, by Type, 2021–2031
11.5.2. Brazil Performance Minerals Additives Market Volume (Kilo Tons) and Value (US$ Bn) Forecast, by Application, 2021–2031
11.5.3. Brazil Performance Minerals Additives Market Volume (Kilo Tons) and Value (US$ Bn) Forecast, by End-use Industry, 2021–2031
11.5.4. Mexico Performance Minerals Additives Market Volume (Kilo Tons) and Value (US$ Bn) Forecast, by Type, 2021–2031
11.5.5. Mexico Performance Minerals Additives Market Volume (Kilo Tons) and Value (US$ Bn) Forecast, by Application, 2021–2031
11.5.6. Mexico Performance Minerals Additives Market Volume (Kilo Tons) and Value (US$ Bn) Forecast, by End-use Industry, 2021–2031
11.5.7. Rest of Latin America Performance Minerals Additives Market Volume (Kilo Tons) and Value (US$ Bn) Forecast, by Type, 2021–2031
11.5.8. Rest of Latin America Performance Minerals Additives Market Volume (Kilo Tons) and Value (US$ Bn) Forecast, by Application, 2021–2031
11.6. Latin America Performance Minerals Additives Market Attractiveness Analysis
12. Middle East & Africa Performance Minerals Additives Market Analysis and Forecast, 2021–2031
12.1. Key Findings
12.2. Middle East & Africa Performance Minerals Additives Market Volume (Kilo Tons) and Value (US$ Bn) Forecast, by Type, 2021–2031
12.3. Middle East & Africa Performance Minerals Additives Market Volume (Kilo Tons) and Value (US$ Bn) Forecast, by Application, 2021–2031
12.4. Middle East & Africa Performance Minerals Additives Market Volume (Kilo Tons) and Value (US$ Bn) Forecast, by Country and Sub-region, 2019-2031
12.4.1. GCC Performance Minerals Additives Market Volume (Kilo Tons) and Value (US$ Bn) Forecast, by Type, 2021–2031
12.4.2. GCC Performance Minerals Additives Market Volume (Kilo Tons) and Value (US$ Bn) Forecast, by Application, 2021–2031
12.4.3. GCC Performance Minerals Additives Market Volume (Kilo Tons) and Value (US$ Bn) Forecast, by End-use Industry, 2021–2031
12.4.4. South Africa Performance Minerals Additives Market Volume (Kilo Tons) and Value (US$ Bn) Forecast, by Type, 2021–2031
12.4.5. South Africa Performance Minerals Additives Market Volume (Kilo Tons) and Value (US$ Bn) Forecast, by Application, 2021–2031
12.4.6. South Africa Performance Minerals Additives Market Volume (Kilo Tons) and Value (US$ Bn) Forecast, by End-use Industry, 2021–2031
12.4.7. Turkey Performance Minerals Additives Market Volume (Kilo Tons) and Value (US$ Bn) Forecast, by Type, 2021–2031
12.4.8. Turkey Performance Minerals Additives Market Volume (Kilo Tons) and Value (US$ Bn) Forecast, by Application, 2021–2031
12.4.9. Turkey Performance Minerals Additives Market Volume (Kilo Tons) and Value (US$ Bn) Forecast, by End-use Industry, 2021–2031
12.4.10. Rest of Middle East & Africa Performance Minerals Additives Market Volume (Kilo Tons) and Value (US$ Bn) Forecast, by Type, 2021–2031
12.4.11. Rest of Middle East & Africa Performance Minerals Additives Market Volume (Kilo Tons) and Value (US$ Bn) Forecast, by Application, 2021–2031
12.4.12. Rest of Middle East & Africa Performance Minerals Additives Market Volume (Kilo Tons) and Value (US$ Bn) Forecast, by End-use Industry, 2021–2031
12.5. Middle East & Africa Performance Minerals Additives Market Attractiveness Analysis
13. Competition Landscape
13.1. Global Performance Minerals Additives Company Market Share Analysis, 2020
13.2. Company Profiles (Details – Overview, Financials, Recent Developments, and Strategy)
13.2.1. Imerys.
13.2.1.1. Company Description
13.2.1.2. Business Overview
13.2.1.3. Financial Overview
13.2.1.4. Strategic Overview
13.2.2. Minerals Technology Inc.
13.2.2.1. Company Description
13.2.2.2. Business Overview
13.2.2.3. Financial Overview
13.2.2.4. Strategic Overview
13.2.3. LKAB Minerals.
13.2.3.1. Company Description
13.2.3.2. Business Overview
13.2.3.3. Financial Overview
13.2.3.4. Strategic Overview
13.2.4. GLC Minerals, LLC.
13.2.4.1. Company Description
13.2.4.2. Business Overview
13.2.4.3. Financial Overview
13.2.4.4. Strategic Overview
13.2.5. EP Minerals.
13.2.5.1. Company Description
13.2.5.2. Business Overview
13.2.5.3. Financial Overview
13.2.5.4. Strategic Overview
13.2.6. Dicalite Management Group, Inc.
13.2.6.1. Company Description
13.2.6.2. Business Overview
13.2.6.3. Strategic Overview
13.2.7. ORGANIC INDUSTRIES PVT LTD.
13.2.7.1. Company Description
13.2.7.2. Business Overview
13.2.7.3. Strategic Overview
13.2.8. Kutch Minerals
13.2.8.1. Company Description
13.2.8.2. Business Overview
13.2.8.3. Strategic Overview
13.2.9. Bharat Mines and Minerals
13.2.9.1. Company Description
13.2.9.2. Business Overview
13.2.9.3. Strategic Overview
13.2.10. Upreti Talc Pvt. Ltd
13.2.10.1. Company Description
13.2.10.2. Business Overview
13.2.10.3. Financial Overview
13.2.10.4. Strategic Overview
14. Primary Research: Key Insights
15. Appendix
List of Tables
Table 1: Global Performance Minerals Additives Market Volume (Kilo Tons) Forecast, by Form, 2020–2031
Table 2: Global Performance Minerals Additives Market Value (US$ Bn) Forecast, by Form, 2020–2031
Table 3: Global Performance Minerals Additives Market Volume (Kilo Tons) Forecast, by Application, 2020–2031
Table 4: Global Performance Minerals Additives Market Value (US$ Bn) Forecast, by Application, 2020–2031
Table 5: Global Performance Minerals Additives Market Volume (Kilo Tons) Forecast, by End-use Industry 2020–2031
Table 6: Global Performance Minerals Additives Market Value (US$ Bn) Forecast, by End-use Industry 2020–2031
Table 7: Global Performance Minerals Additives Market Volume (Kilo Tons) Forecast, by Region, 2020–2031
Table 8: Global Performance Minerals Additives Market Value (US$ Bn) Forecast, by Region, 2020–2031
Table 9: North America Performance Minerals Additives Market Volume (Kilo Tons) Forecast, by Form, 2020–2031
Table 10: North America Performance Minerals Additives Market Value (US$ Bn) Forecast, by Form, 2020–2031
Table 11: North America Performance Minerals Additives Market Volume (Kilo Tons) Forecast, by Application, 2020–2031
Table 12: North America Performance Minerals Additives Market Value (US$ Bn) Forecast, by Application, 2020–2031
Table 13: North America Performance Minerals Additives Market Volume (Kilo Tons) Forecast, by End-use Industry 2020–2031
Table 14: North America Performance Minerals Additives Market Value (US$ Bn) Forecast, by End-use Industry 2020–2031
Table 15: North America Performance Minerals Additives Market Volume (Kilo Tons) Forecast, by Country 2020–2031
Table 16: North America Performance Minerals Additives Market Value (US$ Bn) Forecast, by Country 2020–2031
Table 17: U.S. Performance Minerals Additives Market Volume (Kilo Tons) Forecast, by Form, 2020–2031
Table 18: U.S. Performance Minerals Additives Market Value (US$ Bn) Forecast, by Form, 2020–2031
Table 19: U.S. Performance Minerals Additives Market Volume (Kilo Tons) Forecast, by Application, 2020–2031
Table 20: U.S. Performance Minerals Additives Market Value (US$ Bn) Forecast, by Application, 2020–2031
Table 21: U.S. Performance Minerals Additives Market Volume (Kilo Tons) Forecast, by End-use Industry 2020–2031
Table 22: U.S. Performance Minerals Additives Market Value (US$ Bn) Forecast, by End-use Industry 2020–2031
Table 23: Canada Performance Minerals Additives Market Volume (Kilo Tons) Forecast, by Form, 2020–2031
Table 24: Canada Performance Minerals Additives Market Value (US$ Bn) Forecast, by Form, 2020–2031
Table 25: Canada Performance Minerals Additives Market Volume (Kilo Tons) Forecast, by Application, 2020–2031
Table 26: Canada Performance Minerals Additives Market Value (US$ Bn) Forecast, by Application, 2020–2031
Table 27: Canada Performance Minerals Additives Market Volume (Kilo Tons) Forecast, by End-use Industry 2020–2031
Table 28: Canada Performance Minerals Additives Market Value (US$ Bn) Forecast, by End-use Industry 2020–2031
Table 29: Europe Performance Minerals Additives Market Volume (Kilo Tons) Forecast, by Form, 2020–2031
Table 30: Europe Performance Minerals Additives Market Value (US$ Bn) Forecast, by Form, 2020–2031
Table 31: Europe Performance Minerals Additives Market Volume (Kilo Tons) Forecast, by Application, 2020–2031
Table 32: Europe Performance Minerals Additives Market Value (US$ Bn) Forecast, by Application, 2020–2031
Table 33: Europe Performance Minerals Additives Market Volume (Kilo Tons) Forecast, by End-use Industry 2020–2031
Table 34: Europe Performance Minerals Additives Market Value (US$ Bn) Forecast, by End-use Industry 2020–2031
Table 35: Europe Performance Minerals Additives Market Volume (Kilo Tons) Forecast, by Country and Sub-Region 2020–2031
Table 36: Europe Performance Minerals Additives Market Value (US$ Bn) Forecast, by Country and Sub-Region 2020–2031
Table 37: Germany Performance Minerals Additives Market Volume (Kilo Tons) Forecast, by Form, 2020–2031
Table 38: Germany Performance Minerals Additives Market Value (US$ Bn) Forecast, by Form, 2020–2031
Table 39: Germany Performance Minerals Additives Market Volume (Kilo Tons) Forecast, by Application, 2020–2031
Table 40: Germany Performance Minerals Additives Market Value (US$ Bn) Forecast, by Application, 2020–2031
Table 41: Germany Performance Minerals Additives Market Volume (Kilo Tons) Forecast, by End-use Industry 2020–2031
Table 42: Germany Performance Minerals Additives Market Value (US$ Bn) Forecast, by End-use Industry 2020–2031
Table 43: France Performance Minerals Additives Market Volume (Kilo Tons) Forecast, by Form, 2020–2031
Table 44: France Performance Minerals Additives Market Value (US$ Bn) Forecast, by Form, 2020–2031
Table 45: France Performance Minerals Additives Market Volume (Kilo Tons) Forecast, by Application, 2020–2031
Table 46: France Performance Minerals Additives Market Value (US$ Bn) Forecast, by Application, 2020–2031
Table 47: France Performance Minerals Additives Market Volume (Kilo Tons) Forecast, by End-use Industry 2020–2031
Table 48: France Performance Minerals Additives Market Value (US$ Bn) Forecast, by End-use Industry 2020–2031
Table 49: U.K. Performance Minerals Additives Market Volume (Kilo Tons) Forecast, by Form, 2020–2031
Table 50: U.K. Performance Minerals Additives Market Value (US$ Bn) Forecast, by Form, 2020–2031
Table 51: U.K. Performance Minerals Additives Market Volume (Kilo Tons) Forecast, by Application, 2020–2031
Table 52: U.K. Performance Minerals Additives Market Value (US$ Bn) Forecast, by Application, 2020–2031
Table 53: U.K. Performance Minerals Additives Market Volume (Kilo Tons) Forecast, by End-use Industry 2020–2031
Table 54: U.K. Performance Minerals Additives Market Value (US$ Bn) Forecast, by End-use Industry 2020–2031
Table 55: Italy Performance Minerals Additives Market Volume (Kilo Tons) Forecast, by Form, 2020–2031
Table 56: Italy Performance Minerals Additives Market Value (US$ Bn) Forecast, by Form, 2020–2031
Table 57: Italy Performance Minerals Additives Market Volume (Kilo Tons) Forecast, by Application, 2020–2031
Table 58: Italy Performance Minerals Additives Market Value (US$ Bn) Forecast, by Application, 2020–2031
Table 59: Italy Performance Minerals Additives Market Volume (Kilo Tons) Forecast, by End-use Industry 2020–2031
Table 60: Italy Performance Minerals Additives Market Value (US$ Bn) Forecast, by End-use Industry 2020–2031
Table 61: Russia & CIS Performance Minerals Additives Market Volume (Kilo Tons) Forecast, by Form, 2020–2031
Table 62: Russia & CIS Performance Minerals Additives Market Value (US$ Bn) Forecast, by Form, 2020–2031
Table 63: Russia & CIS Performance Minerals Additives Market Volume (Kilo Tons) Forecast, by Application, 2020–2031
Table 64: Russia & CIS Performance Minerals Additives Market Value (US$ Bn) Forecast, by Application, 2020–2031
Table 65: Russia & CIS Performance Minerals Additives Market Volume (Kilo Tons) Forecast, by End-use Industry 2020–2031
Table 66: Russia & CIS Performance Minerals Additives Market Value (US$ Bn) Forecast, by End-use Industry 2020–2031
Table 67: Spain Performance Minerals Additives Market Volume (Kilo Tons) Forecast, by Form, 2020–2031
Table 68: Spain Performance Minerals Additives Market Value (US$ Bn) Forecast, by Form, 2020–2031
Table 69: Spain Performance Minerals Additives Market Volume (Kilo Tons) Forecast, by Application, 2020–2031
Table 70: Spain Performance Minerals Additives Market Value (US$ Bn) Forecast, by Application, 2020–2031
Table 71: Spain Performance Minerals Additives Market Volume (Kilo Tons) Forecast, by End-use Industry 2020–2031
Table 72: Spain Performance Minerals Additives Market Value (US$ Bn) Forecast, by End-use Industry 2020–2031
Table 73: Rest of Europe Performance Minerals Additives Market Volume (Kilo Tons) Forecast, by Form, 2020–2031
Table 74: Rest of Europe Performance Minerals Additives Market Value (US$ Bn) Forecast, by Form, 2020–2031
Table 75: Rest of Europe Performance Minerals Additives Market Volume (Kilo Tons) Forecast, by Application, 2020–2031
Table 76: Rest of Europe Performance Minerals Additives Market Value (US$ Bn) Forecast, by Application, 2020–2031
Table 77: Rest of Europe Performance Minerals Additives Market Volume (Kilo Tons) Forecast, by End-use Industry 2020–2031
Table 78: Rest of Europe Performance Minerals Additives Market Value (US$ Bn) Forecast, by End-use Industry 2020–2031
Table 79: Asia Pacific Performance Minerals Additives Market Volume (Kilo Tons) Forecast, by Form, 2020–2031
Table 80: Asia Pacific Performance Minerals Additives Market Value (US$ Bn) Forecast, by Form, 2020–2031
Table 81: Asia Pacific Performance Minerals Additives Market Volume (Kilo Tons) Forecast, by Application, 2020–2031
Table 82: Asia Pacific Performance Minerals Additives Market Value (US$ Bn) Forecast, by Application, 2020–2031
Table 83: Asia Pacific Performance Minerals Additives Market Volume (Kilo Tons) Forecast, by End-use Industry 2020–2031
Table 84: Asia Pacific Performance Minerals Additives Market Value (US$ Bn) Forecast, by End-use Industry 2020–2031
Table 85: Asia Pacific Performance Minerals Additives Market Volume (Kilo Tons) Forecast, by Country and Sub-Region 2020–2031
Table 86: Asia Pacific Performance Minerals Additives Market Value (US$ Bn) Forecast, by Country and Sub-Region 2020–2031
Table 87: China Performance Minerals Additives Market Volume (Kilo Tons) Forecast, by Form, 2020–2031
Table 88: China Performance Minerals Additives Market Value (US$ Bn) Forecast, by Form, 2020–2031
Table 89: China Performance Minerals Additives Market Volume (Kilo Tons) Forecast, by Application, 2020–2031
Table 90: China Performance Minerals Additives Market Value (US$ Bn) Forecast, by Application, 2020–2031
Table 91: China Performance Minerals Additives Market Volume (Kilo Tons) Forecast, by End-use Industry 2020–2031
Table 92: China Performance Minerals Additives Market Value (US$ Bn) Forecast, by End-use Industry 2020–2031
Table 93: Japan Performance Minerals Additives Market Volume (Kilo Tons) Forecast, by Form, 2020–2031
Table 94: Japan Performance Minerals Additives Market Value (US$ Bn) Forecast, by Form, 2020–2031
Table 95: Japan Performance Minerals Additives Market Volume (Kilo Tons) Forecast, by Application, 2020–2031
Table 96: Japan Performance Minerals Additives Market Value (US$ Bn) Forecast, by Application, 2020–2031
Table 97: Japan Performance Minerals Additives Market Volume (Kilo Tons) Forecast, by End-use Industry 2020–2031
Table 98: Japan Performance Minerals Additives Market Value (US$ Bn) Forecast, by End-use Industry 2020–2031
Table 99: India Performance Minerals Additives Market Volume (Kilo Tons) Forecast, by Form, 2020–2031
Table 100: India Performance Minerals Additives Market Value (US$ Bn) Forecast, by Form, 2020–2031
Table 101: India Performance Minerals Additives Market Volume (Kilo Tons) Forecast, by Application, 2020–2031
Table 102: India Performance Minerals Additives Market Value (US$ Bn) Forecast, by Application, 2020–2031
Table 103: India Performance Minerals Additives Market Volume (Kilo Tons) Forecast, by End-use Industry 2020–2031
Table 104: India Performance Minerals Additives Market Value (US$ Bn) Forecast, by End-use Industry 2020–2031
Table 105: ASEAN Performance Minerals Additives Market Volume (Kilo Tons) Forecast, by Form, 2020–2031
Table 106: ASEAN Performance Minerals Additives Market Value (US$ Bn) Forecast, by Form, 2020–2031
Table 107: ASEAN Performance Minerals Additives Market Volume (Kilo Tons) Forecast, by Application, 2020–2031
Table 108: ASEAN Performance Minerals Additives Market Value (US$ Bn) Forecast, by Application, 2020–2031
Table 109: ASEAN Performance Minerals Additives Market Volume (Kilo Tons) Forecast, by End-use Industry 2020–2031
Table 110: ASEAN Performance Minerals Additives Market Value (US$ Bn) Forecast, by End-use Industry 2020–2031
Table 111: Rest of Asia Pacific Performance Minerals Additives Market Volume (Kilo Tons) Forecast, by Form, 2020–2031
Table 112: Rest of Asia Pacific Performance Minerals Additives Market Value (US$ Bn) Forecast, by Form, 2020–2031
Table 113: Rest of Asia Pacific Performance Minerals Additives Market Volume (Kilo Tons) Forecast, by Application, 2020–2031
Table 114: Rest of Asia Pacific Performance Minerals Additives Market Value (US$ Bn) Forecast, by Application, 2020–2031
Table 115: Rest of Asia Pacific Performance Minerals Additives Market Volume (Kilo Tons) Forecast, by End-use Industry 2020–2031
Table 116: Rest of Asia Pacific Performance Minerals Additives Market Value (US$ Bn) Forecast, by End-use Industry 2020–2031
Table 117: Latin America Performance Minerals Additives Market Volume (Kilo Tons) Forecast, by Form, 2020–2031
Table 118: Latin America Performance Minerals Additives Market Value (US$ Bn) Forecast, by Form, 2020–2031
Table 119: Latin America Performance Minerals Additives Market Volume (Kilo Tons) Forecast, by Application, 2020–2031
Table 120: Latin America Performance Minerals Additives Market Value (US$ Bn) Forecast, by Application, 2020–2031
Table 121: Latin America Performance Minerals Additives Market Volume (Kilo Tons) Forecast, by End-use Industry 2020–2031
Table 122: Latin America Performance Minerals Additives Market Value (US$ Bn) Forecast, by End-use Industry 2020–2031
Table 123: Latin America Performance Minerals Additives Market Volume (Kilo Tons) Forecast, by Country and Sub-Region 2020–2031
Table 124: Latin America Performance Minerals Additives Market Value (US$ Bn) Forecast, by Country and Sub-Region 2020–2031
Table 125: Brazil Performance Minerals Additives Market Volume (Kilo Tons) Forecast, by Form, 2020–2031
Table 126: Brazil Performance Minerals Additives Market Value (US$ Bn) Forecast, by Form, 2020–2031
Table 127: Brazil Performance Minerals Additives Market Volume (Kilo Tons) Forecast, by Application, 2020–2031
Table 128: Brazil Performance Minerals Additives Market Value (US$ Bn) Forecast, by Application, 2020–2031
Table 129: Brazil Performance Minerals Additives Market Volume (Kilo Tons) Forecast, by End-use Industry 2020–2031
Table 130: Brazil Performance Minerals Additives Market Value (US$ Bn) Forecast, by End-use Industry 2020–2031
Table 131: Mexico Performance Minerals Additives Market Volume (Kilo Tons) Forecast, by Form, 2020–2031
Table 132: Mexico Performance Minerals Additives Market Value (US$ Bn) Forecast, by Form, 2020–2031
Table 133: Mexico Performance Minerals Additives Market Volume (Kilo Tons) Forecast, by Application, 2020–2031
Table 134: Mexico Performance Minerals Additives Market Value (US$ Bn) Forecast, by Application, 2020–2031
Table 135: Mexico Performance Minerals Additives Market Volume (Kilo Tons) Forecast, by End-use Industry 2020–2031
Table 136: Mexico Performance Minerals Additives Market Value (US$ Bn) Forecast, by End-use Industry 2020–2031
Table 137: Rest of Latin America Performance Minerals Additives Market Volume (Kilo Tons) Forecast, by Form, 2020–2031
Table 138: Rest of Latin America Performance Minerals Additives Market Value (US$ Bn) Forecast, by Form, 2020–2031
Table 139: Rest of Latin America Performance Minerals Additives Market Volume (Kilo Tons) Forecast, by Application, 2020–2031
Table 140: Rest of Latin America Performance Minerals Additives Market Value (US$ Bn) Forecast, by Application, 2020–2031
Table 141: Rest of Latin America Performance Minerals Additives Market Volume (Kilo Tons) Forecast, by End-use Industry 2020–2031
Table 142: Rest of Latin America Performance Minerals Additives Market Value (US$ Bn) Forecast, by End-use Industry 2020–2031
List of Figures
Figure 1: Global Performance Minerals Additives Market Volume Share Analysis, by Type, 2020, 2024, and 2031
Figure 2: Global Performance Minerals Additives Market Attractiveness, by Type
Figure 3: Global Performance Minerals Additives Market Volume Share Analysis, by Application, 2020, 2024, and 2031
Figure 4: Global Performance Minerals Additives Market Attractiveness, by Application
Figure 5: Global Performance Minerals Additives Market Volume Share Analysis, by End-use Industry, 2020, 2024, and 2031
Figure 6: Global Performance Minerals Additives Market Attractiveness, by End-use Industry
Figure 7: Global Performance Minerals Additives Market Volume Share Analysis, by Region, 2020, 2024, and 2031
Figure 8: Global Performance Minerals Additives Market Attractiveness, by Region
Figure 9: North America Performance Minerals Additives Market Volume Share Analysis, by Type, 2020, 2024, and 2031
Figure 10: North America Performance Minerals Additives Market Attractiveness, by Type
Figure 11: North America Performance Minerals Additives Market Volume Share Analysis, by Application, 2020, 2024, and 2031
Figure 12: North America Performance Minerals Additives Market Attractiveness, by Application
Figure 13: North America Performance Minerals Additives Market Volume Share Analysis, by End-use Industry, 2020, 2024, and 2031
Figure 14: North America Performance Minerals Additives Market Attractiveness, by End-use Industry
Figure 15: North America Performance Minerals Additives Market Volume Share Analysis, by Region, 2020, 2024, and 2031
Figure 16: North America Performance Minerals Additives Market Attractiveness, by Country and Sub-Region
Figure 17: Europe Performance Minerals Additives Market Volume Share Analysis, by Type, 2020, 2024, and 2031
Figure 18: Europe Performance Minerals Additives Market Attractiveness, by Type
Figure 19: Europe Performance Minerals Additives Market Volume Share Analysis, by Application, 2020, 2024, and 2031
Figure 20: Europe Performance Minerals Additives Market Attractiveness, by Application
Figure 21: Europe Performance Minerals Additives Market Volume Share Analysis, by End-use Industry, 2020, 2024, and 2031
Figure 22: Europe Performance Minerals Additives Market Attractiveness, by End-use Industry
Figure 23: Europe Performance Minerals Additives Market Volume Share Analysis, by Region, 2020, 2024, and 2031
Figure 24: Europe Performance Minerals Additives Market Attractiveness, by Country and Sub-Region
Figure 25: Asia Pacific Performance Minerals Additives Market Volume Share Analysis, by Type, 2020, 2024, and 2031
Figure 26: Asia Pacific Performance Minerals Additives Market Attractiveness, by Type
Figure 27: Asia Pacific Performance Minerals Additives Market Volume Share Analysis, by Application, 2020, 2024, and 2031
Figure 28: Asia Pacific Performance Minerals Additives Market Attractiveness, by Application
Figure 29: Asia Pacific Performance Minerals Additives Market Volume Share Analysis, by End-use Industry, 2020, 2024, and 2031
Figure 30: Asia Pacific Performance Minerals Additives Market Attractiveness, by End-use Industry
Figure 31: Asia Pacific Performance Minerals Additives Market Volume Share Analysis, by Region, 2020, 2024, and 2031
Figure 32: Asia Pacific Performance Minerals Additives Market Attractiveness, by Country and Sub-Region
Figure 33: Latin America Performance Minerals Additives Market Volume Share Analysis, by Type, 2020, 2024, and 2031
Figure 34: Latin America Performance Minerals Additives Market Attractiveness, by Type
Figure 35: Latin America Performance Minerals Additives Market Volume Share Analysis, by Application, 2020, 2024, and 2031
Figure 36: Latin America Performance Minerals Additives Market Attractiveness, by Application
Figure 37: Latin America Performance Minerals Additives Market Volume Share Analysis, by End-use Industry, 2020, 2024, and 2031
Figure 38: Latin America Performance Minerals Additives Market Attractiveness, by End-use Industry
Figure 39: Latin America Performance Minerals Additives Market Volume Share Analysis, by Region, 2020, 2024, and 2031
Figure 40: Latin America Performance Minerals Additives Market Attractiveness, by Country and Sub-Region
Figure 41: Middle East & Africa Performance Minerals Additives Market Volume Share Analysis, by Type, 2020, 2024, and 2031
Figure 42: Middle East & Africa Performance Minerals Additives Market Attractiveness, by Type
Figure 43: Middle East & Africa Performance Minerals Additives Market Volume Share Analysis, by Application, 2020, 2024, and 2031
Figure 44: Middle East & Africa Performance Minerals Additives Market Attractiveness, by Application
Figure 45: Middle East & Africa Performance Minerals Additives Market Volume Share Analysis, by End-use Industry, 2020, 2024, and 2031
Figure 46: Middle East & Africa Performance Minerals Additives Market Attractiveness, by End-use Industry
Figure 47: Middle East & Africa Performance Minerals Additives Market Volume Share Analysis, by Region, 2020, 2024, and 2031
Figure 48: Middle East & Africa Performance Minerals Additives Market Attractiveness, by Country and Sub-Region
Copyright © Transparency Market Research, Inc. All Rights reserved
Trust Online

Performance Minerals Additives Market Analysis, 2021-2031