
Reports
Reports
Global Pediatric Neuroblastoma Treatment Market: An Overview
By the end of the forecast period of 2018 to 2026, the global pediatric neuroblastoma treatment will witness increase in market worth to USD 1.3 billion. The market would grow at a compound annual growth rate 8.9% over this period. This growth will manifest itself in the market in a number of ways including generation of a marked number of profitable opportunities. A large number of prominent factors of growth are marking the global pediatric neuroblastoma treatment market and are responsible for this growth.
Increasing awareness and efforts directed by governmesnts across the globe is set to improve outcomes is leading to notable growth in the market. It is an outcome of growing number of cases of pediatric neuroblastoma.
Thus, one notes intensive research and development going on across nations. This is paving way for better and more effective treatments. It will therefore help the market grow at a considerable pace over the forecast period. Advancement in technology also holds key place here as it is crucial in determining growth for the players as well overall market landscape.
Improving healthcare infrastructure, particularly in the developing regions of the world, will lead to growth in pediatric neuroblastoma treatment market. A high incidence of this condition is also a notable factor of growth in the market. Governments are also directed efforts in this direction.
These factors are also leading to increase in awareness regarding the condition and that is leading to growth in the market as demand for effective treatments take on an upward growth curve. The only restrain that is set to mark the landscape over the forecast period, restraining the market from reaching its full growth potential is high costs of such treatments – therapies and drugs. Research and development in the field is also an expensive endeavor in the market.
The market for pediatric neuroblastoma has a number of players operating its playfield. Some of the dominant names are United Therapeutics Corporation, APEIRON Biologics AG, Baxter, CELLECTAR BIOSCIENCES, INC, Sun Pharmaceutical Industries, Inc., Pfizer, Inc., Bayer AG, MacroGenics, Inc., and Sartorius AG, among others.
A number of strategies are often deployed by these players in order to grow. Therefore, one often notes players entering in to new alliances such as strategic partnerships and collaborations as these help in combining resources such as man-power, know-how, and so on in order to ensure growth. Besides, these are also responsible for helping players get better market penetration.
Other notable strategies are development of drugs and therapies. It creates a very prominent place for research and development (R&D) activities in the overall growth strategy. Besides, technological development also holds key to future growth.
Chemotherapy Segment to Dominate Global Pediatric Neuroblastoma Treatment Market over the Forecast Period
The global pediatric neuroblastoma treatment market report is segmented on the basis of therapy type and distribution channel. The former is sub-segmented into immunotherapy and chemotherapy. Distribution channels include examination of hospitals, pharmacies, retail pharmacies, and drug stores.
In 2017, the chemotherapy segment under the therapy type category held the dominant share and the trend is anticipated to roll into the forecast period. Besides, analysts claim that it will also grow at a very high rate over the forecast period. One of the biggest factors of growth that push the segment up is the high efficacy of the segment. It is highly preferred b physicians around the world for managing symptoms and progression. Additionally, it is quite pertinent to note here that it is also used in combination with other therapies such as radiation therapy.
Furthermore, on the basis of distribution channel, hospital pharmacies will top the growth charts owing to high preference and reliance on these for drug needs. In 2017 as well, this segment contributed massively to market growth. It is also important to make note of the fact here that there these enjoys high credibility in the market.
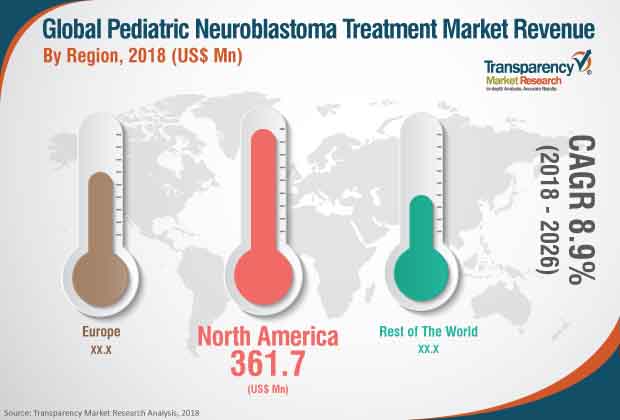
North America Expected to Dominate the Global Pediatric Neuroblastoma Treatment Market over the Forecast Period of 2018 to 2026
North America, Europe, Asia Pacific, and Rest of the World form various regional segments that report on pediatric Neuroblastoma treatment market, prepared by Transparency Market Research, covers. As per analysis, North America would account for a dominant share in the market over the forecast period and a number of factors would push it to that position.
For instance, high incidence of neuroblastoma is being noted in the North American region. This is contributing immensely to growth, which is projected for the region. Healthcare infrastructure here is robust and this is also owed to as far as rosy statistics are concerned. Besides, better reimbursement framework and growing awareness are also major growth propellers in the regional market.
It is also quite interesting to note here that the United States of America will be a notable contributor to growth in the market. Every year, 800 cases of neuroblastoma are reported in the country, states American Cancer Society.
On the other hand, it will be the Asia Pacific (APAC) region that displays a sturdy growth rate over the forecast period. Reasons that will be attributed to this growth are increase in public investment and improvement in healthcare infrastructure. Additionally, certain technological advancements, particularly those noted in India and China, are contributing massively to the steady trajectory. The region will also create opportunities – gainful and novel - for market players to tap into, in order to secure growth.
1. Preface
1.1. Market Definition and Scope
1.2. Market Segmentation
1.3. Key Research Objectives
1.4. Research Highlights
2. Assumptions and Research Methodology
3. Executive Summary: Global Pediatric Neuroblastoma Treatment Market
4. Market Overview
4.1. Introduction
4.1.1. Market Definition
4.1.2. Industry Evolution / Developments
4.2. Overview
4.3. Market Dynamics
4.3.1. Drivers
4.3.2. Restraints
4.3.3. Opportunities
4.4. Global Pediatric Neuroblastoma Treatment Market Analysis and Forecast, 2016–2026
4.4.1. Market Revenue Projections (US$ Mn)
4.5. Porter’s Five Force Analysis
5. Market Outlook
5.1. Epidemiology Pediatric Neuroblastoma
5.2. Pipeline Analysis
5.3. Key Unmet Needs in the Pediatric Neuroblastoma Treatment Market
5.4. Global Pediatric Neuroblastoma Treatment Market: Rate of Metastasis in Neuroblastoma
5.5. Global Pediatric Neuroblastoma Treatment Market: Neuroblastoma Relapse/Refractory cases
5.6. Rate of Utilization of MIBG-131
6. Global Pediatric Neuroblastoma Treatment Market Analysis and Forecast, by Therapy Type
6.1. Introduction & Definition
6.2. Key Findings / Developments
6.3. Market Value Forecast, by Therapy Type, 2016–2026
6.3.1. Immunotherapy
6.3.2. Chemotherapy
6.3.3. Others
6.4. Market Attractiveness, by Therapy Type
7. Global Pediatric Neuroblastoma Treatment Market Analysis and Forecast, by End-user
7.1. Introduction & Definition
7.2. Key Findings / Developments
7.3. Market Value Forecast, by Distribution Channel, 2016–2026
7.3.1. Hospital Pharmacies
7.3.2. Retail Pharmacies & Drug Stores
7.4. Market Attractiveness, by Distribution Channel
8. Global Pediatric Neuroblastoma Treatment Market Analysis and Forecast, by Region
8.1. Key Findings
8.2. Market Value Forecast, by Region
8.2.1. North America
8.2.2. Europe
8.2.3. Rest of the World
8.3. Market Attractiveness, by Region
9. North America Pediatric Neuroblastoma Treatment Market Analysis and Forecast
9.1. Introduction
9.1.1. Key Findings
9.2. Market Value Forecast, by Therapy Type, 2016–2026
9.2.1. Immunotherapy
9.2.2. Chemotherapy
9.2.3. Others
9.3. Market Value Forecast, by Distribution Channel, 2016–2026
9.3.1. Hospital Pharmacies
9.3.2. Retail Pharmacies & Drug Stores
9.4. Market Value Forecast, by Country, 2016–2026
9.4.1. U.S.
9.4.2. Canada
9.5. Market Attractiveness Analysis
9.5.1. By Therapy Type
9.5.2. By Distribution Channel
9.5.3. By Country
10. Europe Pediatric Neuroblastoma Treatment Market Analysis and Forecast
10.1. Introduction
10.1.1. Key Findings
10.2. Market Value Forecast, by Therapy Type, 2016–2026
10.2.1. Immunotherapy
10.2.2. Chemotherapy
10.2.3. Others
10.3. Market Value Forecast, by Distribution Channel, 2016–2026
10.3.1. Hospital Pharmacies
10.3.2. Retail Pharmacies & Drug Stores
10.4. Market Value Forecast, by Country/Sub-region, 2016–2026
10.4.1. Germany
10.4.2. U.K.
10.4.3. France
10.4.4. Rest of Europe
10.5. Market Attractiveness Analysis
10.5.1. By Therapy Type
10.5.2. By Distribution Channel
10.5.3. By Country/Sub-region
11. Rest of the World Pediatric Neuroblastoma Treatment Market Analysis and Forecast
11.1. Introduction
11.1.1. Key Findings
11.2. Market Value Forecast, by Therapy Type, 2016–2026
11.2.1. Immunotherapy
11.2.2. Chemotherapy
11.2.3. Others
11.3. Market Value Forecast, by Distribution Channel, 2016–2026
11.3.1. Hospital Pharmacies
11.3.2. Retail Pharmacies & Drug Stores
11.4. Market Attractiveness Analysis
11.4.1. By Therapy Type
11.4.2. By Distribution Channel
12. Company Profiles
12.1. United Therapeutics Corporation
12.1.1. Company Overview (HQ, Business Segments, Employee Strength)
12.1.2. Product Portfolio
12.1.3. SWOT Analysis
12.1.4. Financial Overview
12.1.5. Strategic Overview
12.2. APEIRON Biologics AG
12.2.1. Company Overview (HQ, Business Segments, Employee Strength)
12.2.2. Product Portfolio
12.2.3. SWOT Analysis
12.2.4. Financial Overview
12.2.5. Strategic Overview
12.3. Baxter
12.3.1. Company Overview (HQ, Business Segments, Employee Strength)
12.3.2. Product Portfolio
12.3.3. SWOT Analysis
12.3.4. Financial Overview
12.3.5. Strategic Overview
12.4. Cellectar Biosciences, Inc.
12.4.1. Company Overview (HQ, Business Segments, Employee Strength)
12.4.2. Product Portfolio
12.4.3. SWOT Analysis
12.4.4. Financial Overview
12.4.5. Strategic Overview
12.5. Pfizer, Inc.
12.5.1. Company Overview (HQ, Business Segments, Employee Strength)
12.5.2. Product Portfolio
12.5.3. SWOT Analysis
12.5.4. Financial Overview
12.5.5. Strategic Overview
12.6. MacroGenics, Inc.
12.6.1. Company Overview (HQ, Business Segments, Employee Strength)
12.6.2. Product Portfolio
12.6.3. SWOT Analysis
12.6.4. Financial Overview
12.6.5. Strategic Overview
12.7. Bayer AG
12.7.1. Company Overview (HQ, Business Segments, Employee Strength)
12.7.2. Product Portfolio
12.7.3. SWOT Analysis
12.7.4. Financial Overview
12.7.5. Strategic Overview
List of Tables
Table 01: List of acronyms used in the report
Table 02: Global Pediatric Neuroblastoma Treatment Market: Pipeline Analysis
Table 03: Global Pediatric Neuroblastoma Treatment Market: Pipeline Analysis
Table 04: Global Pediatric Neuroblastoma Treatment Market: Pipeline Analysis
Table 05: Global Pediatric Neuroblastoma Treatment Market: Pipeline Analysis
Table 06: Global Pediatric Neuroblastoma Treatment Market: Pipeline Analysis
Table 07: Global Pediatric Neuroblastoma Treatment Market: Pipeline Analysis
Table 08: Global Pediatric Neuroblastoma Treatment Market: Pipeline Analysis
Table 09: Global Pediatric Neuroblastoma Treatment Market: Pipeline Analysis
Table 10: Global Pediatric Neuroblastoma Treatment Market: Pipeline Analysis
Table 11: Global Pediatric Neuroblastoma Treatment Market: Pipeline Analysis
Table 12: Global Pediatric Neuroblastoma Treatment Market: Pipeline Analysis
Table 13: Global Pediatric Neuroblastoma Treatment Market: Pipeline Analysis
Table 14: Global Pediatric Neuroblastoma Treatment Market: Pipeline Analysis
Table 15: Global Pediatric Neuroblastoma Treatment Market Value (US$ Mn) Forecast, by Therapy Type, 2016–2026
Table 16: Global Pediatric Neuroblastoma Treatment Market Value (US$ Mn) Forecast, by Distribution Channel, 2016–2026
Table 17: Global Pediatric Neuroblastoma Treatment Market Value (US$ Mn) Forecast, by Region, 2016–2026
Table 18: North America Pediatric Neuroblastoma Treatment Market Value (US$ Mn) Forecast, by Country, 2016–2026
Table 19: North America Pediatric Neuroblastoma Treatment Market Value (US$ Mn) Forecast, by Therapy Type, 2016–2026
Table 20: North America Pediatric Neuroblastoma Treatment Market Value (US$ Mn) Forecast, by Distribution Channel, 2016–2026
Table 21: Europe Pediatric Neuroblastoma Treatment Market Value (US$ Mn) Forecast, by Country/Sub-region, 2016–2026
Table 22: Europe Pediatric Neuroblastoma Treatment Market Value (US$ Mn) Forecast, by Therapy Type, 2016–2026
Table 23: Europe Pediatric Neuroblastoma Treatment Market Value (US$ Mn) Forecast, by Distribution Channel, 2016–2026
Table 24: Rest of the World Pediatric Neuroblastoma Treatment Market Value (US$ Mn) Forecast, by Therapy Type, 2016–2026
Table 25: Rest of the World Pediatric Neuroblastoma Treatment Market Value (US$ Mn) Forecast, by Distribution Channel, 2016–2026
List of Figures
Figure 01: Global Pediatric Neuroblastoma Treatment Market
Figure 02: Global Pediatric Neuroblastoma Treatment Market Size (US$ Mn), by Therapy Type, 2017
Figure 03: Global Pediatric Neuroblastoma Treatment Market Segments with Leading Market Share (%), 2017
Figure 04: Global Pediatric Neuroblastoma Treatment Market Value (US$ Mn) Forecast, 2016–2026
Figure 05: Global Pediatric Neuroblastoma Treatment Market Value Share (%), by Therapy Type, 2017
Figure 06: Global Pediatric Neuroblastoma Treatment Market Value Share (%), by Distribution Channel, 2017
Figure 07: Global Pediatric Neuroblastoma Treatment Market Value Share (%), by Region, 2017
Figure 08: Key Industry Events
Figure 09: Porter’s Five Forces Analysis
Figure 10: Epidemiology of Neuroblastoma
Figure 11: Epidemiology of Neuroblastoma: Numbers of Annual New Neuroblastoma Cases in Key Markets
Figure 12: Epidemiology of Neuroblastoma Key Research Findings
Figure 13: Epidemiology of Neuroblastoma, by Country
Figure 14: Epidemiology of Neuroblastoma, by Country
Figure 15: Epidemiology of Neuroblastoma, by Country
Figure 16: Key Unmet Needs in the Pediatric Neuroblastoma Treatment Market
Figure 17: Global Pediatric Neuroblastoma Treatment Market: Rate of Metastasis to the Brain
Figure 18: Global Pediatric Neuroblastoma Treatment Market: Rate of Metastasis to the Brain
Figure 19: Global Pediatric Neuroblastoma Treatment Market: Neuroblastoma Relapse/Refractory cases
Figure 20: Global Pediatric Neuroblastoma Treatment Market: Neuroblastoma Relapse/Refractory cases
Figure 21: Global Pediatric Neuroblastoma Treatment Market: Utilization of MIBG-131
Figure 22: Global Pediatric Neuroblastoma Treatment Market: Utilization of MIBG-131
Figure 23: Global Pediatric Neuroblastoma Treatment Market Value Share (%), by Therapy Type, 2017 and 2026
Figure 24: Global Pediatric Neuroblastoma Treatment Market Attractiveness, by Therapy Type, 2018–2026
Figure 25: Global Pediatric Neuroblastoma Treatment Market Revenue (US$ Mn) Forecast, by Immunotherapy, 2016–2026
Figure 26: Global Pediatric Neuroblastoma Treatment Market Revenue (US$ Mn) Forecast, by Chemotherapy, 2016–2026
Figure 27: Global Pediatric Neuroblastoma Treatment Market Revenue (US$ Mn) Forecast, by Others, 2016–2026
Figure 28: Global Pediatric Neuroblastoma Treatment Market Value Share (%), by Distribution Channel, 2017 and 2026
Figure 29: Global Pediatric Neuroblastoma Treatment Market Attractiveness, by Distribution Channel, 2018–2026
Figure 30: Global Pediatric Neuroblastoma Treatment Market Revenue (US$ Mn) Forecast, by Hospital Pharmacies, 2016–2026
Figure 31: Global Pediatric Neuroblastoma Treatment Market Revenue (US$ Mn) Forecast, by Retail Pharmacies & Drug Stores, 2016–2026
Figure 32: Global Pediatric Neuroblastoma Treatment Market Value Share (%), by Region, 2017 and 2026
Figure 33: Global Pediatric Neuroblastoma Treatment Market Attractiveness, by Region, 2018–2026
Figure 34: North America Pediatric Neuroblastoma Treatment Market Revenue (US$ Mn) forecast, 2016–2026
Figure 35: North America Pediatric Neuroblastoma Treatment Market Value Share (%), by Country, 2017 and 2026
Figure 36: North America Pediatric Neuroblastoma Treatment Market Attractiveness, by Country, 2018–2026
Figure 37: North America Pediatric Neuroblastoma Treatment Market Value Share (%), by Therapy Type, 2017 and 2026
Figure 38: North America Pediatric Neuroblastoma Treatment Market Attractiveness, by Therapy Type, 2018–2026
Figure 39: North America Pediatric Neuroblastoma Treatment Market Value Share (%), by Distribution Channel, 2017 and 2026
Figure 40: North America Pediatric Neuroblastoma Treatment Market Attractiveness, by Distribution Channel, 2018–2026
Figure 41: Europe Pediatric Neuroblastoma Treatment Market Revenue (US$ Mn) Forecast, 2016–2026
Figure 42: Europe Pediatric Neuroblastoma Treatment Market Value Share (%), by Country/Sub-region, 2017 and 2026
Figure 43: Europe Pediatric Neuroblastoma Treatment Market Attractiveness, by Country/Sub-region, 2018–2026
Figure 44: Europe Pediatric Neuroblastoma Treatment Market Value Share (%), by Therapy Type, 2017 and 2026
Figure 45: Europe Pediatric Neuroblastoma Treatment Market Attractiveness, by Therapy Type, 2018–2026
Figure 46: Europe Pediatric Neuroblastoma Treatment Market Value Share (%), by Distribution Channel, 2017 and 2026
Figure 47: Europe Pediatric Neuroblastoma Treatment Market Attractiveness, by Distribution Channel, 2018–2026
Figure 48: Rest of the World Pediatric Neuroblastoma Treatment Market Revenue (US$ Mn) and Y-o-Y Growth (%) Forecast, 2016–2026
Figure 49: Rest of the World Pediatric Neuroblastoma Treatment Market Value Share (%), by Therapy Type, 2017 and 2026
Figure 50: Rest of the World Pediatric Neuroblastoma Treatment Market Attractiveness, by Therapy Type, 2018–2026
Figure 51: Rest of the World Pediatric Neuroblastoma Treatment Market Value Share (%), by Distribution Channel, 2017 and 2026
Figure 52: Rest of the World Pediatric Neuroblastoma Treatment Market Attractiveness, by Distribution Channel, 2018–2026
Figure 53: United Therapeutics Corporation Revenue (US$ Mn) and Y-o-Y Growth (%), 2014–2017
Figure 54: United Therapeutics Corporation Net sales of Unituxin (US$ Mn) and Y-o-Y Growth (%), 2015–2017
Figure 55: United Therapeutics Corporation Breakdown of Net Sales, by Product, 2017
Figure 56: United Therapeutics Corporation Research and Development Cost (US$ Mn), 2015–2017
Figure 57: United Therapeutics Corporation: SWOT Analysis
Figure 58: MacroGenics, Inc. Revenue (US$ Mn) and Y-o-Y Growth (%), 2014–2017
Figure 59: MacroGenics, Inc. Net sales of Unituxin (US$ Mn) and Y-o-Y Growth (%), 2015–2017
Figure 60: MacroGenics, Inc. Net sales (US$ Mn) by key brands
Figure 61: MacroGenics, Inc. Research and Development Cost (US$ Mn), 2015–2017
Figure 62: MacroGenics, Inc.: SWOT Analysis
Figure 63: APEIRON Biologics AG: SWOT Analysis
Figure 64: Baxter Revenue (US$ Mn) and Y-o-Y Growth (%), 2013–2017
Figure 65: Baxter Breakdown of Net Sales (%), by Region, 2017
Figure 66: Baxter pipeline of generic products, 2016–2020
Figure 67: Baxter: SWOT Analysis
Figure 68: Pfizer Inc. Revenue (US$ Mn) and Y-o-Y Growth (%), 2014–2017
Figure 69: Pfizer Inc. R&D Expenses (US$ Mn), 2014–2017
Figure 70: Pfizer Inc.: SWOT Analysis
Figure 71: Cellectar Biosciences, Inc. Research and Development Cost (US$ Mn) and Y-o-Y Growth (%), 2016–2017
Figure 72: Cellectar Biosciences, Inc.: SWOT Analysis
Figure 73: Bayer Group Revenue (US$ Mn) and Y-o-Y Growth (%), 2016–2017
Figure 74: Bayer Group Breakdown of Net Sales (%), by Region, 2017
Figure 75: Bayer Group Breakdown of Net Sales (%), by Business Segment, 2017
Figure 76: Bayer Group: SWOT Analysis
Copyright © Transparency Market Research, Inc. All Rights reserved
Trust Online

Pediatric Neuroblastoma Treatment Market