
Reports
Reports
An orthopedic digit implant is a medical device used for replacing a damaged bone or a missing joint in small joints segment, such as fingers, toes, ankle, elbow, and knee. Orthopedic digit implants are biocompatible, produced from materials such as stainless steel or titanium, and topped with a plastic coating that performs functioning as an artificial cartilage. Types of orthopedic digit implants currently available in the market include metacarpel joint implants (upper extremity), metatarsal joint implants (lower extremity), hemi phalangeal implants, scaphoid bone implants, and toe intramedullary implants.
Increasing Preference for Minimally Invasive Surgeries to Treat Orthopedic Diseases will drive Market Expansion
Prevalence of rheumatoid arthritis has witnessed a surge, resulting into an increasing demand for orthopedic procedures. With increasing awareness about health, the elderly cohort is leading more active lifestyles across the globe, particularly in developed regions, which in turn has led toward more stress and joint injuries. These factors have driven the demand for various orthopedic implants such as the digit implants. Orthopedic digit implants find widespread application in areas such as oncology, and traumatology. With increasing preference for minimally invasive surgeries to treat orthopedic diseases, and rapidly penetration of 3D printing technology in orthopedics, potential opportunities will be created for the market expansion in the foreseeable future.
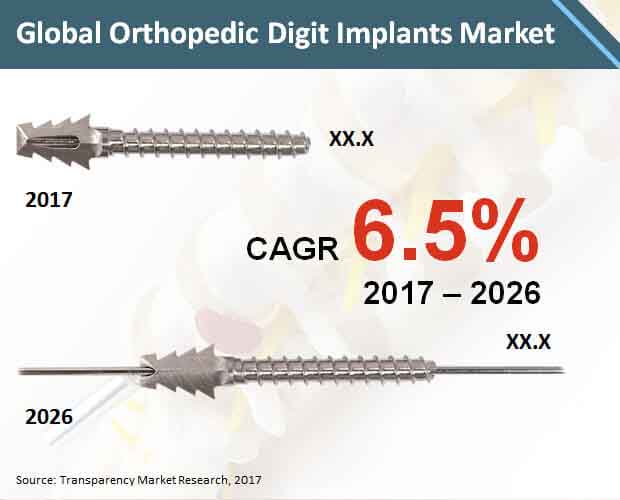
However, stringent regulatory approval procedures, and limited medical insurance coverage are likely to impede adoption of orthopedic digit implants. In addition, hypersensitivity, implant dislocation, post-surgery infections, and toxicity are major concerns among patients which might hinder growth of the market. A new report by Transparency Market Research (TMR) projects the global orthopedic digit implant market to reflect an impressive expansion over the forecast period (2017-2026). Global sales of orthopedic implants are estimated to exceed US$ 100 Mn by 2026-end.
Latin America to be Fastest Expanding Market for Orthopedic Digit Implants by 2026-end
Latin America is projected to be the fastest expanding market for orthopedic digit implants by 2026-end. However, revenues from the market in Latin America will remain comparatively lower than those from North America, Europe and Asia-Pacific excluding Japan (APEJ). Projected to exhibit an impressive expansion through 2026, North America will remain the most lucrative market for orthopedic digit implants, in terms of revenues. Between Europe and APEJ, the former will account for a comparatively larger market revenue share, while the latter will register a relatively faster expansion in the market during the forecast period.
In terms of revenues, metacarpel joint implants (upper extremity) and metatarsal joint implants (lower extremity) will remain dominant in the market, based on product type. However, sales of metatarsal joint implants (lower extremity) will continue ride on a comparatively higher CAGR than sales of metacarpel joint implants (upper extremity). In addition, hemi phalangeal implants and scaphoid bone implants are projected to be the fast-selling products in the market during 2017 to 2026. In contrast, sales of toe implants will continue to witness a sluggish expansion in the global orthopedic digit implants market.
Sales of Silicon Pyrocarbon to Exhibit Highest CAGR through 2026
Based on material, Nitinol is anticipated to remain sought-after among manufacturers of orthopedic digit implants, with sales estimated to reach nearly US$ 90 Mn by 2026-end. Silicon pyrocarbon will account for the smallest revenue share of the market, however their sales are projected to exhibit the highest CAGR through 2026. Revenues from sales of titanium for manufacturing orthopedic digit implants will remain relatively larger than those from silicon pyrocarbon over the forecast period.
Hospital will continue to be the largest end-users of orthopedic digit implants. Sales of orthopedic digit implants in hospitals will ride on a CAGR of nearly 7% through 2026. Specialty orthopedic clinics are projected to account for a very low revenue share of the market throughout the forecast period.
Competition Tracking
Key market players identified by TMR’s report on the global orthopedic digit implants include Wright Medical Group N.V., Integra LifeSciences Corporation, TEIJIN NAKASHIMA MEDICAL CO., LTD., Stryker Corporation, DePuy Orthopaedics, Inc. (Johnson & Johnson), VILEX IN TENNESSEE, INC., and Merete Medical.
Heightening Geriatric Population and the Trend of Minimally Invasive Surgeries to Propel the Growth of the Orthopedic Digit Implants Market
The rising popularity of minimally invasive surgeries among a considerable chunk of the populace is proving to be a great growth factor for the orthopedic digit implants market. In addition, the escalating cases of rheumatoid arthritis among a considerable chunk of the populace will serve as a prominent growth opportunity. All these factors will invite substantial growth for the orthopedic digit implants market during the forecast period of 2017-2026.
Chapter 1 Global Outlook
Chapter 2 Global Orthopedic Digit Implants Market - Executive Summary
Chapter 3 Global Orthopedic Digit Implants Market Overview
3.1 Introduction
3.1.1 Global Orthopedic Digit Implants Market Taxonomy
3.1.2 Global Orthopedic Digit Implants Market Definition
3.2 Global Orthopedic Digit Implants Market Size (US$ Mn) and Forecast, 2012-2026
3.2.1 Global Orthopedic Digit Implants Market Y-o-Y Growth
3.3 Global Orthopedic Digit Implants Market Dynamics
3.4 Supply Chain
3.5 Cost Structure
3.6 Orthopedic Segmental Sales
3.7 PESTL Analysis
3.8 Product Life Cycle Analysis
3.9 Key Regulations
3.10 PATENT
3.11 List of Distributors
3.12 Key Participants Market Presence (Intensity Map) By Region
Chapter 4 Global Orthopedic Digit Implants Market Analysis and Forecast 2012-2026
4.1 Global Orthopedic Digit Implants Market Size and Forecast By Product Type, 2012-2026
4.1.1 Metacarpal Joint Implants (Upper extremity) Market Size and Forecast, 2012-2026
4.1.1.1 Revenue (US$ Mn) Comparison, By Region
4.1.1.2 Market Share Comparison, By Region
4.1.1.3 Y-o-Y growth Comparison, By Region
4.1.2 Metatarsal Joint Implants (Lower extremity) Market Size and Forecast, 2012-2026
4.1.2.1 Revenue (US$ Mn) Comparison, By Region
4.1.2.2 Market Share Comparison, By Region
4.1.2.3 Y-o-Y growth Comparison, By Region
4.1.3 Hemi Phalangeal Implants Market Size and Forecast, 2012-2026
4.1.3.1 Revenue (US$ Mn) Comparison, By Region
4.1.3.2 Market Share Comparison, By Region
4.1.3.3 Y-o-Y growth Comparison, By Region
4.1.4 Scaphoid Bone Implants Market Size and Forecast, 2012-2026
4.1.4.1 Revenue (US$ Mn) Comparison, By Region
4.1.4.2 Market Share Comparison, By Region
4.1.4.3 Y-o-Y growth Comparison, By Region
4.1.5 Toe Intramedullary Implants Market Size and Forecast, 2012-2026
4.1.5.1 Revenue (US$ Mn) Comparison, By Region
4.1.5.2 Market Share Comparison, By Region
4.1.5.3 Y-o-Y growth Comparison, By Region
4.2 Global Orthopedic Digit Implants Market Size and Forecast by End User, 2012-2026
4.2.1 Hospitals Market Size and Forecast, 2012-2026
4.2.1.1 Revenue (US$ Mn) Comparison, By Region
4.2.1.2 Market Share Comparison, By Region
4.2.1.3 Y-o-Y growth Comparison, By Region
4.2.2 Specialty Orthopedic Clinics Market Size and Forecast, 2012-2026
4.2.2.1 Revenue (US$ Mn) Comparison, By Region
4.2.2.2 Market Share Comparison, By Region
4.2.2.3 Y-o-Y growth Comparison, By Region
4.3 Global Orthopedic Digit Implants Market Size and Forecast by Material, 2012-2026
4.3.1 Nitinol Market Size and Forecast, 2012-2026
4.3.1.1 Revenue (US$ Mn) Comparison, By Region
4.3.1.2 Market Share Comparison, By Region
4.3.1.3 Y-o-Y growth Comparison, By Region
4.3.2 Silicon Pyrocarbon Market Size and Forecast, 2012-2026
4.3.2.1 Revenue (US$ Mn) Comparison, By Region
4.3.2.2 Market Share Comparison, By Region
4.3.2.3 Y-o-Y growth Comparison, By Region
4.3.3 Titanium Market Size and Forecast, 2012-2026
4.3.3.1 Revenue (US$ Mn) Comparison, By Region
4.3.3.2 Market Share Comparison, By Region
4.3.3.3 Y-o-Y growth Comparison, By Region
4.3.4 Others Market Size and Forecast, 2012-2026
4.3.4.1 Revenue (US$ Mn) Comparison, By Region
4.3.4.2 Market Share Comparison, By Region
4.3.4.3 Y-o-Y growth Comparison, By Region
Chapter 5 North America Orthopedic Digit Implants Market Size and Forecast, 2012-2026
5.1 North America Market Outlook
5.2 Revenue (US$ Mn) Comparison, By Country
5.3 Revenue (US$ Mn) Comparison, By Product Type
5.4 Revenue (US$ Mn) Comparison, By End User
5.5 Revenue (US$ Mn) Comparison, By Material
Chapter 6 Latin America Orthopedic Digit Implants Market Size and Forecast, 2012-2026
6.1 Latin America Market Outlook
6.2 Revenue (US$ Mn) Comparison, By Country
6.3 Revenue (US$ Mn) Comparison, By Product Type
6.4 Revenue (US$ Mn) Comparison, By End User
6.5 Revenue (US$ Mn) Comparison, By Material
Chapter 7 Europe Orthopedic Digit Implants Market Size and Forecast, 2012-2026
7.1 Europe Market Outlook
7.2 Revenue (US$ Mn) Comparison, By Country
7.3 Revenue (US$ Mn) Comparison, By Product Type
7.4 Revenue (US$ Mn) Comparison, By End User
7.5 Revenue (US$ Mn) Comparison, By Material
Chapter 8 Japan Orthopedic Digit Implants Market Size and Forecast, 2012-2026
8.1 Japan Market Outlook
8.2 Revenue (US$ Mn) Comparison, By Country
8.3 Revenue (US$ Mn) Comparison, By Product Type
8.4 Revenue (US$ Mn) Comparison, By End User
8.5 Revenue (US$ Mn) Comparison, By Material
Chapter 9 APEJ Orthopedic Digit Implants Market Size and Forecast, 2012-2026
9.1 APEJ Market Outlook
9.2 Revenue (US$ Mn) Comparison, By Country
9.3 Revenue (US$ Mn) Comparison, By Product Type
9.4 Revenue (US$ Mn) Comparison, By End User
9.5 Revenue (US$ Mn) Comparison, By Material
Chapter 10 MEA Orthopedic Digit Implants Market Size and Forecast, 2012-2026
10.1 MEA Market Outlook
10.2 Revenue (US$ Mn) Comparison, By Country
10.3 Revenue (US$ Mn) Comparison, By Product Type
10.4 Revenue (US$ Mn) Comparison, By End User
Chapter 11 Global Orthopedic Digit Implants Market – Competitive Landscape and Company Profiles
11.1 Global Orthopedic Digit Implants Market – Company Share Analysis
11.2 Global Orthopedic Digit Implants Market – Competitive Landscape
11.3 Global Orthopedic Digit Implants Market – Company Profiles
11.3.1 Wright Medical Group N.V.
11.3.1.1 Company Overview
11.3.1.2 Product Overview
11.3.1.3 Key Developments
11.3.1.4 SWOT Analysis
11.3.2 Integra Lifesciences Holdings Corporation
11.3.2.1 Company Overview
11.3.2.2 Product Overview
11.3.2.3 Key Financials
11.3.2.4 Key Developments
11.3.2.5 SWOT Analysis
11.3.3 Teijin Nakashima Medical Co., Ltd.
11.3.3.1 Company Overview
11.3.3.2 Product Overview
11.3.4 Stryker Corporation
11.3.4.1 Company Overview
11.3.4.2 Product Overview
11.3.4.3 Key Financials
11.3.4.4 Key Developments
11.3.4.5 SWOT Analysis
11.3.5 Johnson & Johnson
11.3.5.1 Company Overview
11.3.5.2 Product Overview
11.3.5.3 Key Financials
11.3.5.4 Key Developments
11.3.5.5 SWOT Analysis
11.3.6 Vilex In Tennessee, Inc.
11.3.6.1 Company Overview
11.3.6.2 Product Overview
11.3.7 Merete Medical GmbH
11.3.7.1 Company Overview
11.3.7.2 Product Overview
11.3.8 Zimmer Biomet Holdings, Inc
11.3.8.1 Company Overview
11.3.8.2 Product Overview
11.3.8.3 Key Financials
11.3.8.4 Key Developments
11.3.8.5 SWOT Analysis
11.3.9 Acumed LLC
11.3.9.1 Company Overview
11.3.9.2 Product Overview
11.4 Key Takeaways – Orthopedic Digit Implants Market
Chapter 12 TMR Research Methodology
Chapter 13 Disclaimer and Contact information
List of Tables
TABLE 1 Global Orthopedic Digit Implants Market Value (US$ Mn), 2012-2017
TABLE 2 Global Orthopedic Digit Implants Market Value (US$ Mn), 2018-2026
TABLE 3 Global Orthopedic Digit Implants Market Value (US$ Mn) and Y-o-Y, 2017-2026
TABLE 4 Global Metacarpal Joint Implants (Upper extremity) Segment Value (US$ Mn), By Region 2012-2017
TABLE 5 Global Metacarpal Joint Implants (Upper extremity) Segment Value (US$ Mn), By Region 2018-2026
TABLE 6 Global Metacarpal Joint Implants (Upper extremity) Segment Market Share, By Region 2012-2017
TABLE 7 Global Metacarpal Joint Implants (Upper extremity) Segment Market Share, By Region 2018-2026
TABLE 8 Global Metacarpal Joint Implants (Upper extremity) Segment Y-o-Y, By Region 2017-2026
TABLE 9 Global Metatarsal Joint Implants (Lower extremity) Segment Value (US$ Mn), By Region 2012-2017
TABLE 10 Global Metatarsal Joint Implants (Lower extremity) Segment Value (US$ Mn), By Region 2018-2026
TABLE 11 Global Metatarsal Joint Implants (Lower extremity) Segment Market Share, By Region 2012-2017
TABLE 12 Global Metatarsal Joint Implants (Lower extremity) Segment Market Share, By Region 2018-2026
TABLE 13 Global Metatarsal Joint Implants (Lower extremity) Segment Y-o-Y, By Region 2017-2026
TABLE 14 Global Hemi Phalangeal Implants Segment Value (US$ Mn), By Region 2012-2017
TABLE 15 Global Hemi Phalangeal Implants Segment Value (US$ Mn), By Region 2018-2026
TABLE 16 Global Hemi Phalangeal Implants Segment Market Share, By Region 2012-2017
TABLE 17 Global Hemi Phalangeal Implants Segment Market Share, By Region 2018-2026
TABLE 18 Global Hemi Phalangeal Implants Segment Y-o-Y, By Region 2017-2026
TABLE 19 Global Scaphoid Bone Implants Segment Value (US$ Mn), By Region 2012-2017
TABLE 20 Global Scaphoid Bone Implants Segment Value (US$ Mn), By Region 2018-2026
TABLE 21 Global Scaphoid Bone Implants Segment Market Share, By Region 2012-2017
TABLE 22 Global Scaphoid Bone Implants Segment Market Share, By Region 2018-2026
TABLE 23 Global Scaphoid Bone Implants Segment Y-o-Y, By Region 2017-2026
TABLE 24 Global Toe Intramedullary Implants Segment Value (US$ Mn), By Region 2012-2017
TABLE 25 Global Toe Intramedullary Implants Segment Value (US$ Mn), By Region 2018-2026
TABLE 26 Global Toe Intramedullary Implants Segment Market Share, By Region 2012-2017
TABLE 27 Global Toe Intramedullary Implants Segment Market Share, By Region 2018-2026
TABLE 28 Global Toe Intramedullary Implants Segment Y-o-Y, By Region 2017-2026
TABLE 29 Global Hospitals Segment Value (US$ Mn), By Region 2012-2017
TABLE 30 Global Hospitals Segment Value (US$ Mn), By Region 2018-2026
TABLE 31 Global Hospitals Segment Market Share, By Region 2012-2017
TABLE 32 Global Hospitals Segment Market Share, By Region 2018-2026
TABLE 33 Global Hospitals Segment Y-o-Y, By Region 2017-2026
TABLE 34 Global Specialty Orthopedic Clinics Segment Value (US$ Mn), By Region 2012-2017
TABLE 35 Global Specialty Orthopedic Clinics Segment Value (US$ Mn), By Region 2018-2026
TABLE 36 Global Specialty Orthopedic Clinics Segment Market Share, By Region 2012-2017
TABLE 37 Global Specialty Orthopedic Clinics Segment Market Share, By Region 2018-2026
TABLE 38 Global Specialty Orthopedic Clinics Segment Y-o-Y, By Region 2017-2026
TABLE 39 Global Nitinol Segment Value (US$ Mn), By Region 2012-2017
TABLE 40 Global Nitinol Segment Value (US$ Mn), By Region 2018-2026
TABLE 41 Global Nitinol Segment Market Share, By Region 2012-2017
TABLE 42 Global Nitinol Segment Market Share, By Region 2018-2026
TABLE 43 Global Nitinol Segment Y-o-Y, By Region 2017-2026
TABLE 44 Global Silicon Pyrocarbon Segment Value (US$ Mn), By Region 2012-2017
TABLE 45 Global Silicon Pyrocarbon Segment Value (US$ Mn), By Region 2018-2026
TABLE 46 Global Silicon Pyrocarbon Segment Market Share, By Region 2012-2017
TABLE 47 Global Silicon Pyrocarbon Segment Market Share, By Region 2018-2026
TABLE 48 Global Silicon Pyrocarbon Segment Y-o-Y, By Region 2017-2026
TABLE 49 Global Titanium Segment Value (US$ Mn), By Region 2012-2017
TABLE 50 Global Titanium Segment Value (US$ Mn), By Region 2018-2026
TABLE 51 Global Titanium Segment Market Share, By Region 2012-2017
TABLE 52 Global Titanium Segment Market Share, By Region 2018-2026
TABLE 53 Global Titanium Segment Y-o-Y, By Region 2017-2026
TABLE 54 Global Others Segment Value (US$ Mn), By Region 2012-2017
TABLE 55 Global Others Segment Value (US$ Mn), By Region 2018-2026
TABLE 56 Global Others Segment Market Share, By Region 2012-2017
TABLE 57 Global Others Segment Market Share, By Region 2018-2026
TABLE 58 Global Others Segment Y-o-Y, By Region 2017-2026
TABLE 59 North America Current Expenditure on Health, (% of GDP), by Country, 2010 – 2016
TABLE 60 North America Per Capita Health Expenditure (US$ PPP), by Country, 2010 - 2016
TABLE 61 North America Per Capita Healthcare Expenditure Y-o-Y Growth (in Real terms %), by Country, 2010 - 2016
TABLE 62 North America Out-of-Pocket Healthcare Expenditure, % of Healthcare Expenditure, by Country, 2010 - 2016
TABLE 63 North America Per Capita Healthcare Expenditure (at Current Price, in US$), by Country, 2010 - 2016
TABLE 64 North America Orthopedic Digit Implants Market Value (US$ Mn), By Country 2012-2017
TABLE 65 North America Orthopedic Digit Implants Market Value (US$ Mn), By Country 2018-2026
TABLE 66 North America Orthopedic Digit Implants Market Value (US$ Mn), By Product Type 2012-2017
TABLE 67 North America Orthopedic Digit Implants Market Value (US$ Mn), By Product Type 2018-2026
TABLE 68 North America Orthopedic Digit Implants Market Value (US$ Mn), By End User 2012-2017
TABLE 69 North America Orthopedic Digit Implants Market Value (US$ Mn), By End User 2018-2026
TABLE 70 North America Orthopedic Digit Implants Market Value (US$ Mn), By Material 2012-2017
TABLE 71 North America Orthopedic Digit Implants Market Value (US$ Mn), By Material 2018-2026
TABLE 72 Latin America Current Expenditure on Health, (% of GDP), by Country, 2010 – 2016
TABLE 73 Latin America Per Capita Health Expenditure (US$ PPP), by Country, 2010 - 2016
TABLE 74 Latin America Per Capita Healthcare Expenditure Y-o-Y Growth (in Real terms %), by Country, 2010 - 2016
TABLE 75 Latin America Out-of-Pocket Healthcare Expenditure, % of Healthcare Expenditure, by Country, 2010 - 2016
TABLE 76 Latin America Per Capita Healthcare Expenditure (at Current Price, in US$), by Country, 2010 - 2016
TABLE 77 Latin America Orthopedic Digit Implants Market Value (US$ Mn), By Country 2012-2017
TABLE 78 Latin America Orthopedic Digit Implants Market Value (US$ Mn), By Country 2018-2026
TABLE 79 Latin America Orthopedic Digit Implants Market Value (US$ Mn), By Product Type 2012-2017
TABLE 80 Latin America Orthopedic Digit Implants Market Value (US$ Mn), By Product Type 2018-2026
TABLE 81 Latin America Orthopedic Digit Implants Market Value (US$ Mn), By End User 2012-2017
TABLE 82 Latin America Orthopedic Digit Implants Market Value (US$ Mn), By End User 2018-2026
TABLE 83 Latin America Orthopedic Digit Implants Market Value (US$ Mn), By Material 2012-2017
TABLE 84 Latin America Orthopedic Digit Implants Market Value (US$ Mn), By Material 2018-2026
TABLE 85 Europe Current Expenditure on Health, (% of GDP), by Country, 2010 – 2016
TABLE 86 Europe Per Capita Health Expenditure (US$ PPP), by Country, 2010 - 2016
TABLE 87 Europe Per Capita Healthcare Expenditure Y-o-Y Growth (in Real terms %), by Country, 2010 - 2016
TABLE 88 Europe Out-of-Pocket Healthcare Expenditure, % of Healthcare Expenditure, by Country, 2010 - 2016
TABLE 89 Europe Per Capita Healthcare Expenditure (at Current Price, in US$), by Country, 2010 - 2016
TABLE 90 Europe Orthopedic Digit Implants Market Value (US$ Mn), By Country 2012-2017
TABLE 91 Europe Orthopedic Digit Implants Market Value (US$ Mn), By Country 2018-2026
TABLE 92 Europe Orthopedic Digit Implants Market Value (US$ Mn), By Product Type 2012-2017
TABLE 93 Europe Orthopedic Digit Implants Market Value (US$ Mn), By Product Type 2018-2026
TABLE 94 Europe Orthopedic Digit Implants Market Value (US$ Mn), By End User 2012-2017
TABLE 95 Europe Orthopedic Digit Implants Market Value (US$ Mn), By End User 2018-2026
TABLE 96 Europe Orthopedic Digit Implants Market Value (US$ Mn), By Material 2012-2017
TABLE 97 Europe Orthopedic Digit Implants Market Value (US$ Mn), By Material 2018-2026
TABLE 98 Japan Current Expenditure on Health, (% of GDP), by Country, 2010 – 2016
TABLE 99 Japan Per Capita Health Expenditure (US$ PPP), by Country, 2010 - 2016
TABLE 100 Japan Per Capita Healthcare Expenditure Y-o-Y Growth (in Real terms %), by Country, 2010 - 2016
TABLE 101 Japan Out-of-Pocket Healthcare Expenditure, % of Healthcare Expenditure, by Country, 2010 - 2016
TABLE 102 Japan Per Capita Healthcare Expenditure (at Current Price, in US$), by Country, 2010 - 2016
TABLE 103 Japan Orthopedic Digit Implants Market Value (US$ Mn), By Country 2012-2017
TABLE 104 Japan Orthopedic Digit Implants Market Value (US$ Mn), By Country 2018-2026
TABLE 105 Japan Orthopedic Digit Implants Market Value (US$ Mn), By Product Type 2012-2017
TABLE 106 Japan Orthopedic Digit Implants Market Value (US$ Mn), By Product Type 2018-2026
TABLE 107 Japan Orthopedic Digit Implants Market Value (US$ Mn), By End User 2012-2017
TABLE 108 Japan Orthopedic Digit Implants Market Value (US$ Mn), By End User 2018-2026
TABLE 109 Japan Orthopedic Digit Implants Market Value (US$ Mn), By Material 2012-2017
TABLE 110 Japan Orthopedic Digit Implants Market Value (US$ Mn), By Material 2018-2026
TABLE 111 APEJ Current Expenditure on Health, (% of GDP), by Country, 2010 – 2016
TABLE 112 APEJ Per Capita Health Expenditure (US$ PPP), by Country, 2010 - 2016
TABLE 113 APEJ Per Capita Healthcare Expenditure Y-o-Y Growth (in Real terms %), by Country, 2010 - 2016
TABLE 114 APEJ Out-of-Pocket Healthcare Expenditure, % of Healthcare Expenditure, by Country, 2010 - 2016
TABLE 115 APEJ Per Capita Healthcare Expenditure (at Current Price, in US$), by Country, 2010 - 2016
TABLE 116 APEJ Orthopedic Digit Implants Market Value (US$ Mn), By Country 2012-2017
TABLE 117 APEJ Orthopedic Digit Implants Market Value (US$ Mn), By Country 2018-2026
TABLE 118 APEJ Orthopedic Digit Implants Market Value (US$ Mn), By Product Type 2012-2017
TABLE 119 APEJ Orthopedic Digit Implants Market Value (US$ Mn), By Product Type 2018-2026
TABLE 120 APEJ Orthopedic Digit Implants Market Value (US$ Mn), By End User 2012-2017
TABLE 121 APEJ Orthopedic Digit Implants Market Value (US$ Mn), By End User 2018-2026
TABLE 122 APEJ Orthopedic Digit Implants Market Value (US$ Mn), By Material 2012-2017
TABLE 123 APEJ Orthopedic Digit Implants Market Value (US$ Mn), By Material 2018-2026
TABLE 124 MEA Current Expenditure on Health, (% of GDP), by Country, 2010 – 2016
TABLE 125 MEA Per Capita Health Expenditure (US$ PPP), by Country, 2010 - 2016
TABLE 126 MEA Per Capita Healthcare Expenditure Y-o-Y Growth (in Real terms %), by Country, 2010 - 2016
TABLE 127 MEA Out-of-Pocket Healthcare Expenditure, % of Healthcare Expenditure, by Country, 2010 - 2016
TABLE 128 MEA Per Capita Healthcare Expenditure (at Current Price, in US$), by Country, 2010 - 2016
TABLE 129 MEA Orthopedic Digit Implants Market Value (US$ Mn), By Country 2012-2017
TABLE 130 MEA Orthopedic Digit Implants Market Value (US$ Mn), By Country 2018-2026
TABLE 131 MEA Orthopedic Digit Implants Market Value (US$ Mn), By Product Type 2012-2017
TABLE 132 MEA Orthopedic Digit Implants Market Value (US$ Mn), By Product Type 2018-2026
TABLE 133 MEA Orthopedic Digit Implants Market Value (US$ Mn), By End User 2012-2017
TABLE 134 MEA Orthopedic Digit Implants Market Value (US$ Mn), By End User 2018-2026
TABLE 135 MEA Orthopedic Digit Implants Market Value (US$ Mn), By Material 2012-2017
TABLE 136 MEA Orthopedic Digit Implants Market Value (US$ Mn), By Material 2018-2026
List of Figures
FIG. 1 Global Orthopedic Digit Implants Market Value (US$ Mn), 2012-2017
FIG. 2 Global Orthopedic Digit Implants Market Value (US$ Mn) Forecast, 2018-2026
FIG. 3 Global Orthopedic Digit Implants Market Value (US$ Mn) and Y-o-Y, 2017-2026
FIG. 4 Global Metacarpal Joint Implants (Upper extremity) Segment Market Value (US$ Mn) By Region, 2012-2017
FIG. 5 Global Metacarpal Joint Implants (Upper extremity) Segment Market Value (US$ Mn) By Region, 2018-2026
FIG. 6 Global Metacarpal Joint Implants (Upper extremity) Segment Y-o-Y Growth Rate, By Region, 2017-2026
FIG. 7 Global Metatarsal Joint Implants (Lower extremity) Segment Market Value (US$ Mn) By Region, 2012-2017
FIG. 8 Global Metatarsal Joint Implants (Lower extremity) Segment Market Value (US$ Mn) By Region, 2018-2026
FIG. 9 Global Metatarsal Joint Implants (Lower extremity) Segment Y-o-Y Growth Rate, By Region, 2017-2026
FIG. 10 Global Hemi Phalangeal Implants Segment Market Value (US$ Mn) By Region, 2012-2017
FIG. 11 Global Hemi Phalangeal Implants Segment Market Value (US$ Mn) By Region, 2018-2026
FIG. 12 Global Hemi Phalangeal Implants Segment Y-o-Y Growth Rate, By Region, 2017-2026
FIG. 13 Global Scaphoid Bone Implants Segment Market Value (US$ Mn) By Region, 2012-2017
FIG. 14 Global Scaphoid Bone Implants Segment Market Value (US$ Mn) By Region, 2018-2026
FIG. 15 Global Scaphoid Bone Implants Segment Y-o-Y Growth Rate, By Region, 2017-2026
FIG. 16 Global Toe Intramedullary Implants Segment Market Value (US$ Mn) By Region, 2012-2017
FIG. 17 Global Toe Intramedullary Implants Segment Market Value (US$ Mn) By Region, 2018-2026
FIG. 18 Global Toe Intramedullary Implants Segment Y-o-Y Growth Rate, By Region, 2017-2026
FIG. 19 Global Hospitals Segment Market Value (US$ Mn) By Region, 2012-2017
FIG. 20 Global Hospitals Segment Market Value (US$ Mn) By Region, 2018-2026
FIG. 21 Global Hospitals Segment Y-o-Y Growth Rate, By Region, 2017-2026
FIG. 22 Global Specialty Orthopedic Clinics Segment Market Value (US$ Mn) By Region, 2012-2017
FIG. 23 Global Specialty Orthopedic Clinics Segment Market Value (US$ Mn) By Region, 2018-2026
FIG. 24 Global Specialty Orthopedic Clinics Segment Y-o-Y Growth Rate, By Region, 2017-2026
FIG. 25 Global Nitinol Segment Market Value (US$ Mn) By Region, 2012-2017
FIG. 26 Global Nitinol Segment Market Value (US$ Mn) By Region, 2018-2026
FIG. 27 Global Nitinol Segment Y-o-Y Growth Rate, By Region, 2017-2026
FIG. 28 Global Silicon Pyrocarbon Segment Market Value (US$ Mn) By Region, 2012-2017
FIG. 29 Global Silicon Pyrocarbon Segment Market Value (US$ Mn) By Region, 2018-2026
FIG. 30 Global Silicon Pyrocarbon Segment Y-o-Y Growth Rate, By Region, 2017-2026
FIG. 31 Global Titanium Segment Market Value (US$ Mn) By Region, 2012-2017
FIG. 32 Global Titanium Segment Market Value (US$ Mn) By Region, 2018-2026
FIG. 33 Global Titanium Segment Y-o-Y Growth Rate, By Region, 2017-2026
FIG. 34 Global Others Segment Market Value (US$ Mn) By Region, 2012-2017
FIG. 35 Global Others Segment Market Value (US$ Mn) By Region, 2018-2026
FIG. 36 Global Others Segment Y-o-Y Growth Rate, By Region, 2017-2026
FIG. 37 North America Orthopedic Digit Implants Market Value (US$ Mn), By Country 2012-2017
FIG. 38 North America Orthopedic Digit Implants Market Value (US$ Mn), By Country 2018-2026
FIG. 39 North America Orthopedic Digit Implants Market Value (US$ Mn), By Product Type 2012-2017
FIG. 40 North America Orthopedic Digit Implants Market Value (US$ Mn), By Product Type 2018-2026
FIG. 41 North America Orthopedic Digit Implants Market Value (US$ Mn), By End User 2012-2017
FIG. 42 North America Orthopedic Digit Implants Market Value (US$ Mn), By End User 2018-2026
FIG. 43 North America Orthopedic Digit Implants Market Value (US$ Mn), By Material 2012-2017
FIG. 44 North America Orthopedic Digit Implants Market Value (US$ Mn), By Material 2018-2026
FIG. 45 Latin America Orthopedic Digit Implants Market Value (US$ Mn), By Country 2012-2017
FIG. 46 Latin America Orthopedic Digit Implants Market Value (US$ Mn), By Country 2018-2026
FIG. 47 Latin America Orthopedic Digit Implants Market Value (US$ Mn), By Product Type 2012-2017
FIG. 48 Latin America Orthopedic Digit Implants Market Value (US$ Mn), By Product Type 2018-2026
FIG. 49 Latin America Orthopedic Digit Implants Market Value (US$ Mn), By End User 2012-2017
FIG. 50 Latin America Orthopedic Digit Implants Market Value (US$ Mn), By End User 2018-2026
FIG. 51 Latin America Orthopedic Digit Implants Market Value (US$ Mn), By Material 2012-2017
FIG. 52 Latin America Orthopedic Digit Implants Market Value (US$ Mn), By Material 2018-2026
FIG. 53 Europe Orthopedic Digit Implants Market Value (US$ Mn), By Country 2012-2017
FIG. 54 Europe Orthopedic Digit Implants Market Value (US$ Mn), By Country 2018-2026
FIG. 55 Europe Orthopedic Digit Implants Market Value (US$ Mn), By Product Type 2012-2017
FIG. 56 Europe Orthopedic Digit Implants Market Value (US$ Mn), By Product Type 2018-2026
FIG. 57 Europe Orthopedic Digit Implants Market Value (US$ Mn), By End User 2012-2017
FIG. 58 Europe Orthopedic Digit Implants Market Value (US$ Mn), By End User 2018-2026
FIG. 59 Europe Orthopedic Digit Implants Market Value (US$ Mn), By Material 2012-2017
FIG. 60 Europe Orthopedic Digit Implants Market Value (US$ Mn), By Material 2018-2026
FIG. 61 Japan Orthopedic Digit Implants Market Value (US$ Mn), By Country 2012-2017
FIG. 62 Japan Orthopedic Digit Implants Market Value (US$ Mn), By Country 2018-2026
FIG. 63 Japan Orthopedic Digit Implants Market Value (US$ Mn), By Product Type 2012-2017
FIG. 64 Japan Orthopedic Digit Implants Market Value (US$ Mn), By Product Type 2018-2026
FIG. 65 Japan Orthopedic Digit Implants Market Value (US$ Mn), By Material 2012-2017
FIG. 66 Japan Orthopedic Digit Implants Market Value (US$ Mn), By End User 2018-2026
FIG. 67 Japan Orthopedic Digit Implants Market Value (US$ Mn), By Material 2012-2017
FIG. 68 Japan Orthopedic Digit Implants Market Value (US$ Mn), By Material 2018-2026
FIG. 69 APEJ Orthopedic Digit Implants Market Value (US$ Mn), By Country 2012-2017
FIG. 70 APEJ Orthopedic Digit Implants Market Value (US$ Mn), By Country 2018-2026
FIG. 71 APEJ Orthopedic Digit Implants Market Value (US$ Mn), By Product Type 2012-2017
FIG. 72 APEJ Orthopedic Digit Implants Market Value (US$ Mn), By Product Type 2018-2026
FIG. 73 APEJ Orthopedic Digit Implants Market Value (US$ Mn), By End User 2012-2017
FIG. 74 APEJ Orthopedic Digit Implants Market Value (US$ Mn), By End User 2018-2026
FIG. 75 APEJ Orthopedic Digit Implants Market Value (US$ Mn), By Material 2012-2017
FIG. 76 APEJ Orthopedic Digit Implants Market Value (US$ Mn), By Material 2018-2026
FIG. 77 MEA Orthopedic Digit Implants Market Value (US$ Mn), By Country 2012-2017
FIG. 78 MEA Orthopedic Digit Implants Market Value (US$ Mn), By Country 2018-2026
FIG. 79 MEA Orthopedic Digit Implants Market Value (US$ Mn), By Product Type 2012-2017
FIG. 80 MEA Orthopedic Digit Implants Market Value (US$ Mn), By Product Type 2018-2026
FIG. 81 MEA Orthopedic Digit Implants Market Value (US$ Mn), By End User 2012-2017
FIG. 82 MEA Orthopedic Digit Implants Market Value (US$ Mn), By End User 2018-2026
FIG. 83 MEA Orthopedic Digit Implants Market Value (US$ Mn), By Material 2012-2017
FIG. 84 MEA Orthopedic Digit Implants Market Value (US$ Mn), By Material 2018-2026
Copyright © Transparency Market Research, Inc. All Rights reserved
Trust Online

Orthopedic Digit Implants Market