
Reports
Reports
The oil & gas sector has witnessed significant transformation in the past few years and is showing no signs of slowing down in that regard. The oil & gas industry has successfully negotiated its way through the slump in crude oil prices post 2014-2015. While the oil & gas sector continued to make strides, oil & gas EPC market has witnessed significant development as well. Stakeholders in the oil & gas EPC market are focusing on improving break-even points, adoption of newer technologies, and fulfilling the growing demand for energy worldwide.
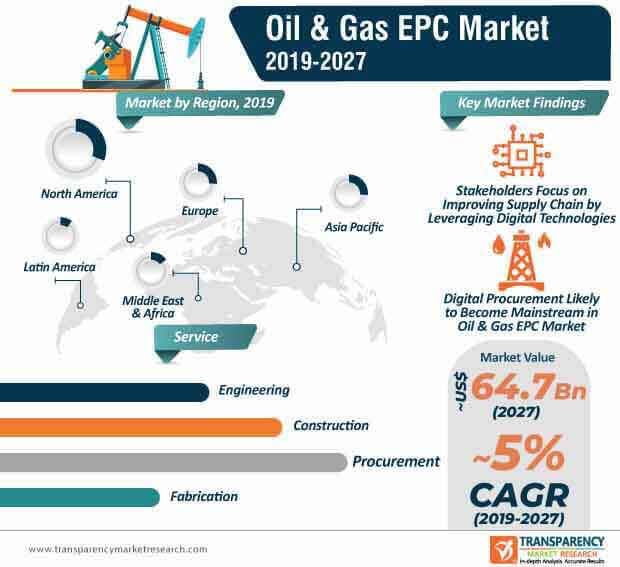
The last couple of years witnessed significant growth in the number of onshore and offshore oil & gas activities. Offshore project sanctioning is expected to gain significant momentum during the forecast period (2019-2027) and is on course to generate record-high revenues. Moreover, engineering and procurement projects are set to present a plethora of opportunities for stakeholders involved in the oil & gas EPC market. Market participants are expected to leverage advanced technologies to improve supply-demand and formulate impactful business models, as the energy sector continues to evolve. Due to these factors, the oil & gas EPC market is expected to reach a value of ~US$ 64.7 Bn by the end of 2027.
The growth of the oil & gas sector is marred by a host of unpredictable and volatile factors, including economic and geopolitical uncertainties, evolving global markets, regulatory limitations, etc. These factors have played a key role in persuading stakeholders in the oil & gas EPC market to adopt a dynamic approach for their processes and operations. In the current scenario, oil & gas EPC companies are seeking solutions to address a range of challenges, including dwindling fuel consumption, growing adoption of electric vehicles, stringent regulatory and environmental policies, snowballing costs of upstream and exploration projects, etc.
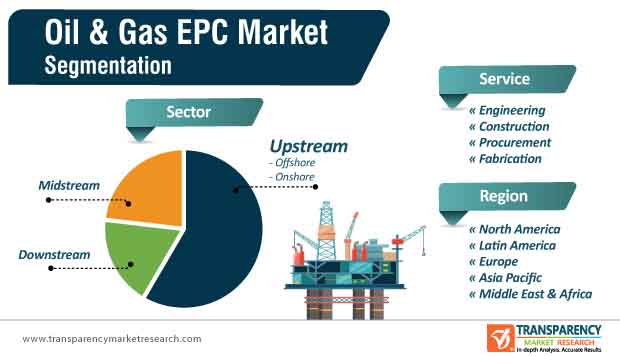
Companies in the current market landscape are focusing on building effective procurement strategies that will assist them in saving costs, improving supplier relationships, enhancing spending efficiency, and simultaneously dealing with risks involved in supply chain. While upstream businesses are no stranger to cost-reduction tactics, at the back of the mounting environmental concerns, market players are leveraging the benefits of digital technologies and finding new sustainable growth avenues. The upstream sector segment is projected to reach a value of ~US$ 26.1 Bn and account for ~ 58% share of the oil & gas EPC market in 2020.
Within the oil & gas EPC market, stakeholders are aiming to expand their market share and values by turning toward organic and inorganic strategies. While some stakeholders are launching new oil & gas networks, others are tapping into opportunities presented by offshore and onshore projects. For instance, in August 2019, Achilles launched a new oil & gas supplier network for the European region in which around 6,000 suppliers were integrated into a single supply chain. The adoption of such digital technologies is expected to play an important role in improving the supply chain of all oil & gas companies in the European region.
In September 2018, Adnoc awarded a ~US$ 860 Mn contract for the expansion of a gas development project. As per the agreement, Adnoc LNG, a subsidiary of the Abu Dhabi National Oil Company, awarded the contract to Target Engineering Construction Company and Tecnicas Reunidas for the provision of construction, procurement, and engineering services for phase two of the Integrated Gas Development Expansion project. As per the agreement, the two companies will manage equipment & material supply, installation, construction, engineering, drying, and an array of other auxiliary services. The rise of digital technologies has paved the way for digital procurement in the oil & gas EPC market in recent years, and the trend is projected to continue particularly in the Middle East & Africa and the Asia Pacific. While stakeholders in the oil & gas sector continue to find alternatives to streamline their supply chain, digital procurement solutions have emerged as an ideal candidate to address these problems.
Analysts’ Viewpoint
The oil & gas EPC market is expected to grow at a CAGR of ~5% during the forecast period. Some of the key factors that are expected to influence growth include rise in the number of offshore and onshore projects, technological advancements, project sanctioning, and growing focus on improving the supply chain. Digital technologies will play a key role in improving supply chain performance and mitigate the risks involved in the supply chain. Digital procurement is likely to gain significant popularity during the forecast period, as more number of companies are leaning toward digital technologies to strengthen their foothold in the oil & gas EPC market.
Oil & Gas EPC Market: Overview
Rise in Deepwater E&P Activities to Drive Oil & Gas EPC Market
Volatility in Prices of Crude Oil to Hamper Oil & Gas EPC Market
Large Number of Proven Oil & Gas Reserves to Offer Lucrative Opportunities to Oil & Gas EPC Market
Recent Developments, Expansions, Acquisitions, and New Contracts
North America to Dominate Oil & Gas EPC Market
Oil & Gas EPC Market Highly Competitive
Oil & Gas EPC Market is projected to reach US$ 64.7 Bn by the end of 2027
Oil & Gas EPC Market is expected to grow at a CAGR of 5% during 2019 – 2027
Rise in Deepwater E&P Activities is anticipated to propel the oil & gas EPC market in the near future
North America is a more attractive region for vendors in the Oil & Gas EPC Market
Key vendors in the Oil & Gas EPC Market are TechnipFMC, Plc., WorleyParsons Limited, Saipem SpA, Petrofac Limited, Bechtel Corporation, Mott MacDonald, Fluor Corporation, L&T Hydrocarbon Engineering, etc
1. Preface
1.1. Report Scope and Market Segmentation
1.2. Research Highlights
2. Assumptions and Research Methodology
2.1. Assumptions and Acronyms Used
2.2. Research Methodology
3. Executive Summary: Global Oil & Gas Market
3.1. Market Snapshot
3.2. Top Two Trends
4. Market Overview
4.1. Product Overview
4.2. Key Market Developments
4.3. Market Indicators
5. Market Dynamics
5.1. Drivers and Restraints Snapshot Analysis
5.1.1. Drivers
5.1.2. Restraints
5.1.3. Opportunities
5.2. Porter’s Five Forces Analysis
5.2.1. Threat of Substitutes
5.2.2. Bargaining Power of Buyers
5.2.3. Bargaining Power of Suppliers
5.2.4. Threat of New Entrants
5.2.5. Degree of Competition
5.3. Regulatory Scenario
5.4. Value Chain Analysis
5.4.1. List of Oil & Gas EPC Service Providers
6. Global Oil & Gas Market Value (US$ Mn) Analysis, by Sector
6.1. Key Findings and Introduction
6.2. Global Oil & Gas EPC Market Value (US$ Mn) Forecast, by Sector, 2018–2027
6.2.1. Global Oil & Gas EPC Market Value (US$ Mn) Forecast, by Upstream, 2018–2027
6.2.2. Global Oil & Gas EPC Market Value (US$ Mn) Forecast, by Midstream, 2018–2027
6.2.3. Global Oil & Gas EPC Market Value (US$ Mn) Forecast, by Downstream, 2018–2027
6.3. Global Oil & Gas EPC Market Attractiveness Analysis, by Sector
7. Global Oil & Gas EPC Market Value (US$ Mn) Analysis, by Service
7.1. Key Findings and Introduction
7.2. Global Oil & Gas EPC Market Value (US$ Mn) Forecast, by Service, 2018–2027
7.2.1. Global Oil & Gas EPC Market Value (US$ Mn) Forecast, by Engineering, 2018–2027
7.2.2. Global Oil & Gas EPC Market Value (US$ Mn) Forecast, by Procurement, 2018–2027
7.2.3. Global Oil & Gas EPC Market Value (US$ Mn) Forecast, by Construction, 2018–2027
7.2.4. Global Oil & Gas EPC Market Value (US$ Mn) Forecast, by Fabrication, 2018–2027
7.3. Global Oil & Gas EPC Market Attractiveness Analysis, by Service
8. Global Oil & Gas EPC Market Analysis, by Region
8.1. Key Findings
8.2. Global Oil & Gas EPC Market Value (US$ Mn) Forecast, by Region
8.2.1. North America
8.2.2. Europe
8.2.3. Asia Pacific
8.2.4. Middle East & Africa
8.2.5. Latin America
8.3. Global Oil & Gas EPC Market Attractiveness Analysis, by Region
9. North America Oil & Gas EPC Market Overview
9.1. Key Findings
9.2. Key Drivers
9.3. North America Oil & Gas EPC Market Value (US$ Mn) Forecast, by Sector, 2018–2027
9.4. North America Oil & Gas EPC Market Value (US$ Mn) Forecast, by Service, 2018–2027
9.5. North America Oil & Gas EPC Market Value (US$ Mn) Forecast, by Country
9.5.1. U.S. Oil & Gas EPC Market Value (US$ Mn) Forecast, by Sector, 2018–2027
9.5.2. U.S. Oil & Gas EPC Market Value (US$ Mn) Forecast, by Service, 2018–2027
9.5.3. Canada Oil & Gas EPC Market Value (US$ Mn) Forecast, by Sector, 2018–2027
9.5.4. Canada Oil & Gas EPC Market Value (US$ Mn) Forecast, by Service, 2018–2027
9.6. North America Oil & Gas EPC Market Attractiveness Analysis, by Sector
9.7. North America Oil & Gas EPC Market Attractiveness Analysis, by Service
9.8. North America Oil & Gas EPC Market Attractiveness Analysis, by Country
10. Europe Oil & Gas EPC Market Overview
10.1. Key Findings
10.2. Key Drivers
10.3. Europe Oil & Gas EPC Market Value (US$ Mn) Forecast, by Sector, 2018–2027
10.4. Europe Oil & Gas EPC Market Value (US$ Mn) Forecast, by Service, 2018–2027
10.5. Europe Oil & Gas EPC Market Value (US$ Mn) Forecast, by Country and Sub-region
10.5.1. Norway Oil & Gas EPC Market Value (US$ Mn) Forecast, by Sector, 2018–2027
10.5.2. Norway Oil & Gas EPC Market Value (US$ Mn) Forecast, by Service, 2018–2027
10.5.3. U.K. Oil & Gas EPC Market Value (US$ Mn) Forecast, by Sector, 2018–2027
10.5.4. U.K. Oil & Gas EPC Market Value (US$ Mn) Forecast, by Service, 2018–2027
10.5.5. Russia & CIS Oil & Gas EPC Market Value (US$ Mn) Forecast, by Sector, 2018–2027
10.5.6. Russia & CIS Oil & Gas EPC Market Value (US$ Mn) Forecast, by Service, 2018–2027
10.5.7. Rest of Europe Oil & Gas EPC Market Value (US$ Mn) Forecast, by Sector, 2018–2027
10.5.8. Rest of Europe Oil & Gas EPC Market Value (US$ Mn) Forecast, by Service, 2018–2027
10.6. Europe Oil & Gas EPC Market Attractiveness Analysis, by Sector
10.7. Europe Oil & Gas EPC Market Attractiveness Analysis, by Service
10.8. Europe Oil & Gas EPC Market Attractiveness Analysis, by Country and Sub-region
11. Asia Pacific Oil & Gas EPC Market Overview
11.1. Key Findings
11.2. Key Drivers
11.3. Asia Pacific Oil & Gas EPC Market Value (US$ Mn) Forecast, by Sector, 2018–2027
11.4. Asia Pacific Oil & Gas EPC Market Value (US$ Mn) Forecast, by Service, 2018–2027
11.5. Asia Pacific Oil & Gas EPC Market Value (US$ Mn) Forecast, by Country and Sub-region
11.5.1. China Oil & Gas EPC Market Value (US$ Mn) Forecast, by Sector, 2018–2027
11.5.2. China Oil & Gas EPC Market Value (US$ Mn) Forecast, by Service, 2018–2027
11.5.3. India Oil & Gas EPC Market Value (US$ Mn) Forecast, by Sector, 2018–2027
11.5.4. India Oil & Gas EPC Market Value (US$ Mn) Forecast, by Service, 2018–2027
11.5.5. Japan Oil & Gas EPC Market Value (US$ Mn) Forecast, by Sector, 2018–2027
11.5.6. Japan Oil & Gas EPC Market Value (US$ Mn) Forecast, by Service, 2018–2027
11.5.7. ASEAN Oil & Gas EPC Market Value (US$ Mn) Forecast, by Sector, 2018–2027
11.5.8. ASEAN Oil & Gas EPC Market Value (US$ Mn) Forecast, by Service, 2018–2027
11.5.9. Rest of Asia Pacific Oil & Gas EPC Market Value (US$ Mn) Forecast, by Sector, 2018–2027
11.5.10. Rest of Asia Pacific Oil & Gas EPC Market Value (US$ Mn) Forecast, by Service, 2018–2027
11.6. Asia Pacific Oil & Gas EPC Market Attractiveness Analysis, by Sector
11.7. Asia Pacific Oil & Gas EPC Market Attractiveness Analysis, by Service
11.8. Asia Pacific Oil & Gas EPC Market Attractiveness Analysis, by Country and Sub-region
12. Middle East & Africa Oil & Gas EPC Market Overview
12.1. Key Findings
12.2. Key Drivers
12.3. Middle East & Africa Oil & Gas EPC Market Value (US$ Mn) Forecast, by Sector, 2018–2027
12.4. Middle East & Africa Oil & Gas EPC Market Value (US$ Mn) Forecast, by Service, 2018–2027
12.5. Middle East & Africa Oil & Gas EPC Market Value (US$ Mn) Forecast, by Country and Sub-region
12.5.1. Saudi Arabia Oil & Gas EPC Market Value (US$ Mn) Forecast, by Sector, 2018–2027
12.5.2. Saudi Arabia Oil & Gas EPC Market Value (US$ Mn) Forecast, by Service, 2018–2027
12.5.3. UAE Oil & Gas EPC Market Value (US$ Mn) Forecast, by Sector, 2018–2027
12.5.4. UAE Oil & Gas EPC Market Value (US$ Mn) Forecast, by Service, 2018–2027
12.5.5. Oman Oil & Gas EPC Market Value (US$ Mn) Forecast, by Sector, 2018–2027
12.5.6. Oman Oil & Gas EPC Market Value (US$ Mn) Forecast, by Service, 2018–2027
12.5.7. Qatar Oil & Gas EPC Market Value (US$ Mn) Forecast, by Sector, 2018–2027
12.5.8. Qatar Oil & Gas EPC Market Value (US$ Mn) Forecast, by Service, 2018–2027
12.5.9. Kuwait Oil & Gas EPC Market Value (US$ Mn) Forecast, by Sector, 2018–2027
12.5.10. Kuwait Oil & Gas EPC Market Value (US$ Mn) Forecast, by Service, 2018–2027
12.5.11. Algeria Oil & Gas EPC Market Value (US$ Mn) Forecast, by Sector, 2018–2027
12.5.12. Algeria Oil & Gas EPC Market Value (US$ Mn) Forecast, by Service, 2018–2027
12.5.13. Nigeria Oil & Gas EPC Market Value (US$ Mn) Forecast, by Sector, 2018–2027
12.5.14. Nigeria Oil & Gas EPC Market Value (US$ Mn) Forecast, by Service, 2018–2027
12.5.15. Rest of Middle East & Africa Oil & Gas EPC Market Value (US$ Mn) Forecast, by Sector, 2018–2027
12.5.16. Rest of Middle East & Africa Oil & Gas EPC Market Value (US$ Mn) Forecast, by Service, 2018–2027
12.6. Middle East & Africa Oil & Gas EPC Market Attractiveness Analysis, by Sector
12.7. Middle East & Africa Oil & Gas EPC Market Attractiveness Analysis, by Service
12.8. Middle East & Africa Oil & Gas EPC Market Attractiveness Analysis, by Country and Sub-region
13. Latin America Oil & Gas EPC Market Overview
13.1. Key Findings
13.2. Key Drivers
13.3. Latin America Oil & Gas EPC Market Value (US$ Mn) Forecast, by Sector, 2018–2027
13.4. Latin America Oil & Gas EPC Market Value (US$ Mn) Forecast, by Service, 2018–2027
13.5. Latin America Oil & Gas EPC Market Value (US$ Mn) Forecast, by Country and Sub-region
13.5.1. Brazil Oil & Gas EPC Market Value (US$ Mn) Forecast, by Sector, 2018–2027
13.5.2. Brazil Oil & Gas EPC Market Value (US$ Mn) Forecast, by Service, 2018–2027
13.5.3. Mexico Oil & Gas EPC Market Value (US$ Mn) Forecast, by Sector, 2018–2027
13.5.4. Mexico Oil & Gas EPC Market Value (US$ Mn) Forecast, by Service, 2018–2027
13.5.5. Rest of Latin America Oil & Gas EPC Market Value (US$ Mn) Forecast, by Sector, 2018–2027
13.5.6. Rest of Latin America Oil & Gas EPC Market Value (US$ Mn) Forecast, by Service, 2018–2027
13.6. Latin America Oil & Gas EPC Market Attractiveness Analysis, by Sector
13.7. Latin America Oil & Gas EPC Market Attractiveness Analysis, by Service
13.8. Latin America Oil & Gas EPC Market Attractiveness Analysis, by Country and Sub-region
14. Competition Landscape
14.1. Global Oil & Gas EPC Market Share Analysis, by Company (2018)
14.2. Competition Matrix
14.2.1. Petrofac Limited
14.2.2. Saipem
14.3. Market Footprint Analysis, 2018
14.4. Company Profiles
14.4.1. TechnipFMC plc.
14.4.1.1. Company Details
14.4.1.2. Company Description
14.4.1.3. Business Overview
14.4.1.4. Strategic Overview/Recent Developments
14.4.2. WorleyParsons Limited
14.4.2.1. Company Details
14.4.2.2. Company Description
14.4.2.3. Business Overview
14.4.2.4. Strategic Overview/Recent Developments
14.4.3. Saipem SpA
14.4.3.1. Company Details
14.4.3.2. Company Description
14.4.3.3. Business Overview
14.4.3.4. Strategic Overview/Recent Developments
14.4.4. Petrofac Limited
14.4.4.1. Company Details
14.4.4.2. Company Description
14.4.4.3. Business Overview
14.4.4.4. Financial Details
14.4.4.5. Strategic Overview/Recent Developments
14.4.4. Bechtel Corporation
14.4.4.1. Company Details
14.4.4.2. Company Description
14.4.4.3. Business Overview
14.4.4.4. Strategic Overview/Recent Developments
14.4.5. Mott MacDonald
14.4.5.1. Company Details
14.4.5.2. Company Description
14.4.5.3. Business Overview
14.4.5.4. Strategic Overview/Recent Developments
14.4.6. Fluor Corporation
14.4.6.1. Company Details
14.4.6.2. Company Description
14.4.6.3. Business Overview
14.4.6.4. Strategic Overview/Recent Developments
14.4.7. L&T Hydrocarbon Engineering
14.4.7.1. Company Details
14.4.7.2. Company Description
14.4.7.3. Business Overview
14.4.8. John Wood Group PLC
14.4.8.1. Company Details
14.4.8.2. Company Description
14.4.8.3. Business Overview
14.4.8.4. Strategic Overview/Recent Developments
14.4.9. National Petroleum Construction Company
14.4.9.1. Company Details
14.4.9.2. Company Description
14.4.9.3. Business Overview
14.4.9.4. Financial Details
14.4.9.5. Strategic Overview/Recent Developments
14.4.10. SNC-Lavalin Group
14.4.10.1. Company Details
14.4.10.2. Company Description
14.4.10.3. Business Overview
14.4.10.4. Financial Details
14.4.10.5. Strategic Overview/Recent Developments
14.4.11. KBR, Inc.
14.4.11.1. Company Details
14.4.11.2. Company Description
14.4.11.3. Business Overview
14.4.11.4. Strategic Overview/Recent Development
14.4.12. JGC Holding Corporation
14.4.12.1. Company Details
14.4.12.2. Company Description
14.4.12.3. Business Overview
14.4.12.4. Strategic Overview/Recent Developments
14.4.13. Galfar Engineering and Contracting SAOG
14.4.13.1. Company Details
14.4.13.2. Company Description
14.4.13.3. Business Overview
14.4.13.4. Strategic Overview/Recent Developments
14.4.14. Lamprell
14.4.14.1. Company Details
14.4.14.2. Company Description
14.4.14.3. Business Overview
14.4.14.4. Strategic Overview/Recent Developments
List of Tables
Table 01: Global Oil & Gas EPC Market Value (US$ Mn) Forecast, by Sector, 2018–2027
Table 02: Global Oil & Gas EPC Market Value (US$ Mn) Forecast, by Service, 2018–2027
Table 03: Global Oil & Gas EPC Market Value (US$ Mn) Forecast, by Region, 2018–2027
Table 04: North America Oil & Gas EPC Market Value (US$ Mn) Forecast, by Sector, 2018–2027
Table 05: North America Oil & Gas EPC Market Value (US$ Mn) Forecast, by Service, 2018–2027
Table 06: North America Oil & Gas EPC Market Value (US$ Mn) Forecast, by Country, 2018–2027
Table 07: U.S. Oil & Gas EPC Market Value (US$ Mn) Forecast, by Sector, 2018–2027
Table 08: U.S. Oil & Gas EPC Market Value (US$ Mn) Forecast, by Service, 2018–2027
Table 09: Canada Oil & Gas EPC Market Value (US$ Mn) Forecast, by Sector, 2018–2027
Table 10: Canada Oil & Gas EPC Market Value (US$ Mn) Forecast, by Service, 2018–2027
Table 11: Europe Oil & Gas EPC Market Value (US$ Mn) Forecast, by Sector, 2018–2027
Table 12: Europe Oil & Gas EPC Market Value (US$ Mn) Forecast, by Service, 2018–2027
Table 13: Europe Oil & Gas EPC Market Value (US$ Mn) Forecast, by Country and Sub-region, 2018–2027
Table 14: Norway Oil & Gas EPC Market Value (US$ Mn) Forecast, by Sector, 2018–2027
Table 15: Norway Oil & Gas EPC Market Value (US$ Mn) Forecast, by Service, 2018–2027
Table 16: U.K. Oil & Gas EPC Market Value (US$ Mn) Forecast, by Sector, 2018–2027
Table 17: U.K. Oil & Gas EPC Market Value (US$ Mn) Forecast, by Service, 2018–2027
Table 18: Russia & CIS Oil & Gas EPC Market Value (US$ Mn) Forecast, by Sector, 2018–2027
Table 19: Russia & CIS Oil & Gas EPC Market Value (US$ Mn) Forecast, by Service, 2018–2027
Table 20: Rest of Europe Oil & Gas EPC Market Value (US$ Mn) Forecast, by Sector, 2018–2027
Table 21: Rest of Europe Oil & Gas EPC Market Value (US$ Mn) Forecast, by Service, 2018–2027
Table 22: Asia Pacific Oil & Gas EPC Market Value (US$ Mn) Forecast, by Sector, 2018–2027
Table 23: Asia Pacific Oil & Gas EPC Market Value (US$ Mn) Forecast, by Service, 2018–2027
Table 24: Asia Pacific Oil & Gas EPC Market Value (US$ Mn) Forecast, by Country and Sub-region, 2018–2027
Table 25: China Oil & Gas EPC Market Value (US$ Mn) Forecast, by Sector, 2018–2027
Table 26: China Oil & Gas EPC Market Value (US$ Mn) Forecast, by Service, 2018–2027
Table 27: Japan Oil & Gas EPC Market Value (US$ Mn) Forecast, by Sector, 2018–2027
Table 28: Japan Oil & Gas EPC Market Value (US$ Mn) Forecast, by Service, 2018–2027
Table 29: India Oil & Gas EPC Market Value (US$ Mn) Forecast, by Sector, 2018–2027
Table 30: India Oil & Gas EPC Market Value (US$ Mn) Forecast, by Service, 2018–2027
Table 31: ASEAN Oil & Gas EPC Market Value (US$ Mn) Forecast, by Sector, 2018–2027
Table 32: ASEAN Oil & Gas EPC Market Value (US$ Mn) Forecast, by Service, 2018–2027
Table 33: Rest of Asia Pacific Oil & Gas EPC Market Value (US$ Mn) Forecast, by Sector, 2018–2027
Table 34: Rest of Asia Pacific Oil & Gas EPC Market Value (US$ Mn) Forecast, by Service, 2018–2027
Table 35: Middle East & Africa Oil & Gas EPC Market Value (US$ Mn) Forecast, by Sector, 2018–2027
Table 36: Middle East & Africa Oil & Gas EPC Market Value (US$ Mn) Forecast, by Service, 2018–2027
Table 37: Middle East & Africa Oil & Gas EPC Market Value (US$ Mn) Forecast, by Country and Sub-region, 2018–2027
Table 38: Saudi Arabia Oil & Gas EPC Market Value (US$ Mn) Forecast, by Sector, 2018–2027
Table 39: Saudi Arabia Oil & Gas EPC Market Value (US$ Mn) Forecast, by Service, 2018–2027
Table 40: UAE Oil & Gas EPC Market Value (US$ Mn) Forecast, by Sector, 2018–2027
Table 41: UAE Oil & Gas EPC Market Value (US$ Mn) Forecast, by Service, 2018–2027
Table 42: Oman Oil & Gas EPC Market Value (US$ Mn) Forecast, by Sector, 2018–2027
Table 43: Oman Oil & Gas EPC Market Value (US$ Mn) Forecast, by Service, 2018–2027
Table 44: Qatar Oil & Gas EPC Market Value (US$ Mn) Forecast, by Sector, 2018–2027
Table 45: Qatar Oil & Gas EPC Market Value (US$ Mn) Forecast, by Service, 2018–2027
Table 46: Kuwait Oil & Gas EPC Market Value (US$ Mn) Forecast, by Sector, 2018–2027
Table 47: Kuwait Oil & Gas EPC Market Value (US$ Mn) Forecast, by Service, 2018–2027
Table 48: Algeria Oil & Gas EPC Market Value (US$ Mn) Forecast, by Sector, 2018–2027
Table 49: Algeria Oil & Gas EPC Market Value (US$ Mn) Forecast, by Service, 2018–2027
Table 50: Nigeria Oil & Gas EPC Market Value (US$ Mn) Forecast, by Sector, 2018–2027
Table 51: Nigeria Oil & Gas EPC Market Value (US$ Mn) Forecast, by Service, 2018–2027
Table 52: Rest of Middle East & Africa Oil & Gas EPC Market Value (US$ Mn) Forecast, by Sector, 2018–2027
Table 53: Rest of Middle East & Africa Oil & Gas EPC Market Value (US$ Mn) Forecast, by Service, 2018–2027
Table 54: Latin America Oil & Gas EPC Market Value (US$ Mn) Forecast, by Sector, 2018–2027
Table 55: Latin America Oil & Gas EPC Market Value (US$ Mn) Forecast, by Service, 2018–2027
Table 56: Latin America Oil & Gas EPC Market Value (US$ Mn) Forecast, by Country and Sub-region, 2018–2027
Table 57: Brazil Oil & Gas EPC Market Value (US$ Mn) Forecast, by Sector, 2018–2027
Table 58: Brazil Oil & Gas EPC Market Value (US$ Mn) Forecast, by Service, 2018–2027
Table 59: Mexico Oil & Gas EPC Market Value (US$ Mn) Forecast, by Sector, 2018–2027
Table 60: Mexico Oil & Gas EPC Market Value (US$ Mn) Forecast, by Service, 2018–2027
Table 61: Rest of Latin America Oil & Gas EPC Market Value (US$ Mn) Forecast, by Sector, 2018–2027
Table 62: Rest of Latin America Oil & Gas EPC Market Value (US$ Mn) Forecast, by Service, 2018–2027
List of Figures
Figure 01: Global Oil & Gas EPC Market Value (US$ Mn), 2018
Figure 02: New Offshore Wells Drilled
Figure 03: Discovery of Oil & Gas Fields/Wells/Blocks, by Region, 2018
Figure 04: Global Crude Oil Prices (US$ per Barrel), 2006–2018
Figure 05: Global Oil & Gas EPC Market Value Share Analysis, by Sector, 2018 and 2027
Figure 06: Global Oil & Gas EPC Market Attractiveness Analysis, by Sector, 2018
Figure 07: Global Oil & Gas EPC Market Value Share Analysis, by Service, 2018 and 2027
Figure 08: Global Oil & Gas EPC Market Attractiveness Analysis, by Service, 2018
Figure 09: Global Oil & Gas EPC Market Value Share Analysis, by Region, 2018 and 2027
Figure 10: Global Oil & Gas EPC Market Attractiveness Analysis, by Region, 2018
Figure 11: North America Oil & Gas EPC Market Value Share Analysis, by Country, 2018 and 2027
Figure 12: North America Oil & Gas EPC Market Attractiveness Analysis, by Sector
Figure 13: North America Oil & Gas EPC Market Attractiveness Analysis, by Service
Figure 14: North America Oil & Gas EPC Market Attractiveness Analysis, by Country
Figure 15: Europe Oil & Gas EPC Market Value Share Analysis, by Country and Sub-region, 2018 and 2027
Figure 16: Europe Oil & Gas EPC Market Attractiveness Analysis, by Sector
Figure 17: Europe Oil & Gas EPC Market Attractiveness Analysis, by Service
Figure 18: Europe Oil & Gas EPC Market Attractiveness Analysis, by Country and Sub-region
Figure 19: Asia Pacific Oil & Gas EPC Market Value Share Analysis, by Country and Sub-region, 2018 and 2027
Figure 20: Asia Pacific Oil & Gas EPC Market Attractiveness Analysis, by Sector
Figure 21: Asia Pacific Oil & Gas EPC Market Attractiveness Analysis, by Service
Figure 22: Asia Pacific Oil & Gas EPC Market Attractiveness Analysis, by Country and Sub-region
Figure 23: Middle East & Africa Oil & Gas EPC Market Value Share Analysis, by Country and Sub-region, 2018 and 2027
Figure 24 Middle East & Africa Oil & Gas EPC Market Attractiveness Analysis, by Sector
Figure 25 Middle East & Africa Oil & Gas EPC Market Attractiveness Analysis, by Service
Figure 26: Middle East & Africa Oil & Gas EPC Market Attractiveness Analysis, by Country and Sub-region
Figure 27: Latin America Oil & Gas EPC Market Value Share Analysis, by Country and Sub-region, 2018 and 2027
Figure 28: Latin America Oil & Gas EPC Market Attractiveness Analysis, by Sector
Figure 29: Latin America Oil & Gas EPC Market Attractiveness Analysis, by Service
Figure 30: Latin America Oil & Gas EPC Market Attractiveness Analysis, by Country and Sub-region
Figure 31: Global Oil & Gas EPC Market Share Analysis, by Company (2018)
Figure 32: TechnipFMC plc. Breakdown of Revenue, by Business Segment, 2018
Figure 33: TechnipFMC plc. Revenue (US$ Mn) & Y-o-Y Growth (%), 2015–2018
Figure 34: WorleyParsons Limited Breakdown of Revenue, by Business Segment, 2018
Figure 35: WorleyParsons Limited Breakdown of Revenue, by Geography, 2018
Figure 36: WorleyParsons Limited Revenue (US$ Mn) & Y-o-Y Growth (%), 2016–2018
Figure 37: Saipem SpA Breakdown of Revenue, by Business Segment, 2018
Figure 38: Saipem SpA Breakdown of Revenue, by Geography, 2018
Figure 39: Saipem SpA Revenue (US$ Mn) & Y-o-Y Growth (%), 2015–2018
Figure 40: Petrofac Limited Breakdown of Revenue, by Business Segment, 2018
Figure 41: Petrofac Limited Breakdown of Revenue, by Geography, 2018
Figure 42: Petrofac Limited Revenue (US$ Mn) & Y-o-Y Growth (%), 2015–2018
Figure 43: Bechtel Corporation Revenue (US$ Bn) & Y-o-Y Growth (%), 2015–2018
Figure 44: Mott MacDonald Revenue (US$ Bn) & Y-o-Y Growth (%), 2015–2018
Figure 45: Mott MacDonald Breakdown of Revenue, by Region, 2018
Figure 46: Fluor Corporation Breakdown of Revenue, by Business Segment, 2018
Figure 47: Fluor Corporation Breakdown of Revenue, by Geography, 2018
Figure 48: Fluor Corporation Revenue (US$ Mn) & Y-o-Y Growth (%), 2015–2018
Figure 49: L&T Hydrocarbon Engineering Revenue (US$ Mn) & Y-o-Y Growth (%), 2015–2018
Figure 50: L&T Hydrocarbon Engineering Breakdown of Revenue, by Geography, 2018
Figure 51: John Wood Group PLC Breakdown of Revenue, by Business Segment, 2018
Figure 52: John Wood Group PLC Breakdown of Revenue, by Geography, 2018
Figure 53: John Wood Group PLC Revenue (US$ Mn) & Y-o-Y Growth (%), 2015–2018
Figure 54: SNC-Lavalin Group Breakdown of Revenue, by Business Segment, 2018
Figure 55: SNC-Lavalin Group Breakdown of Revenue, by Key Regions, 2018
Figure 56: SNC-Lavalin Group Revenue (US$ Mn) & Y-o-Y Growth (%), 2015–2018
Figure 57: KBR Inc. Breakdown of Revenue, by Business Segment, 2018
Figure 58: KBR Inc. Breakdown of Revenue, by Key Regions, 2018
Figure 59: KBR Inc. Revenue (US$ Mn) & Y-o-Y Growth (%), 2015–2018
Figure 60: JGC Holding Corporation Breakdown of Revenue, by Business Segment, 2018
Figure 61: JGC Holding Corporation Breakdown of Revenue, by Key Regions, 2018
Figure 62: JGC Holding Corporation Revenue (US$ Mn) & Y-o-Y Growth (%), 2015–2018
Figure 63: Galfar Engineering and Contracting SAOG Revenue (US$ Mn) & Y-o-Y Growth (%), 2015–2018
Figure 64: Lamprell Revenue (US$ Mn) & Y-o-Y Growth (%), 2015–2018
Figure 65: Lamprell Breakdown of Revenue, by Business Segment, 2018
Copyright © Transparency Market Research, Inc. All Rights reserved
Trust Online

Oil & Gas EPC Market