
Reports
Reports
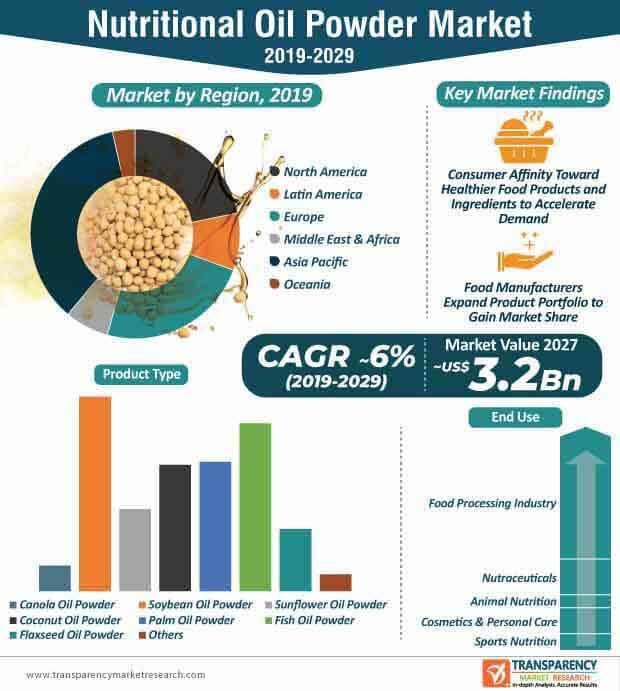
Over the past couple of decades, significant research has been carried out within the food industry to find food products and ingredients that offer the desired levels of nutrition and have no negative effects on the body. Furthermore, evolving consumer interests, tectonic shift toward a healthier lifestyle, and surge in consumer consciousness are some of the factors that have led to the growing demand for niche food products, including nutritional oil powder. The nutritional oil powder market is gradually maturing into a full-fledged industry across the world, as food manufacturers and other stakeholders in the value chain are launching different variants of nutritional oil powder to fulfill the ascending consumer demand, particularly in North America, Europe, and APAC.
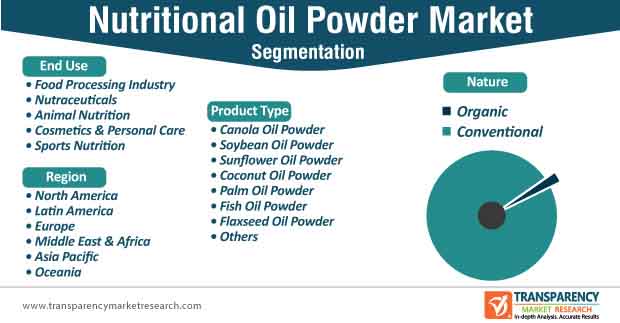
Over the past few years, nutritional oil powder are increasingly being used in sports nutrition, cosmetic & personal care products, nutraceuticals, animal nutrition, and the food processing industry. Consumer affinity toward sustainable and natural products and ingredients is another factor that is expected to enhance the adoption of nutritional oil powder during the forecast period (2019-2027). Thus, demand for natural food products is expected to drive the nutritional oil powder market, which is projected to reach a value of ~US$ 2.1 Bn by 2020.
The shift toward veganism and vegetarianism is a growing trend across the world. The number of vegans and vegetarians has increased at a rapid pace in the past few years, owing to growing consumer awareness pertaining to the ill effects of meat consumption, environmental concerns, and animal cruelty. While vegan and vegetarianism continue to gather traction, consumer trends suggest a substantial surge in the adoption of soybean oil powder. This growth can be primarily attributed to the appropriate blend of protein and high fat content in soybean.
In recent times, the demand for soybean oil powder has increased at a rapid pace. In 2019, ~92,371 metric tons of soybean oil powder was consumed worldwide, and it is projected that ~133,362 metric tons of soybean oil powder will be consumed by the end of 2027. Moreover, non-vegan consumers are also exploring the potential benefits of other alternatives, including palm oil powder, coconut oil powder, and fish oil powder. Palm oil powder and soybean oil powder are expected to account for a collective market share of ~50 % in 2020, a trend that is expected to continue during the forecast period.
Witnessing a significant surge in consumer demand for healthier and natural food products, stakeholders in the nutritional oil powder market are expected to expand their product portfolio to gain an edge in the current market landscape. Furthermore, participants in the nutritional oil powder market are also formulating effective and impactful marketing strategies to improve their brand value. Manufacturers have identified these two strategies as an effective approach toward expanding their footprint in the nutritional oil market. For instance, in August 2018, Archer Daniels Midland Company expanded its health and wellness product portfolio by introducing Onavita™ algal DHA powder. With the addition of this powder, the company aims to expand its existing product offerings, which include vitamins, botanical extracts, nutritional oils, etc. The newly developed powder can be used in an array of fortified food products and dietary supplements, including powdered beverages and nutritional bars.
Despite increasingly being used across the food processing industry, the adoption of nutritional oil powder in nutraceutical formulations is on the rise. After investing a significant amount of resources on research and development, food manufacturers are venturing into the production of nutraceutical products that offer the required nutritional balance, mouthfeel, stability, and taste, among others. With a market share of ~17%, the nutraceuticals end use segment is expected to account for the second-highest share of the nutritional oil powder market in 2020. Stakeholders are expected to closely monitor evolving consumer interests and develop products in tune with these preferences.
Analysts’ Viewpoint
The nutritional oil powder market is expected to grow at a healthy CAGR of ~6% during the forecast period. The growth of the market can be primarily attributed to evolving consumer preferences, shift toward a healthier lifestyle, research and development, and soaring demand for food products made from natural ingredients. Stakeholders operating in the nutritional oil powder market should focus on their marketing and promotional strategies by leveraging the benefits of digital and social media marketing.
Furthermore, as the e-Commerce sector continues to expand its footprint across the world, companies should promote the functional aspects of their products on these platforms to gain a competitive edge in the nutritional oil powder market.
Nutritional Oil Powder Market: Overview
Nutritional Oil Powder: Market Frontrunners
Nutritional Oil Powder Market: Trends
Nutritional Oil Powder Market: Strategies
Nutritional Oil Powder Market: Regional Overview
Nutritional Oil Powder Market: Players
1. Global Nutritional Oil Powder Market - Executive Summary
1.1. Global Nutritional Oil Powder Market Country Analysis
1.2. Application – Product Mapping
1.3. Competition Blueprint
1.4. Technology Time Line Mapping
1.5. TMR Analysis and Recommendations
2. Global Nutritional Oil Powder Market Overview
2.1. Introduction
2.1.1. Global Nutritional Oil Powder Market Taxonomy
2.1.2. Global Nutritional Oil Powder Market Definition
2.2. Global Nutritional Oil Powder Market Size (US$ Mn & Volume) and Forecast, 2013-2027
2.2.1. Global Nutritional Oil Powder Market Y-o-Y Growth
2.3. Global Nutritional Oil Powder Market Dynamics
2.3.1. Drivers
2.3.1.1. Health Benefits Coupled with the Increasing Consciousness among Consumers Regarding Preventive Healthcare is Anticipated to Drive the Growth for Nutritional Oil Powders
2.3.1.2. Increase in Demand for Dietary Supplements and Functional Foods
2.3.1.3. Increased Demand for Plant-based Products
2.3.1.4. Growing Market Penetration of Herbal Products and Herbal Supplements
2.3.1.5. Growing Demand for Cosmetics and Personal Care Products its Surging the Nutritional Oil Powders Demand
2.3.1.6. Snowballing Demand of Nutritional Oil Powders in Sports Nutrition
2.3.1.7. Application of Nutritional Oil Powders in Food and Beverage Industry
2.3.1.8. Increasing Research in Oil-to-Powder Processing
2.3.1.9. Increasing Demand for Oral Solid Drug Formulation in Nutraceuticals
2.3.1.10. Growing Demand for Microencapsulated Fish Oil
2.3.2. Restraints
2.3.2.1. Erratic Raw Material Supply and Quality Leading to Limited Output
2.3.2.2. Price Volatility of Nutritional Oil Powder
2.3.2.3. Lack of Proper Regulations Concerning Sports Supplements is Expected to be barrier for Nutritional Oil Powder based Supplements
2.3.3. Opportunities
2.3.3.1. Online Retailing Paves the Path Towards Nutritional Oil Powders Success
2.3.3.2. Investments in Research and Development Anticipated to Provide Opportunities to Nutritional oil Powder Manufacturers
2.3.3.3. Strong Marketing and Promotional Strategies
2.3.3.4. Flexible Supply Chain to Optimize on Miracle Ingredients/Products
2.3.3.5. Desirable Health Claims by Manufacturers and Brand Owners of Nutritional oil Powder
2.3.4. Trends
2.3.4.1. Clean Label Product Clarity a Must
2.3.4.2. Organic and Non-GMO Nutritional Oil Powder
2.3.4.3. Growing Popularity and Demand for Natural Ingredients
2.4. Supply Chain
2.5. Pricing Analysis
2.5.1. Global Nutritional Oil Powder Market, Weighted Average Pricing (WAP) Analysis by Region, 2018
2.5.2. Global Nutritional Oil Powder Market Pricing Analysis by Product Type, 2018
3. Global Nutritional Oil Powder Market Analysis and Forecast 2013-2027
3.1. Global Nutritional Oil Powder Market Size and Forecast By Product Type, 2013-2027
3.1.1. Canola Oil Powder Market Size and Forecast, 2013-2027
3.1.1.1. Revenue (US$ Mn) & Volume Comparison, By Region
3.1.1.2. Market Share Comparison, By Region
3.1.1.3. Y-o-Y growth Comparison, By Region
3.1.2. Soybean Oil Powder Market Size and Forecast, 2013-2027
3.1.2.1. Revenue (US$ Mn) & Volume Comparison, By Region
3.1.2.2. Market Share Comparison, By Region
3.1.2.3. Y-o-Y growth Comparison, By Region
3.1.3. Sunflower Oil Powder Market Size and Forecast, 2013-2027
3.1.3.1. Revenue (US$ Mn) & Volume Comparison, By Region
3.1.3.2. Market Share Comparison, By Region
3.1.3.3. Y-o-Y growth Comparison, By Region
3.1.4. Coconut Oil Powder Market Size and Forecast, 2013-2027
3.1.4.1. Revenue (US$ Mn) & Volume Comparison, By Region
3.1.4.2. Market Share Comparison, By Region
3.1.4.3. Y-o-Y growth Comparison, By Region
3.1.5. Palm Oil Powder Market Size and Forecast, 2013-2027
3.1.5.1. Revenue (US$ Mn) & Volume Comparison, By Region
3.1.5.2. Market Share Comparison, By Region
3.1.5.3. Y-o-Y growth Comparison, By Region
3.1.6. Fish Oil Powder Market Size and Forecast, 2013-2027
3.1.6.1. Revenue (US$ Mn) & Volume Comparison, By Region
3.1.6.2. Market Share Comparison, By Region
3.1.6.3. Y-o-Y growth Comparison, By Region
3.1.7. Flaxseed Oil Powder Market Size and Forecast, 2013-2027
3.1.7.1. Revenue (US$ Mn) & Volume Comparison, By Region
3.1.7.2. Market Share Comparison, By Region
3.1.7.3. Y-o-Y growth Comparison, By Region
3.1.8. Others Oil Powder Market Size and Forecast, 2013-2027
3.1.8.1. Revenue (US$ Mn) & Volume Comparison, By Region
3.1.8.2. Market Share Comparison, By Region
3.1.8.3. Y-o-Y growth Comparison, By Region
3.2. Global Nutritional Oil Powder Market Size and Forecast By Nature, 2013-2027
3.2.1. Organic Market Size and Forecast, 2013-2027
3.2.1.1. Revenue (US$ Mn) & Volume Comparison, By Region
3.2.1.2. Market Share Comparison, By Region
3.2.1.3. Y-o-Y growth Comparison, By Region
3.2.2. Conventional Market Size and Forecast, 2013-2027
3.2.2.1. Revenue (US$ Mn) & Volume Comparison, By Region
3.2.2.2. Market Share Comparison, By Region
3.2.2.3. Y-o-Y growth Comparison, By Region
3.3. Global Nutritional Oil Powder Market Size and Forecast By End-use, 2013-2027
3.3.1. Food Processing Industry Market Size and Forecast, 2013-2027
3.3.1.1. Revenue (US$ Mn) & Volume Comparison, By Region
3.3.1.2. Market Share Comparison, By Region
3.3.1.3. Y-o-Y growth Comparison, By Region
3.3.2. Nutraceuticals Market Size and Forecast, 2013-2027
3.3.2.1. Revenue (US$ Mn) & Volume Comparison, By Region
3.3.2.2. Market Share Comparison, By Region
3.3.2.3. Y-o-Y growth Comparison, By Region
3.3.3. Animal Nutrition Market Size and Forecast, 2013-2027
3.3.3.1. Revenue (US$ Mn) & Volume Comparison, By Region
3.3.3.2. Market Share Comparison, By Region
3.3.3.3. Y-o-Y growth Comparison, By Region
3.3.4. Cosmetic and Personal Care Market Size and Forecast, 2013-2027
3.3.4.1. Revenue (US$ Mn) & Volume Comparison, By Region
3.3.4.2. Market Share Comparison, By Region
3.3.4.3. Y-o-Y growth Comparison, By Region
3.3.5. Sports Nutrition Market Size and Forecast, 2013-2027
3.3.5.1. Revenue (US$ Mn) & Volume Comparison, By Region
3.3.5.2. Market Share Comparison, By Region
3.3.5.3. Y-o-Y growth Comparison, By Region
4. North America Nutritional Oil Powder Market Size and Forecast, 2013-2027
4.1. Revenue (US$ Mn) & Volume Comparison, By Country
4.2. Revenue (US$ Mn) & Volume Comparison, By Product Type
4.3. Revenue (US$ Mn) & Volume Comparison, By Nature
4.4. Revenue (US$ Mn) & Volume Comparison, By End-Use
5. Latin America Nutritional Oil Powder Market Size and Forecast, 2013-2027
5.1. Revenue (US$ Mn) & Volume Comparison, By Country
5.2. Revenue (US$ Mn) & Volume Comparison, By Product Type
5.3. Revenue (US$ Mn) & Volume Comparison, By Nature
5.4. Revenue (US$ Mn) & Volume Comparison, By End-Use
6. Europe Nutritional Oil Powder Market Size and Forecast, 2013-2027
6.1. Revenue (US$ Mn) & Volume Comparison, By Country
6.2. Revenue (US$ Mn) & Volume Comparison, By Product Type
6.3. Revenue (US$ Mn) & Volume Comparison, By Nature
6.4. Revenue (US$ Mn) & Volume Comparison, By End-Use
7. APAC Nutritional Oil Powder Market Size and Forecast, 2013-2027
7.1. Revenue (US$ Mn) & Volume Comparison, By Country
7.2. Revenue (US$ Mn) & Volume Comparison, By Product Type
7.3. Revenue (US$ Mn) & Volume Comparison, By Nature
7.4. Revenue (US$ Mn) & Volume Comparison, By End-Use
8. MEA Nutritional Oil Powder Market Size and Forecast, 2013-2027
8.1. Revenue (US$ Mn) & Volume Comparison, By Country
8.2. Revenue (US$ Mn) & Volume Comparison, By Product Type
8.3. Revenue (US$ Mn) & Volume Comparison, By Nature
8.4. Revenue (US$ Mn) & Volume Comparison, By End-Use
9. Oceania Nutritional Oil Powder Market Size and Forecast, 2013-2027
9.1. Revenue (US$ Mn) & Volume Comparison, By Country
9.2. Revenue (US$ Mn) & Volume Comparison, By Product Type
9.3. Revenue (US$ Mn) & Volume Comparison, By Nature
9.4. Revenue (US$ Mn) & Volume Comparison, By End-Use
10. Global Nutritional Oil Powder Market Company Share, Competition Landscape and Company Profiles
10.1. Company Share Analysis
10.2. Company Landscape
10.3. Company Profiles
10.3.1. Connoils LLC
10.3.1.1. Overview
10.3.1.2. Product Portfolio
10.3.1.3. Production Footprint
10.3.1.4. Sales Footprint
10.3.1.5. Channel Footprint
10.3.1.6. Strategy Overview
10.3.1.7. SWOT Analysis
10.3.1.8. Financial Analysis
10.3.2. ABITEC Corporation
10.3.2.1. Overview
10.3.2.2. Product Portfolio
10.3.2.3. Production Footprint
10.3.2.4. Sales Footprint
10.3.2.5. Channel Footprint
10.3.2.6. Strategy Overview
10.3.2.7. SWOT Analysis
10.3.2.8. Financial Analysis
10.3.3. Crestchem Ltd
10.3.3.1. Overview
10.3.3.2. Product Portfolio
10.3.3.3. Production Footprint
10.3.3.4. Sales Footprint
10.3.3.5. Channel Footprint
10.3.3.6. Strategy Overview
10.3.3.7. SWOT Analysis
10.3.3.8. Financial Analysis
10.3.4. Bioriginal Food and Science Corporation
10.3.4.1. Overview
10.3.4.2. Product Portfolio
10.3.4.3. Production Footprint
10.3.4.4. Sales Footprint
10.3.4.5. Channel Footprint
10.3.4.6. Strategy Overview
10.3.4.7. SWOT Analysis
10.3.4.8. Financial Analysis
10.3.5. Arjuna Natural Pvt Ltd
10.3.5.1. Overview
10.3.5.2. Product Portfolio
10.3.5.3. Production Footprint
10.3.5.4. Sales Footprint
10.3.5.5. Channel Footprint
10.3.5.6. Strategy Overview
10.3.5.7. SWOT Analysis
10.3.5.8. Financial Analysis
10.3.6. Stepan Company
10.3.6.1. Overview
10.3.6.2. Product Portfolio
10.3.6.3. Production Footprint
10.3.6.4. Sales Footprint
10.3.6.5. Channel Footprint
10.3.6.6. Strategy Overview
10.3.6.7. SWOT Analysis
10.3.6.8. Financial Analysis
10.3.7. The Green Labs LLC
10.3.7.1. Overview
10.3.7.2. Product Portfolio
10.3.7.3. Production Footprint
10.3.7.4. Sales Footprint
10.3.7.5. Channel Footprint
10.3.7.6. Strategy Overview
10.3.7.7. SWOT Analysis
10.3.7.8. Financial Analysis
10.3.8. SMS Corporation
10.3.8.1. Overview
10.3.8.2. Product Portfolio
10.3.8.3. Production Footprint
10.3.8.4. Sales Footprint
10.3.8.5. Channel Footprint
10.3.8.6. Strategy Overview
10.3.8.7. SWOT Analysis
10.3.8.8. Financial Analysis
10.3.9. Alsec Alimentos Secos SAS
10.3.9.1. Overview
10.3.9.2. Product Portfolio
10.3.9.3. Production Footprint
10.3.9.4. Sales Footprint
10.3.9.5. Channel Footprint
10.3.9.6. Strategy Overview
10.3.9.7. SWOT Analysis
10.3.9.8. Financial Analysis
10.3.10. Custom Food Ingredients Sdn. Bhd.
10.3.10.1. Overview
10.3.10.2. Product Portfolio
10.3.10.3. Production Footprint
10.3.10.4. Sales Footprint
10.3.10.5. Channel Footprint
10.3.10.6. Strategy Overview
10.3.10.7. SWOT Analysis
10.3.10.8. Financial Analysis
10.3.11. Ming City Biotechnology Ltd.
10.3.11.1. Overview
10.3.11.2. Product Portfolio
10.3.11.3. Production Footprint
10.3.11.4. Sales Footprint
10.3.11.5. Channel Footprint
10.3.11.6. Strategy Overview
10.3.11.7. SWOT Analysis
10.3.11.8. Financial Analysis
11. Research Methodology
12. Secondary and Primary Sources
13. Assumption and Acronyms
14. Disclaimer
TABLE 1: Global Nutritional Oil Powder Market Value (US$ Mn) & Volume, 2013-2018
TABLE 2: Global Nutritional Oil Powder Market Value (US$ Mn) & Volume, 2019-2027
TABLE 3: Global Nutritional Oil Powder Market Value (US$ Mn) & Volume and Y-o-Y, 2018-2027
TABLE 4: Global Canola Oil Powder Segment Value (US$ Mn) & Volume, By Region 2013-2018
TABLE 5: Global Canola Oil Powder Segment Value (US$ Mn) & Volume, By Region 2019-2027
TABLE 6: Global Canola Oil Powder Segment Market Share, By Region 2013-2018
TABLE 7: Global Canola Oil Powder Segment Market Share, By Region 2019-2027
TABLE 8: Global Canola Oil Powder Segment Y-o-Y, By Region 2018-2027
TABLE 9: Global Soybean Oil Powder Segment Value (US$ Mn) & Volume, By Region 2013-2018
TABLE 10: Global Soybean Oil Powder Segment Value (US$ Mn) & Volume, By Region 2019-2027
TABLE 11: Global Soybean Oil Powder Segment Market Share, By Region 2013-2018
TABLE 12: Global Soybean Oil Powder Segment Market Share, By Region 2019-2027
TABLE 13: Global Soybean Oil Powder Segment Y-o-Y, By Region 2018-2027
TABLE 14: Global Sunflower Oil Powder Segment Value (US$ Mn) & Volume, By Region 2013-2018
TABLE 15: Global Sunflower Oil Powder Segment Value (US$ Mn) & Volume, By Region 2019-2027
TABLE 16: Global Sunflower Oil Powder Segment Market Share, By Region 2013-2018
TABLE 17: Global Sunflower Oil Powder Segment Market Share, By Region 2019-2027
TABLE 18: Global Sunflower Oil Powder Segment Y-o-Y, By Region 2018-2027
TABLE 19: Global Coconut Oil Powder Segment Value (US$ Mn) & Volume, By Region 2013-2018
TABLE 20: Global Coconut Oil Powder Segment Value (US$ Mn) & Volume, By Region 2019-2027
TABLE 21: Global Coconut Oil Powder Segment Market Share, By Region 2013-2018
TABLE 22: Global Coconut Oil Powder Segment Market Share, By Region 2019-2027
TABLE 23: Global Coconut Oil Powder Segment Y-o-Y, By Region 2018-2027
TABLE 24: Global Palm Oil Powder Segment Value (US$ Mn) & Volume, By Region 2013-2018
TABLE 25: Global Palm Oil Powder Segment Value (US$ Mn) & Volume, By Region 2019-2027
TABLE 26: Global Palm Oil Powder Segment Market Share, By Region 2013-2018
TABLE 27: Global Palm Oil Powder Segment Market Share, By Region 2019-2027
TABLE 28: Global Palm Oil Powder Segment Y-o-Y, By Region 2018-2027
TABLE 29: Global Fish Oil Powder Segment Value (US$ Mn) & Volume, By Region 2013-2018
TABLE 30: Global Fish Oil Powder Segment Value (US$ Mn) & Volume, By Region 2019-2027
TABLE 31: Global Fish Oil Powder Segment Market Share, By Region 2013-2018
TABLE 32: Global Fish Oil Powder Segment Market Share, By Region 2019-2027
TABLE 33: Global Fish Oil Powder Segment Y-o-Y, By Region 2018-2027
TABLE 34: Global Flaxseed Oil Powder Segment Value (US$ Mn) & Volume, By Region 2013-2018
TABLE 35: Global Flaxseed Oil Powder Segment Value (US$ Mn) & Volume, By Region 2019-2027
TABLE 36: Global Flaxseed Oil Powder Segment Market Share, By Region 2013-2018
TABLE 37: Global Flaxseed Oil Powder Segment Market Share, By Region 2019-2027
TABLE 38: Global Flaxseed Oil Powder Segment Y-o-Y, By Region 2018-2027
TABLE 39: Global Others Segment Value (US$ Mn) & Volume, By Region 2013-2018
TABLE 40: Global Others Segment Value (US$ Mn) & Volume, By Region 2019-2027
TABLE 41: Global Others Segment Market Share, By Region 2013-2018
TABLE 42: Global Others Segment Market Share, By Region 2019-2027
TABLE 43: Global Others Segment Y-o-Y, By Region 2018-2027
TABLE 44: Global Organic Segment Value (US$ Mn) & Volume, By Region 2013-2018
TABLE 45: Global Organic Segment Value (US$ Mn) & Volume, By Region 2019-2027
TABLE 46: Global Organic Segment Market Share, By Region 2013-2018
TABLE 47: Global Organic Segment Market Share, By Region 2019-2027
TABLE 48: Global Organic Segment Y-o-Y, By Region 2018-2027
TABLE 49: Global Conventional Segment Value (US$ Mn) & Volume, By Region 2013-2018
TABLE 50: Global Conventional Segment Value (US$ Mn) & Volume, By Region 2019-2027
TABLE 51: Global Conventional Segment Market Share, By Region 2013-2018
TABLE 52: Global Conventional Segment Market Share, By Region 2019-2027
TABLE 53: Global Conventional Segment Y-o-Y, By Region 2018-2027
TABLE 54: Global Food Processing Industry Segment Value (US$ Mn) & Volume, By Region 2013-2018
TABLE 55: Global Food Processing Industry Segment Value (US$ Mn) & Volume, By Region 2019-2027
TABLE 56: Global Food Processing Industry Segment Market Share, By Region 2013-2018
TABLE 57: Global Food Processing Industry Segment Market Share, By Region 2019-2027
TABLE 58: Global Food Processing Industry Segment Y-o-Y, By Region 2018-2027
TABLE 59: Global Nutraceuticals Segment Value (US$ Mn) & Volume, By Region 2013-2018
TABLE 60: Global Nutraceuticals Segment Value (US$ Mn) & Volume, By Region 2019-2027
TABLE 61: Global Nutraceuticals Segment Market Share, By Region 2013-2018
TABLE 62: Global Nutraceuticals Segment Market Share, By Region 2019-2027
TABLE 63: Global Nutraceuticals Segment Y-o-Y, By Region 2018-2027
TABLE 64: Global Animal Nutrition Segment Value (US$ Mn) & Volume, By Region 2013-2018
TABLE 65: Global Animal Nutrition Segment Value (US$ Mn) & Volume, By Region 2019-2027
TABLE 66: Global Animal Nutrition Segment Market Share, By Region 2013-2018
TABLE 67: Global Animal Nutrition Segment Market Share, By Region 2019-2027
TABLE 68: Global Animal Nutrition Segment Y-o-Y, By Region 2018-2027
TABLE 69: Global Cosmetic and Personal Care Segment Value (US$ Mn) & Volume, By Region 2013-2018
TABLE 70: Global Cosmetic and Personal Care Segment Value (US$ Mn) & Volume, By Region 2019-2027
TABLE 71: Global Cosmetic and Personal Care Segment Market Share, By Region 2013-2018
TABLE 72: Global Cosmetic and Personal Care Segment Market Share, By Region 2019-2027
TABLE 73: Global Cosmetic and Personal Care Segment Y-o-Y, By Region 2018-2027
TABLE 74: Global Sports Nutrition Segment Value (US$ Mn) & Volume, By Region 2013-2018
TABLE 75: Global Sports Nutrition Segment Value (US$ Mn) & Volume, By Region 2019-2027
TABLE 76: Global Sports Nutrition Segment Market Share, By Region 2013-2018
TABLE 77: Global Sports Nutrition Segment Market Share, By Region 2019-2027
TABLE 78: Global Sports Nutrition Segment Y-o-Y, By Region 2018-2027
TABLE 79: North America Nutritional Oil Powder Market Value (US$ Mn) & Volume, By Country 2013-2018
TABLE 80: North America Nutritional Oil Powder Market Value (US$ Mn) & Volume, By Country 2019-2027
TABLE 81: North America Nutritional Oil Powder Market Value (US$ Mn) & Volume, By Product Type 2013-2018
TABLE 82: North America Nutritional Oil Powder Market Value (US$ Mn) & Volume, By Product Type 2019-2027
TABLE 83: North America Nutritional Oil Powder Market Value (US$ Mn) & Volume, By Nature 2013-2018
TABLE 84: North America Nutritional Oil Powder Market Value (US$ Mn) & Volume, By Nature 2019-2027
TABLE 85: North America Nutritional Oil Powder Market Value (US$ Mn) & Volume, By End-use 2013-2018
TABLE 86: North America Nutritional Oil Powder Market Value (US$ Mn) & Volume, By End-use 2019-2027
TABLE 87: Latin America Nutritional Oil Powder Market Value (US$ Mn) & Volume, By Country 2013-2018
TABLE 88: Latin America Nutritional Oil Powder Market Value (US$ Mn) & Volume, By Country 2019-2027
TABLE 89: Latin America Nutritional Oil Powder Market Value (US$ Mn) & Volume, By Product Type 2013-2018
TABLE 90: Latin America Nutritional Oil Powder Market Value (US$ Mn) & Volume, By Product Type 2019-2027
TABLE 91: Latin America Nutritional Oil Powder Market Value (US$ Mn) & Volume, By Nature 2013-2018
TABLE 92: Latin America Nutritional Oil Powder Market Value (US$ Mn) & Volume, By Nature 2019-2027
TABLE 93: Latin America Nutritional Oil Powder Market Value (US$ Mn) & Volume, By End-use 2013-2018
TABLE 94: Latin America Nutritional Oil Powder Market Value (US$ Mn) & Volume, By End-use 2019-2027
TABLE 95: Europe Nutritional Oil Powder Market Value (US$ Mn) & Volume, By Country 2013-2018
TABLE 96: Europe Nutritional Oil Powder Market Value (US$ Mn) & Volume, By Country 2019-2027
TABLE 97: Europe Nutritional Oil Powder Market Value (US$ Mn) & Volume, By Product Type 2013-2018
TABLE 98: Europe Nutritional Oil Powder Market Value (US$ Mn) & Volume, By Product Type 2019-2027
TABLE 99: Europe Nutritional Oil Powder Market Value (US$ Mn) & Volume, By Nature 2013-2018
TABLE 100: Europe Nutritional Oil Powder Market Value (US$ Mn) & Volume, By Nature 2019-2027
TABLE 101: Europe Nutritional Oil Powder Market Value (US$ Mn) & Volume, By End-use 2013-2018
TABLE 102: Europe Nutritional Oil Powder Market Value (US$ Mn) & Volume, By End-use 2019-2027
TABLE 103: APAC Nutritional Oil Powder Market Value (US$ Mn) & Volume, By Country 2013-2018
TABLE 104: APAC Nutritional Oil Powder Market Value (US$ Mn) & Volume, By Country 2019-2027
TABLE 105: APAC Nutritional Oil Powder Market Value (US$ Mn) & Volume, By Product Type 2013-2018
TABLE 106: APAC Nutritional Oil Powder Market Value (US$ Mn) & Volume, By Product Type 2019-2027
TABLE 107: APAC Nutritional Oil Powder Market Value (US$ Mn) & Volume, By Nature 2013-2018
TABLE 108: APAC Nutritional Oil Powder Market Value (US$ Mn) & Volume, By Nature 2019-2027
TABLE 109: APAC Nutritional Oil Powder Market Value (US$ Mn) & Volume, By End-use 2013-2018
TABLE 110: APAC Nutritional Oil Powder Market Value (US$ Mn) & Volume, By End-use 2019-2027
TABLE 111: MEA Nutritional Oil Powder Market Value (US$ Mn) & Volume, By Country 2013-2018
TABLE 112: MEA Nutritional Oil Powder Market Value (US$ Mn) & Volume, By Country 2019-2027
TABLE 113: MEA Nutritional Oil Powder Market Value (US$ Mn) & Volume, By Product Type 2013-2018
TABLE 114: MEA Nutritional Oil Powder Market Value (US$ Mn) & Volume, By Product Type 2019-2027
TABLE 115: MEA Nutritional Oil Powder Market Value (US$ Mn) & Volume, By Nature 2013-2018
TABLE 116: MEA Nutritional Oil Powder Market Value (US$ Mn) & Volume, By Nature 2019-2027
TABLE 117: MEA Nutritional Oil Powder Market Value (US$ Mn) & Volume, By End-use 2013-2018
TABLE 118: MEA Nutritional Oil Powder Market Value (US$ Mn) & Volume, By End-use 2019-2027
TABLE 119: Oceania Nutritional Oil Powder Market Value (US$ Mn) & Volume, By Country 2013-2018
TABLE 120: Oceania Nutritional Oil Powder Market Value (US$ Mn) & Volume, By Country 2019-2027
TABLE 121: Oceania Nutritional Oil Powder Market Value (US$ Mn) & Volume, By Product Type 2013-2018
TABLE 122: Oceania Nutritional Oil Powder Market Value (US$ Mn) & Volume, By Product Type 2019-2027
TABLE 123: Oceania Nutritional Oil Powder Market Value (US$ Mn) & Volume, By Nature 2013-2018
TABLE 124: Oceania Nutritional Oil Powder Market Value (US$ Mn) & Volume, By Nature 2019-2027
TABLE 125: Oceania Nutritional Oil Powder Market Value (US$ Mn) & Volume, By End-use 2013-2018
TABLE 126: Oceania Nutritional Oil Powder Market Value (US$ Mn) & Volume, By End-use 2019-2027
FIG. 1: Global Nutritional Oil Powder Market Value (US$ Mn), 2013-2018
FIG. 2: Global Nutritional Oil Powder Market Value (US$ Mn) Forecast, 2019-2027
FIG. 3: Global Nutritional Oil Powder Market Value (US$ Mn) and Y-o-Y, 2018-2027
FIG. 4: Global Canola Oil Powder Segment Market Value (US$ Mn) By Region, 2013-2018
FIG. 5: Global Canola Oil Powder Segment Market Value (US$ Mn) By Region, 2019-2027
FIG. 6: Global Canola Oil Powder Segment Y-o-Y Growth Rate, By Region, 2018-2027
FIG. 7: Global Soybean Oil Powder Segment Market Value (US$ Mn) By Region, 2013-2018
FIG. 8: Global Soybean Oil Powder Segment Market Value (US$ Mn) By Region, 2019-2027
FIG. 9: Global Soybean Oil Powder Segment Y-o-Y Growth Rate, By Region, 2018-2027
FIG. 10: Global Sunflower Oil Powder Segment Market Value (US$ Mn) By Region, 2013-2018
FIG. 11: Global Sunflower Oil Powder Segment Market Value (US$ Mn) By Region, 2019-2027
FIG. 12: Global Sunflower Oil Powder Segment Y-o-Y Growth Rate, By Region, 2018-2027
FIG. 13: Global Coconut Oil Powder Segment Market Value (US$ Mn) By Region, 2013-2018
FIG. 14: Global Coconut Oil Powder Segment Market Value (US$ Mn) By Region, 2019-2027
FIG. 15: Global Coconut Oil Powder Segment Y-o-Y Growth Rate, By Region, 2018-2027
FIG. 16: Global Palm Oil Powder Segment Market Value (US$ Mn) By Region, 2013-2018
FIG. 17: Global Palm Oil Powder Segment Market Value (US$ Mn) By Region, 2019-2027
FIG. 18: Global Palm Oil Powder Segment Y-o-Y Growth Rate, By Region, 2018-2027
FIG. 19: Global Fish Oil Powder Segment Market Value (US$ Mn) By Region, 2013-2018
FIG. 20: Global Fish Oil Powder Segment Market Value (US$ Mn) By Region, 2019-2027
FIG. 21: Global Fish Oil Powder Segment Y-o-Y Growth Rate, By Region, 2018-2027
FIG. 22: Global Flaxseed Oil Powder Segment Market Value (US$ Mn) By Region, 2013-2018
FIG. 23: Global Flaxseed Oil Powder Segment Market Value (US$ Mn) By Region, 2019-2027
FIG. 24: Global Flaxseed Oil Powder Segment Y-o-Y Growth Rate, By Region, 2018-2027
FIG. 25: Global Others Segment Market Value (US$ Mn) By Region, 2013-2018
FIG. 26: Global Others Segment Market Value (US$ Mn) By Region, 2019-2027
FIG. 27: Global Others Segment Y-o-Y Growth Rate, By Region, 2018-2027
FIG. 28: Global Organic Segment Market Value (US$ Mn) By Region, 2013-2018
FIG. 29: Global Organic Segment Market Value (US$ Mn) By Region, 2019-2027
FIG. 30: Global Organic Segment Y-o-Y Growth Rate, By Region, 2018-2027
FIG. 31: Global Conventional Segment Market Value (US$ Mn) By Region, 2013-2018
FIG. 32: Global Conventional Segment Market Value (US$ Mn) By Region, 2019-2027
FIG. 33: Global Conventional Segment Y-o-Y Growth Rate, By Region, 2018-2027
FIG. 34: Global Food Processing Industry Segment Market Value (US$ Mn) By Region, 2013-2018
FIG. 35: Global Food Processing Industry Segment Market Value (US$ Mn) By Region, 2019-2027
FIG. 36: Global Food Processing Industry Segment Y-o-Y Growth Rate, By Region, 2018-2027
FIG. 37: Global Nutraceuticals Segment Market Value (US$ Mn) By Region, 2013-2018
FIG. 38: Global Nutraceuticals Segment Market Value (US$ Mn) By Region, 2019-2027
FIG. 39: Global Nutraceuticals Segment Y-o-Y Growth Rate, By Region, 2018-2027
FIG. 40: Global Animal Nutrition Segment Market Value (US$ Mn) By Region, 2013-2018
FIG. 41: Global Animal Nutrition Segment Market Value (US$ Mn) By Region, 2019-2027
FIG. 42: Global Animal Nutrition Segment Y-o-Y Growth Rate, By Region, 2018-2027
FIG. 43: Global Cosmetic and Personal Care Segment Market Value (US$ Mn) By Region, 2013-2018
FIG. 44: Global Cosmetic and Personal Care Segment Market Value (US$ Mn) By Region, 2019-2027
FIG. 45: Global Cosmetic and Personal Care Segment Y-o-Y Growth Rate, By Region, 2018-2027
FIG. 46: Global Sports Nutrition Segment Market Value (US$ Mn) By Region, 2013-2018
FIG. 47: Global Sports Nutrition Segment Market Value (US$ Mn) By Region, 2019-2027
FIG. 48: Global Sports Nutrition Segment Y-o-Y Growth Rate, By Region, 2018-2027
FIG. 49: North America Nutritional Oil Powder Market Value (US$ Mn), By Country 2013-2018
FIG. 50: North America Nutritional Oil Powder Market Value (US$ Mn), By Country 2019-2027
FIG. 51: North America Nutritional Oil Powder Market Value (US$ Mn), By Product Type 2013-2018
FIG. 52: North America Nutritional Oil Powder Market Value (US$ Mn), By Product Type 2019-2027
FIG. 53: North America Nutritional Oil Powder Market Value (US$ Mn), By Nature 2013-2018
FIG. 54: North America Nutritional Oil Powder Market Value (US$ Mn), By Nature 2019-2027
FIG. 55: North America Nutritional Oil Powder Market Value (US$ Mn), By End-use 2013-2018
FIG. 56: North America Nutritional Oil Powder Market Value (US$ Mn), By End-use 2019-2027
FIG. 57: Latin America Nutritional Oil Powder Market Value (US$ Mn), By Country 2013-2018
FIG. 58: Latin America Nutritional Oil Powder Market Value (US$ Mn), By Country 2019-2027
FIG. 59: Latin America Nutritional Oil Powder Market Value (US$ Mn), By Product Type 2013-2018
FIG. 60: Latin America Nutritional Oil Powder Market Value (US$ Mn), By Product Type 2019-2027
FIG. 61: Latin America Nutritional Oil Powder Market Value (US$ Mn), By Nature 2013-2018
FIG. 62: Latin America Nutritional Oil Powder Market Value (US$ Mn), By Nature 2019-2027
FIG. 63: Latin America Nutritional Oil Powder Market Value (US$ Mn), By End-use 2013-2018
FIG. 64: Latin America Nutritional Oil Powder Market Value (US$ Mn), By End-use 2019-2027
FIG. 65: Europe Nutritional Oil Powder Market Value (US$ Mn), By Country 2013-2018
FIG. 66: Europe Nutritional Oil Powder Market Value (US$ Mn), By Country 2019-2027
FIG. 67: Europe Nutritional Oil Powder Market Value (US$ Mn), By Product Type 2013-2018
FIG. 68: Europe Nutritional Oil Powder Market Value (US$ Mn), By Product Type 2019-2027
FIG. 69: Europe Nutritional Oil Powder Market Value (US$ Mn), By Nature 2013-2018
FIG. 70: Europe Nutritional Oil Powder Market Value (US$ Mn), By Nature 2019-2027
FIG. 71: Europe Nutritional Oil Powder Market Value (US$ Mn), By End-use 2013-2018
FIG. 72: Europe Nutritional Oil Powder Market Value (US$ Mn), By End-use 2019-2027
FIG. 73: APAC Nutritional Oil Powder Market Value (US$ Mn), By Country 2013-2018
FIG. 74: APAC Nutritional Oil Powder Market Value (US$ Mn), By Country 2019-2027
FIG. 75: APAC Nutritional Oil Powder Market Value (US$ Mn), By Product Type 2013-2018
FIG. 76: APAC Nutritional Oil Powder Market Value (US$ Mn), By Product Type 2019-2027
FIG. 77: APAC Nutritional Oil Powder Market Value (US$ Mn), By End-use 2013-2018
FIG. 78: APAC Nutritional Oil Powder Market Value (US$ Mn), By Nature 2019-2027
FIG. 79: APAC Nutritional Oil Powder Market Value (US$ Mn), By End-use 2013-2018
FIG. 80: APAC Nutritional Oil Powder Market Value (US$ Mn), By End-use 2019-2027
FIG. 81: MEA Nutritional Oil Powder Market Value (US$ Mn), By Country 2013-2018
FIG. 82: MEA Nutritional Oil Powder Market Value (US$ Mn), By Country 2019-2027
FIG. 83: MEA Nutritional Oil Powder Market Value (US$ Mn), By Product Type 2013-2018
FIG. 84: MEA Nutritional Oil Powder Market Value (US$ Mn), By Product Type 2019-2027
FIG. 85: MEA Nutritional Oil Powder Market Value (US$ Mn), By Nature 2013-2018
FIG. 86: MEA Nutritional Oil Powder Market Value (US$ Mn), By Nature 2019-2027
FIG. 87: MEA Nutritional Oil Powder Market Value (US$ Mn), By End-use 2013-2018
FIG. 88: MEA Nutritional Oil Powder Market Value (US$ Mn), By End-use 2019-2027
FIG. 89: Oceania Nutritional Oil Powder Market Value (US$ Mn), By Country 2013-2018
FIG. 90: Oceania Nutritional Oil Powder Market Value (US$ Mn), By Country 2019-2027
FIG. 91: Oceania Nutritional Oil Powder Market Value (US$ Mn), By Product Type 2013-2018
FIG. 92: Oceania Nutritional Oil Powder Market Value (US$ Mn), By Product Type 2019-2027
FIG. 93: Oceania Nutritional Oil Powder Market Value (US$ Mn), By Nature 2013-2018
FIG. 94: Oceania Nutritional Oil Powder Market Value (US$ Mn), By Nature 2019-2027
FIG. 95: Oceania Nutritional Oil Powder Market Value (US$ Mn), By End-use 2013-2018
FIG. 96: Oceania Nutritional Oil Powder Market Value (US$ Mn), By End-use 2019-2027
Copyright © Transparency Market Research, Inc. All Rights reserved
Trust Online

Nutritional Oil Powder Market