
Reports
Reports
Analysts’ Viewpoint on Non-tearable Paper Market Scenario
Non-tearable paper is employed in a wide range of applications in several end-use industries such as retail, consumer goods, and e-commerce. It is preferred over conventional paper due to its excellent chemical resistance, tear resistance, oil resistance, and moisture resistance. Growth prospects for non-tearable paper market appear positive due to the rise in usage of synthetic non-tearable paper in industries such as pharmaceuticals, transportation, and food & beverages. Companies operating in the market are increasingly manufacturing non-tearable paper such as non-tearable glossy paper and non-tearable sticker paper from plastic wastes such as high-impact polystyrene (HIPS) and high-density polyethylene (HDPE). They are also focusing on manufacturing innovative products, such as non-tearable photo paper, to broaden their revenue streams.
Non-tearable paper is manufactured using synthetic resin derived from petroleum as the key raw material. This gives it the properties of plastic film. Resin selection plays a vital role in attributes exhibited by non-tearable paper. Non-tearable paper resembles paper produced from wood pulp. Several non-tearable papers possess the properties of regular paper.
Non tearable, co-extruded, white opaque, and both sides matte coated film, which resembles paper in appearance, is ideal for outdoor applications, where printing is done on both sides and requires 100% opacity. This white opaque paper has remarkable moisture resistance, and yields superior ink adhesion and exceptional color reproducibility. The matt-like finishing on both sides makes it appear similar to paper and offers excellent print quality and true color output. The print receptive coating allows it to be printed on both sides by conventional & UV offset, UV & water-based flexographic, thermal transfer, and screen & letterpress printing processes.
Labels enable consumers to make decisions through attractive information. They help differentiate quality products from others. Digital customers are increasingly seeking remarkable experiences in their interactions with the digital world. One such interaction relates to the paper packaging materials business. Non-tearable paper provides lucrative opportunities to manufacturers by helping them improve the delivery experience.
The e-commerce industry has been growing significantly, especially after the onset of the COVID-19 pandemic. Demand for products purchased online increased substantially during the lockdowns enforced by countries to curb the spread of the disease. Non-tearable paper is largely used in the e-commerce sector, as it provides durability, resistance against water and moisture, tamper-evident and tamper-resistant security, sterilization, and chemical resistance. Thus, growth in the e-commerce industry is driving the global non-tearable paper market. Non-tearable paper is also used in a wide range of other applications, from plant tags to wire harness tags in the automotive sector.
Non-tearable paper possesses unique properties, which give it an edge in day-to-day usage in various industries. It is resistant to water, oily substances, and many chemical products. Combining the advantages of paper with durability of plastic, non-tearable paper looks and feels similar to a premium matt-coated paper. It is widely used in outdoor printing. Non-tearable paper is primarily employed where it is not feasible to use regular paper due to environmental conditions. For instance, it is used in labelling of seeds, wood, metal products, outdoor storage goods, etc.
Non-tearable paper is durable and has the ability to handle high-resolution printing. It is used in applications where long-term durability is required. Synthetic paper also has the added benefit of being easy to print.
Synthetic paper is a 100% tree-free solution, as it does not require wood pulp in the production process. It is an eco-friendly replacement of paper in applications that require durability and longevity. It is completely recyclable, and does not pollute air and water bodies during its production. Rise in cost of wood pulp and increase in deforestation are compelling a number of countries to seek other raw ingredients and methods for creating ecofriendly paper products. Various fibers can be used as alternatives to wood pulp paper. This is offering lucrative opportunities for manufacturers operating in the synthetic paper market.
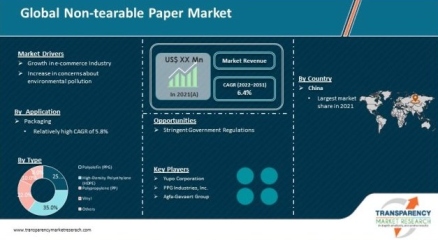
Based on application, the global non-tearable paper market has been divided into packaging, printing, labeling, posters, books, and others. The packaging segment accounted for major share of 38% of the global market in 2021. The segment is estimated to grow at a CAGR of 5.8% during the forecast period owing to the improvement in lifestyle of people and increase in disposable income in emerging economies such as India, China, Brazil, and Russia.
In terms of value, Asia Pacific held 41.1% share of the global non-tearable paper market in 2021. Asia Pacific is expected to be the most attractive market for non-tearable paper during the forecast period. Demand for non-tearable paper is rising in the region due to the increase in disposable income of the people and growth in e-commerce industry.
In terms of value, Europe and North America are also prominent markets for non-tearable paper. These regions held 20.0% and 27.5% share, respectively, of the global non-tearable paper market in 2021. The market in Europe and North America is expected to grow at a CAGR of 6.8% and 6.3%, respectively, during the forecast period.
The global non-tearable paper market comprises several small and large scale manufacturers and suppliers that control majority of the share. Most of the non-tearable paper market manufacturers are investing significantly in comprehensive research and development activities and process optimization. Expansion of product portfolios and mergers and acquisitions are key strategies adopted by major players. Yupo Corporation, PPG Industries, Inc., Agfa-Gevaert Group, and Seiko Epson Corporation are the prominent entities operating in the market.
Each of these players has been profiled in the non-tearable paper market report based on parameters such as company overview, financial overview, business strategies, product portfolio, business segments, and recent developments.
|
Attribute |
Detail |
|
Market Size Value in 2021 |
US$ 338.0 Mn |
|
Market Forecast Value in 2031 |
US$ 668.7 Mn |
|
Growth Rate (CAGR) |
6.4% |
|
Forecast Period |
2022–2031 |
|
Historical Data Available for |
2020 |
|
Quantitative Units |
US$ Mn for Value and Kilo Tons for Volume |
|
Market Analysis |
It includes cross segment analysis at Europe as well as country level. Furthermore, qualitative analysis includes drivers, restraints, opportunities, key trends, Porter’s Five Forces analysis, value chain analysis, and key trend analysis. |
|
Competition Landscape |
|
|
Format |
Electronic (PDF) + Excel |
|
Market Segmentation |
|
|
Regions Covered |
|
|
Countries Covered |
|
|
Companies Profiled |
|
|
Customization Scope |
Available upon request |
|
Pricing |
Available upon request |
The market stood at US$ 338.0 Mn in 2021
The market is expected to grow at a CAGR of 6.4% from 2022 to 2031
Growth in e-commerce industry and increase in concerns about environmental pollution
Packaging was the largest application segment that held 38% share in 2021
Asia Pacific was the most lucrative region of the non-tearable paper market in 2021
Yupo Corporation, PPG Industries, Inc., Agfa-Gevaert Group, and SEIKO EPSON CORPORATION
1. Executive Summary
1.1. Global Market Outlook
1.2. Demand Side Trends
1.3. Key Facts and Figures
1.4. Trends Impacting Market
1.5. TMR’s Growth Opportunity Wheel
2. Market Overview
2.1. Market Segmentation
2.2. Key Developments/Product Timeline
2.3. Key Market Indicators/Definitions
2.4. Market Dynamics
2.4.1. Drivers
2.4.2. Restraints
2.4.3. Opportunities
2.5. Global Non-tearable Paper Market Analysis and Forecast, 2020-2031
2.5.1. Global Non-tearable Paper Market Size (Kilo Tons)
2.5.2. Global Non-tearable Paper Market Revenue (US$ Mn)
2.6. Porter’s Five Forces Analysis
2.7. Regulatory Analysis
2.8. Value Chain Analysis
2.8.1. List of Potential Customers
2.8.2. List of Raw Materials Providers
2.8.3. List of Suppliers/Manufacturers
2.8.4. List of Dealer/Distributors
2.9. Product Specification Analysis
2.10. Overview of Manufacturing Process
2.11. Cost Structure Analysis
3. COVID-19 Impact Analysis
4. Impact of Current Geopolitical Scenario on the Market
5. Global Non-tearable Paper Market Analysis and Forecast, by Type, 2022–2031
5.1. Introduction and Definitions
5.2. Global Non-tearable Paper Market Volume (Kilo Tons) and Value (US$ Mn) Forecast, by Type, 2022–2031
5.2.1. Polyolefin (PPG)
5.2.2. High-Density Polyethylene (HDPE)
5.2.3. Polypropylene (PP)
5.2.4. Vinyl
5.2.5. Others
5.3. Global Non-tearable Paper Market Attractiveness, by Type
6. Global Non-tearable Paper Market Analysis and Forecast, by Application, 2022–2031
6.1. Introduction and Definitions
6.2. Global Non-tearable Paper Market Volume (Kilo Tons) and Value (US$ Mn) Forecast, by Application, 2022–2031
6.2.1. Packaging
6.2.2. Printing
6.2.3. Labeling
6.2.4. Posters
6.2.5. Books
6.2.6. Others
6.3. Global Non-tearable Paper Market Attractiveness, by Application
7. Global Non-tearable Paper Market Analysis and Forecast, by End-use, 2022–2031
7.1. Introduction and Definitions
7.2. Global Non-tearable Paper Market Volume (Kilo Tons) and Value (US$ Mn) Forecast, by End-use, 2022–2031
7.2.1. Advertisement
7.2.2. RFID
7.2.3. Food & Beverages
7.2.4. Paper
7.2.5. Cosmetics
7.2.6. Others
7.3. Global Non-tearable Paper Market Attractiveness, by End-use
8. Global Non-tearable Paper Market Analysis and Forecast, by Region, 2022–2031
8.1. Key Findings
8.2. Global Non-tearable Paper Market Volume (Kilo Tons) and Value (US$ Mn) Forecast, by Region, 2022–2031
8.2.1. North America
8.2.2. Europe
8.2.3. Asia Pacific
8.2.4. Latin America
8.2.5. Middle East & Africa
8.3. Global Non-tearable Paper Market Attractiveness, by Region
9. North America Non-tearable Paper Market Analysis and Forecast, 2022–2031
9.1. Key Findings
9.2. North America Non-tearable Paper Market Volume (Kilo Tons) and Value (US$ Mn) Forecast, by Type, 2022–2031
9.3. North America Non-tearable Paper Market Volume (Kilo Tons) and Value (US$ Mn) Forecast, by Application, 2022–2031
9.4. North America Non-tearable Paper Market Volume (Kilo Tons) and Value (US$ Mn) Forecast, by End-use, 2022–2031
9.5. North America Non-tearable Paper Market Volume (Kilo Tons) and Value (US$ Mn) Forecast, by Country, 2022–2031
9.5.1. U.S. Non-tearable Paper Market Volume (Kilo Tons) and Value (US$ Mn) Forecast, by Type, 2022–2031
9.5.2. U.S. Non-tearable Paper Market Volume (Kilo Tons) and Value (US$ Mn) Forecast, by Application, 2022–2031
9.5.3. U.S. Non-tearable Paper Market Volume (Kilo Tons) and Value (US$ Mn) Forecast, by End-use, 2022–2031
9.5.4. Canada Non-tearable Paper Market Volume (Kilo Tons) and Value (US$ Mn) Forecast, by Type, 2022–2031
9.5.5. Canada Non-tearable Paper Market Volume (Kilo Tons) and Value (US$ Mn) Forecast, by Application, 2022–2031
9.5.6. Canada Non-tearable Paper Market Volume (Kilo Tons) and Value (US$ Mn) Forecast, by End-use, 2022–2031
9.6. North America Non-tearable Paper Market Attractiveness Analysis
10. Europe Non-tearable Paper Market Analysis and Forecast, 2022–2031
10.1. Key Findings
10.2. Europe Non-tearable Paper Market Volume (Kilo Tons) and Value (US$ Mn) Forecast, by Type, 2022–2031
10.3. Europe Non-tearable Paper Market Volume (Kilo Tons) and Value (US$ Mn) Forecast, by Application, 2022–2031
10.4. Europe Non-tearable Paper Market Volume (Kilo Tons) and Value (US$ Mn) Forecast, by End-use, 2022–2031
10.5. Europe Non-tearable Paper Market Volume (Kilo Tons) and Value (US$ Mn) Forecast, by Country and Sub-region, 2021-2031
10.5.1. Germany Non-tearable Paper Market Volume (Kilo Tons) and Value (US$ Mn) Forecast, by Type, 2022–2031
10.5.2. Germany Non-tearable Paper Market Volume (Kilo Tons) and Value (US$ Mn) Forecast, by Application, 2022–2031
10.5.3. Germany Non-tearable Paper Market Volume (Kilo Tons) and Value (US$ Mn) Forecast, by End-use, 2022–2031
10.5.4. France Non-tearable Paper Market Volume (Kilo Tons) and Value (US$ Mn) Forecast, by Type, 2022–2031
10.5.5. France Non-tearable Paper Market Volume (Kilo Tons) and Value (US$ Mn) Forecast, by Application, 2022–2031
10.5.6. France Non-tearable Paper Market Volume (Kilo Tons) and Value (US$ Mn) Forecast, by End-use, 2022–2031
10.5.7. U.K. Non-tearable Paper Market Volume (Kilo Tons) and Value (US$ Mn) Forecast, by Type, 2022–2031
10.5.8. U.K. Non-tearable Paper Market Volume (Kilo Tons) and Value (US$ Mn) Forecast, by Application, 2022–2031
10.5.9. U.K. Non-tearable Paper Market Volume (Kilo Tons) and Value (US$ Mn) Forecast, by End-use, 2022–2031
10.5.10. Italy Non-tearable Paper Market Volume (Kilo Tons) and Value (US$ Mn) Forecast, by Type, 2022–2031
10.5.11. Italy Non-tearable Paper Market Volume (Kilo Tons) and Value (US$ Mn) Forecast, by Application, 2022–2031
10.5.12. Italy Non-tearable Paper Market Volume (Kilo Tons) and Value (US$ Mn) Forecast, by End-use, 2022–2031
10.5.13. Spain Non-tearable Paper Market Volume (Kilo Tons) and Value (US$ Mn) Forecast, by Type, 2022–2031
10.5.14. Spain Non-tearable Paper Market Volume (Kilo Tons) and Value (US$ Mn) Forecast, by Application, 2022–2031
10.5.15. Spain Non-tearable Paper Market Volume (Kilo Tons) and Value (US$ Mn) Forecast, by End-use, 2022–2031
10.5.16. Russia & CIS Non-tearable Paper Market Volume (Kilo Tons) and Value (US$ Mn) Forecast, by Type, 2022–2031
10.5.17. Russia & CIS Non-tearable Paper Market Volume (Kilo Tons) and Value (US$ Mn) Forecast, by Application, 2022–2031
10.5.18. Russia & CIS Non-tearable Paper Market Volume (Kilo Tons) and Value (US$ Mn) Forecast, by End-use, 2022–2031
10.5.19. Rest of Europe Non-tearable Paper Market Volume (Kilo Tons) and Value (US$ Mn) Forecast, by Type, 2022–2031
10.5.20. Rest of Europe Non-tearable Paper Market Volume (Kilo Tons) and Value (US$ Mn) Forecast, by Application, 2022–2031
10.5.21. Rest of Europe Non-tearable Paper Market Volume (Kilo Tons) and Value (US$ Mn) Forecast, by End-use, 2022–2031
10.6. Europe Non-tearable Paper Market Attractiveness Analysis
11. Asia Pacific Non-tearable Paper Market Analysis and Forecast, 2022–2031
11.1. Key Findings
11.2. Asia Pacific Non-tearable Paper Market Volume (Kilo Tons) and Value (US$ Mn) Forecast, by Type, 2022–2031
11.3. Asia Pacific Non-tearable Paper Market Volume (Kilo Tons) and Value (US$ Mn) Forecast, by Application, 2022–2031
11.4. Asia Pacific Non-tearable Paper Market Volume (Kilo Tons) and Value (US$ Mn) Forecast, by End-use, 2022–2031
11.5. Asia Pacific Non-tearable Paper Market Volume (Kilo Tons) and Value (US$ Mn) Forecast, by Country and Sub-region, 2021-2031
11.5.1. China Non-tearable Paper Market Volume (Kilo Tons) and Value (US$ Mn) Forecast, by Type, 2022–2031
11.5.2. China Non-tearable Paper Market Volume (Kilo Tons) and Value (US$ Mn) Forecast, by Application, 2022–2031
11.5.3. China Non-tearable Paper Market Volume (Kilo Tons) and Value (US$ Mn) Forecast, by End-use, 2022–2031
11.5.4. Japan Non-tearable Paper Market Volume (Kilo Tons) and Value (US$ Mn) Forecast, by Type, 2022–2031
11.5.5. Japan Non-tearable Paper Market Volume (Kilo Tons) and Value (US$ Mn) Forecast, by Application, 2022–2031
11.5.6. Japan Non-tearable Paper Market Volume (Kilo Tons) and Value (US$ Mn) Forecast, by End-use, 2022–2031
11.5.7. India Non-tearable Paper Market Volume (Kilo Tons) and Value (US$ Mn) Forecast, by Type, 2022–2031
11.5.8. India Non-tearable Paper Market Volume (Kilo Tons) and Value (US$ Mn) Forecast, by Application, 2022–2031
11.5.9. India Non-tearable Paper Market Volume (Kilo Tons) and Value (US$ Mn) Forecast, by End-use, 2022–2031
11.5.10. ASEAN Non-tearable Paper Market Volume (Kilo Tons) and Value (US$ Mn) Forecast, by Type, 2022–2031
11.5.11. ASEAN Non-tearable Paper Market Volume (Kilo Tons) and Value (US$ Mn) Forecast, by Application, 2022–2031
11.5.12. ASEAN Non-tearable Paper Market Volume (Kilo Tons) and Value (US$ Mn) Forecast, by End-use, 2022–2031
11.5.13. Rest of Asia Pacific Non-tearable Paper Market Volume (Kilo Tons) and Value (US$ Mn) Forecast, by Type, 2022–2031
11.5.14. Rest of Asia Pacific Non-tearable Paper Market Volume (Kilo Tons) and Value (US$ Mn) Forecast, by Application, 2022–2031
11.5.15. Rest of Asia Pacific Non-tearable Paper Market Volume (Kilo Tons) and Value (US$ Mn) Forecast, by End-use, 2022–2031
11.6. Asia Pacific Non-tearable Paper Market Attractiveness Analysis
12. Latin America Non-tearable Paper Market Analysis and Forecast, 2022–2031
12.1. Key Findings
12.2. Latin America Non-tearable Paper Market Volume (Kilo Tons) and Value (US$ Mn) Forecast, by Type, 2022–2031
12.3. Latin America Non-tearable Paper Market Volume (Kilo Tons) and Value (US$ Mn) Forecast, by Application, 2022–2031
12.4. Latin America Non-tearable Paper Market Volume (Kilo Tons) and Value (US$ Mn) Forecast, by End-use, 2022–2031
12.5. Latin America Non-tearable Paper Market Volume (Kilo Tons) and Value (US$ Mn) Forecast, by Country and Sub-region, 2021-2031
12.5.1. Brazil Non-tearable Paper Market Volume (Kilo Tons) and Value (US$ Mn) Forecast, by Type, 2022–2031
12.5.2. Brazil Non-tearable Paper Market Volume (Kilo Tons) and Value (US$ Mn) Forecast, by Application, 2022–2031
12.5.3. Brazil Non-tearable Paper Market Volume (Kilo Tons) and Value (US$ Mn) Forecast, by End-use, 2022–2031
12.5.4. Mexico Non-tearable Paper Market Volume (Kilo Tons) and Value (US$ Mn) Forecast, by Type, 2022–2031
12.5.5. Mexico Non-tearable Paper Market Volume (Kilo Tons) and Value (US$ Mn) Forecast, by Application, 2022–2031
12.5.6. Mexico Non-tearable Paper Market Volume (Kilo Tons) and Value (US$ Mn) Forecast, by End-use, 2022–2031
12.5.7. Rest of Latin America Non-tearable Paper Market Volume (Kilo Tons) and Value (US$ Mn) Forecast, by Type, 2022–2031
12.5.8. Rest of Latin America Non-tearable Paper Market Volume (Kilo Tons) and Value (US$ Mn) Forecast, by Application, 2022–2031
12.5.9. Rest of Latin America Non-tearable Paper Market Volume (Kilo Tons) and Value (US$ Mn) Forecast, by End-use, 2022–2031
12.6. Latin America Non-tearable Paper Market Attractiveness Analysis
13. Middle East & Africa Non-tearable Paper Market Analysis and Forecast, 2022–2031
13.1. Key Findings
13.2. Middle East & Africa Non-tearable Paper Market Volume (Kilo Tons) and Value (US$ Mn) Forecast, by Type, 2022–2031
13.3. Middle East & Africa Non-tearable Paper Market Volume (Kilo Tons) and Value (US$ Mn) Forecast, by Application, 2022–2031
13.4. Middle East & Africa Non-tearable Paper Market Volume (Kilo Tons) and Value (US$ Mn) Forecast, by Country and Sub-region, 2021-2031
13.4.1. GCC Non-tearable Paper Market Volume (Kilo Tons) and Value (US$ Mn) Forecast, by Type, 2022–2031
13.4.2. GCC Non-tearable Paper Market Volume (Kilo Tons) and Value (US$ Mn) Forecast, by Application, 2022–2031
13.4.3. GCC Non-tearable Paper Market Volume (Kilo Tons) and Value (US$ Mn) Forecast, by End-use, 2022–2031
13.4.4. South Africa Non-tearable Paper Market Volume (Kilo Tons) and Value (US$ Mn) Forecast, by Type, 2022–2031
13.4.5. South Africa Non-tearable Paper Market Volume (Kilo Tons) and Value (US$ Mn) Forecast, by Application, 2022–2031
13.4.6. South Africa Non-tearable Paper Market Volume (Kilo Tons) and Value (US$ Mn) Forecast, by End-use, 2022–2031
13.4.7. Rest of Middle East & Africa Non-tearable Paper Market Volume (Kilo Tons) and Value (US$ Mn) Forecast, by Type, 2022–2031
13.4.8. Rest of Middle East & Africa Non-tearable Paper Market Volume (Kilo Tons) and Value (US$ Mn) Forecast, by Application, 2022–2031
13.4.9. Rest of Middle East & Africa Non-tearable Paper Market Volume (Kilo Tons) and Value (US$ Mn) Forecast, by End-use, 2022–2031
13.5. Middle East & Africa Non-tearable Paper Market Attractiveness Analysis
14. Competition Landscape
14.1. Global Non-tearable Paper Company Market Share Analysis, 2021
14.2. Company Profiles (Details – Overview, Financials, Recent Developments, and Strategy)
14.2.1. Cosmo Films Ltd
14.2.1.1. Company Description
14.2.1.2. Business Overview
14.2.1.3. Financial Overview
14.2.1.4. Strategic Overview
14.2.2. Nan Ya Plastics Corporation
14.2.2.1. Company Description
14.2.2.2. Business Overview
14.2.2.3. Financial Overview
14.2.2.4. Strategic Overview
14.2.3. Paper N Films International
14.2.3.1. Company Description
14.2.3.2. Business Overview
14.2.3.3. Financial Overview
14.2.3.4. Strategic Overview
14.2.4. Printina
14.2.4.1. Company Description
14.2.4.2. Business Overview
14.2.4.3. Financial Overview
14.2.4.4. Strategic Overview
14.2.5. ARJOBEX SAS
14.2.5.1. Company Description
14.2.5.2. Business Overview
14.2.5.3. Financial Overview
14.2.5.4. Strategic Overview
14.2.6. Hop Industries Corporation (HIC)
14.2.6.1. Company Description
14.2.6.2. Business Overview
14.2.6.3. Financial Overview
14.2.6.4. Strategic Overview
14.2.7. Yupo Corporation
14.2.7.1. Company Description
14.2.7.2. Business Overview
14.2.7.3. Financial Overview
14.2.7.4. Strategic Overview
14.2.8. PPG Industries, Inc.
14.2.8.1. Company Description
14.2.8.2. Business Overview
14.2.8.3. Financial Overview
14.2.8.4. Strategic Overview
14.2.9. SEIKO EPSON CORPORATION
14.2.9.1. Company Description
14.2.9.2. Business Overview
14.2.9.3. Financial Overview
14.2.9.4. Strategic Overview
14.2.10. Agfa-Gevaert Group
14.2.10.1. Company Description
14.2.10.2. Business Overview
14.2.10.3. Financial Overview
14.2.10.4. Strategic Overview
14.2.11. American Profol, Inc.
14.2.11.1. Company Description
14.2.11.2. Business Overview
14.2.11.3. Financial Overview
14.2.11.4. Strategic Overview
14.2.12. Relyco Sales, Inc.
14.2.12.1. Company Description
14.2.12.2. Business Overview
14.2.12.3. Financial Overview
14.2.12.4. Strategic Overview
15. Primary Research: Key Insights
16. Appendix
List of Tables
Table 1: Global Non-tearable Paper Market Volume (Kilo Tons) Forecast, by Type, 2022–2031
Table 2: Global Non-tearable Paper Market Value (US$ Mn) Forecast, by Type, 2022–2031
Table 3: Global Non-tearable Paper Market Volume (Kilo Tons) Forecast, by Application, 2022–2031
Table 4: Global Non-tearable Paper Market Value (US$ Mn) Forecast, by Application, 2022–2031
Table 5: Global Non-tearable Paper Market Volume (Kilo Tons) Forecast, by End-use 2022–2031
Table 6: Global Non-tearable Paper Market Value (US$ Mn) Forecast, by End-use 2022–2031
Table 7: Global Non-tearable Paper Market Volume (Kilo Tons) Forecast, by Region, 2022–2031
Table 8: Global Non-tearable Paper Market Value (US$ Mn) Forecast, by Region, 2022–2031
Table 9: North America Non-tearable Paper Market Volume (Kilo Tons) Forecast, by Type, 2022–2031
Table 10: North America Non-tearable Paper Market Value (US$ Mn) Forecast, by Type, 2022–2031
Table 11: North America Non-tearable Paper Market Volume (Kilo Tons) Forecast, by Application, 2022–2031
Table 12: North America Non-tearable Paper Market Value (US$ Mn) Forecast, by Application, 2022–2031
Table 13: North America Non-tearable Paper Market Volume (Kilo Tons) Forecast, by End-use 2022–2031
Table 14: North America Non-tearable Paper Market Value (US$ Mn) Forecast, by End-use 2022–2031
Table 15: North America Non-tearable Paper Market Volume (Kilo Tons) Forecast, by Country, 2022–2031
Table 16: North America Non-tearable Paper Market Value (US$ Mn) Forecast, by Country, 2022–2031
Table 17: U.S. Non-tearable Paper Market Volume (Kilo Tons) Forecast, by Type, 2022–2031
Table 18: U.S. Non-tearable Paper Market Value (US$ Mn) Forecast, by Type, 2022–2031
Table 19: U.S. Non-tearable Paper Market Volume (Kilo Tons) Forecast, by Application, 2022–2031
Table 20: U.S. Non-tearable Paper Market Value (US$ Mn) Forecast, by Application, 2022–2031
Table 21: U.S. Non-tearable Paper Market Volume (Kilo Tons) Forecast, by End-use 2022–2031
Table 22: U.S. Non-tearable Paper Market Value (US$ Mn) Forecast, by End-use 2022–2031
Table 23: Canada Non-tearable Paper Market Volume (Kilo Tons) Forecast, by Type, 2022–2031
Table 24: Canada Non-tearable Paper Market Value (US$ Mn) Forecast, by Type, 2022–2031
Table 25: Canada Non-tearable Paper Market Volume (Kilo Tons) Forecast, by Application, 2022–2031
Table 26: Canada Non-tearable Paper Market Value (US$ Mn) Forecast, by Application, 2022–2031
Table 27: Canada Non-tearable Paper Market Volume (Kilo Tons) Forecast, by End-use 2022–2031
Table 28: Canada Non-tearable Paper Market Value (US$ Mn) Forecast, by End-use 2022–2031
Table 29: Europe Non-tearable Paper Market Volume (Kilo Tons) Forecast, by Type, 2022–2031
Table 30: Europe Non-tearable Paper Market Value (US$ Mn) Forecast, by Type, 2022–2031
Table 31: Europe Non-tearable Paper Market Volume (Kilo Tons) Forecast, by Application, 2022–2031
Table 32: Europe Non-tearable Paper Market Value (US$ Mn) Forecast, by Application, 2022–2031
Table 33: Europe Non-tearable Paper Market Volume (Kilo Tons) Forecast, by End-use 2022–2031
Table 34: Europe Non-tearable Paper Market Value (US$ Mn) Forecast, by End-use 2022–2031
Table 35: Europe Non-tearable Paper Market Volume (Kilo Tons) Forecast, by Country and Sub-region, 2022–2031
Table 36: Europe Non-tearable Paper Market Value (US$ Mn) Forecast, by Country and Sub-region, 2022–2031
Table 37: Germany Non-tearable Paper Market Volume (Kilo Tons) Forecast, by Type, 2022–2031
Table 38: Germany Non-tearable Paper Market Value (US$ Mn) Forecast, by Type, 2022–2031
Table 39: Germany Non-tearable Paper Market Volume (Kilo Tons) Forecast, by Application, 2022–2031
Table 40: Germany Non-tearable Paper Market Value (US$ Mn) Forecast, by Application, 2022–2031
Table 41: Germany Non-tearable Paper Market Volume (Kilo Tons) Forecast, by End-use 2022–2031
Table 42: Germany Non-tearable Paper Market Value (US$ Mn) Forecast, by End-use 2022–2031
Table 43: France Non-tearable Paper Market Volume (Kilo Tons) Forecast, by Type, 2022–2031
Table 44: France Non-tearable Paper Market Value (US$ Mn) Forecast, by Type, 2022–2031
Table 45: France Non-tearable Paper Market Volume (Kilo Tons) Forecast, by Application, 2022–2031
Table 46: France Non-tearable Paper Market Value (US$ Mn) Forecast, by Application, 2022–2031
Table 47: France Non-tearable Paper Market Volume (Kilo Tons) Forecast, by End-use 2022–2031
Table 48: France Non-tearable Paper Market Value (US$ Mn) Forecast, by End-use 2022–2031
Table 49: U.K. Non-tearable Paper Market Volume (Kilo Tons) Forecast, by Type, 2022–2031
Table 50: U.K. Non-tearable Paper Market Value (US$ Mn) Forecast, by Type, 2022–2031
Table 51: U.K. Non-tearable Paper Market Volume (Kilo Tons) Forecast, by Application, 2022–2031
Table 52: U.K. Non-tearable Paper Market Value (US$ Mn) Forecast, by Application, 2022–2031
Table 53: U.K. Non-tearable Paper Market Volume (Kilo Tons) Forecast, by End-use 2022–2031
Table 54: U.K. Non-tearable Paper Market Value (US$ Mn) Forecast, by End-use 2022–2031
Table 55: Italy Non-tearable Paper Market Volume (Kilo Tons) Forecast, by Type, 2022–2031
Table 56: Italy Non-tearable Paper Market Value (US$ Mn) Forecast, by Type, 2022–2031
Table 57: Italy Non-tearable Paper Market Volume (Kilo Tons) Forecast, by Application, 2022–2031
Table 58: Italy Non-tearable Paper Market Value (US$ Mn) Forecast, by Application, 2022–2031
Table 59: Italy Non-tearable Paper Market Volume (Kilo Tons) Forecast, by End-use 2022–2031
Table 60: Italy Non-tearable Paper Market Value (US$ Mn) Forecast, by End-use 2022–2031
Table 61: Spain Non-tearable Paper Market Volume (Kilo Tons) Forecast, by Type, 2022–2031
Table 62: Spain Non-tearable Paper Market Value (US$ Mn) Forecast, by Type, 2022–2031
Table 63: Spain Non-tearable Paper Market Volume (Kilo Tons) Forecast, by Application, 2022–2031
Table 64: Spain Non-tearable Paper Market Value (US$ Mn) Forecast, by Application, 2022–2031
Table 65: Spain Non-tearable Paper Market Volume (Kilo Tons) Forecast, by End-use 2022–2031
Table 66: Spain Non-tearable Paper Market Value (US$ Mn) Forecast, by End-use 2022–2031
Table 67: Russia & CIS Non-tearable Paper Market Volume (Kilo Tons) Forecast, by Type, 2022–2031
Table 68: Russia & CIS Non-tearable Paper Market Value (US$ Mn) Forecast, by Type, 2022–2031
Table 69: Russia & CIS Non-tearable Paper Market Volume (Kilo Tons) Forecast, by Application, 2022–2031
Table 70: Russia & CIS Non-tearable Paper Market Value (US$ Mn) Forecast, by Application, 2022–2031
Table 71: Russia & CIS Non-tearable Paper Market Volume (Kilo Tons) Forecast, by End-use 2022–2031
Table 72: Russia & CIS Non-tearable Paper Market Value (US$ Mn) Forecast, by End-use 2022–2031
Table 73: Rest of Europe Non-tearable Paper Market Volume (Kilo Tons) Forecast, by Type, 2022–2031
Table 74: Rest of Europe Non-tearable Paper Market Value (US$ Mn) Forecast, by Type, 2022–2031
Table 75: Rest of Europe Non-tearable Paper Market Volume (Kilo Tons) Forecast, by Application, 2022–2031
Table 76: Rest of Europe Non-tearable Paper Market Value (US$ Mn) Forecast, by Application, 2022–2031
Table 77: Rest of Europe Non-tearable Paper Market Volume (Kilo Tons) Forecast, by End-use 2022–2031
Table 78: Rest of Europe Non-tearable Paper Market Value (US$ Mn) Forecast, by End-use 2022–2031
Table 79: Asia Pacific Non-tearable Paper Market Volume (Kilo Tons) Forecast, by Type, 2022–2031
Table 80: Asia Pacific Non-tearable Paper Market Value (US$ Mn) Forecast, by Type, 2022–2031
Table 81: Asia Pacific Non-tearable Paper Market Volume (Kilo Tons) Forecast, by Application, 2022–2031
Table 82: Asia Pacific Non-tearable Paper Market Value (US$ Mn) Forecast, by Application, 2022–2031
Table 83: Asia Pacific Non-tearable Paper Market Volume (Kilo Tons) Forecast, by End-use 2022–2031
Table 84: Asia Pacific Non-tearable Paper Market Value (US$ Mn) Forecast, by End-use 2022–2031
Table 85: Asia Pacific Non-tearable Paper Market Volume (Kilo Tons) Forecast, by Country and Sub-region, 2022–2031
Table 86: Asia Pacific Non-tearable Paper Market Value (US$ Mn) Forecast, by Country and Sub-region, 2022–2031
Table 87: China Non-tearable Paper Market Volume (Kilo Tons) Forecast, by Type, 2022–2031
Table 88: China Non-tearable Paper Market Value (US$ Mn) Forecast, by Type, 2022–2031
Table 89: China Non-tearable Paper Market Volume (Kilo Tons) Forecast, by Application, 2022–2031
Table 90: China Non-tearable Paper Market Value (US$ Mn) Forecast, by Application, 2022–2031
Table 91: China Non-tearable Paper Market Volume (Kilo Tons) Forecast, by End-use 2022–2031
Table 92: China Non-tearable Paper Market Value (US$ Mn) Forecast, by End-use 2022–2031
Table 93: Japan Non-tearable Paper Market Volume (Kilo Tons) Forecast, by Type, 2022–2031
Table 94: Japan Non-tearable Paper Market Value (US$ Mn) Forecast, by Type, 2022–2031
Table 95: Japan Non-tearable Paper Market Volume (Kilo Tons) Forecast, by Application, 2022–2031
Table 96: Japan Non-tearable Paper Market Value (US$ Mn) Forecast, by Application, 2022–2031
Table 97: Japan Non-tearable Paper Market Volume (Kilo Tons) Forecast, by End-use 2022–2031
Table 98: Japan Non-tearable Paper Market Value (US$ Mn) Forecast, by End-use 2022–2031
Table 99: India Non-tearable Paper Market Volume (Kilo Tons) Forecast, by Type, 2022–2031
Table 100: India Non-tearable Paper Market Value (US$ Mn) Forecast, by Type, 2022–2031
Table 101: India Non-tearable Paper Market Volume (Kilo Tons) Forecast, by Application, 2022–2031
Table 102: India Non-tearable Paper Market Value (US$ Mn) Forecast, by Application, 2022–2031
Table 103: India Non-tearable Paper Market Volume (Kilo Tons) Forecast, by End-use 2022–2031
Table 104: India Non-tearable Paper Market Value (US$ Mn) Forecast, by End-use 2022–2031
Table 105: ASEAN Non-tearable Paper Market Volume (Kilo Tons) Forecast, by Type, 2022–2031
Table 106: ASEAN Non-tearable Paper Market Value (US$ Mn) Forecast, by Type, 2022–2031
Table 107: ASEAN Non-tearable Paper Market Volume (Kilo Tons) Forecast, by Application, 2022–2031
Table 108: ASEAN Non-tearable Paper Market Value (US$ Mn) Forecast, by Application, 2022–2031
Table 109: ASEAN Non-tearable Paper Market Volume (Kilo Tons) Forecast, by End-use 2022–2031
Table 110: ASEAN Non-tearable Paper Market Value (US$ Mn) Forecast, by End-use 2022–2031
Table 111: Rest of Asia Pacific Non-tearable Paper Market Volume (Kilo Tons) Forecast, by Type, 2022–2031
Table 112: Rest of Asia Pacific Non-tearable Paper Market Value (US$ Mn) Forecast, by Type, 2022–2031
Table 113: Rest of Asia Pacific Non-tearable Paper Market Volume (Kilo Tons) Forecast, by Application, 2022–2031
Table 114: Rest of Asia Pacific Non-tearable Paper Market Value (US$ Mn) Forecast, by Application, 2022–2031
Table 115: Rest of Asia Pacific Non-tearable Paper Market Volume (Kilo Tons) Forecast, by End-use 2022–2031
Table 116: Rest of Asia Pacific Non-tearable Paper Market Value (US$ Mn) Forecast, by End-use 2022–2031
Table 117: Latin America Non-tearable Paper Market Volume (Kilo Tons) Forecast, by Type, 2022–2031
Table 118: Latin America Non-tearable Paper Market Value (US$ Mn) Forecast, by Type, 2022–2031
Table 119: Latin America Non-tearable Paper Market Volume (Kilo Tons) Forecast, by Application, 2022–2031
Table 120: Latin America Non-tearable Paper Market Value (US$ Mn) Forecast, by Application, 2022–2031
Table 121: Latin America Non-tearable Paper Market Volume (Kilo Tons) Forecast, by End-use 2022–2031
Table 122: Latin America Non-tearable Paper Market Value (US$ Mn) Forecast, by End-use 2022–2031
Table 123: Latin America Non-tearable Paper Market Volume (Kilo Tons) Forecast, by Country and Sub-region, 2022–2031
Table 124: Latin America Non-tearable Paper Market Value (US$ Mn) Forecast, by Country and Sub-region, 2022–2031
Table 125: Brazil Non-tearable Paper Market Volume (Kilo Tons) Forecast, by Type, 2022–2031
Table 126: Brazil Non-tearable Paper Market Value (US$ Mn) Forecast, by Type, 2022–2031
Table 127: Brazil Non-tearable Paper Market Volume (Kilo Tons) Forecast, by Application, 2022–2031
Table 128: Brazil Non-tearable Paper Market Value (US$ Mn) Forecast, by Application, 2022–2031
Table 129: Brazil Non-tearable Paper Market Volume (Kilo Tons) Forecast, by End-use 2022–2031
Table 130: Brazil Non-tearable Paper Market Value (US$ Mn) Forecast, by End-use 2022–2031
Table 131: Mexico Non-tearable Paper Market Volume (Kilo Tons) Forecast, by Type, 2022–2031
Table 132: Mexico Non-tearable Paper Market Value (US$ Mn) Forecast, by Type, 2022–2031
Table 133: Mexico Non-tearable Paper Market Volume (Kilo Tons) Forecast, by Application, 2022–2031
Table 134: Mexico Non-tearable Paper Market Value (US$ Mn) Forecast, by Application, 2022–2031
Table 135: Mexico Non-tearable Paper Market Volume (Kilo Tons) Forecast, by End-use 2022–2031
Table 136: Mexico Non-tearable Paper Market Value (US$ Mn) Forecast, by End-use 2022–2031
Table 137: Rest of Latin America Non-tearable Paper Market Volume (Kilo Tons) Forecast, by Type, 2022–2031
Table 138: Rest of Latin America Non-tearable Paper Market Value (US$ Mn) Forecast, by Type, 2022–2031
Table 139: Rest of Latin America Non-tearable Paper Market Volume (Kilo Tons) Forecast, by Application, 2022–2031
Table 140: Rest of Latin America Non-tearable Paper Market Value (US$ Mn) Forecast, by Application, 2022–2031
Table 141: Rest of Latin America Non-tearable Paper Market Volume (Kilo Tons) Forecast, by End-use 2022–2031
Table 142: Rest of Latin America Non-tearable Paper Market Value (US$ Mn) Forecast, by End-use 2022–2031
Table 143: Middle East & Africa Non-tearable Paper Market Volume (Kilo Tons) Forecast, by Type, 2022–2031
Table 144: Middle East & Africa Non-tearable Paper Market Value (US$ Mn) Forecast, by Type, 2022–2031
Table 145: Middle East & Africa Non-tearable Paper Market Volume (Kilo Tons) Forecast, by Application, 2022–2031
Table 146: Middle East & Africa Non-tearable Paper Market Value (US$ Mn) Forecast, by Application, 2022–2031
Table 147: Middle East & Africa Non-tearable Paper Market Volume (Kilo Tons) Forecast, by End-use, 2022–2031
Table 148: Middle East & Africa Non-tearable Paper Market Value (US$ Mn) Forecast, by End-use, 2022–2031
Table 149: Middle East & Africa Non-tearable Paper Market Volume (Kilo Tons) Forecast, by Country and Sub-region, 2022–2031
Table 150: Middle East & Africa Non-tearable Paper Market Value (US$ Mn) Forecast, by Country and Sub-region, 2022–2031
Table 151: GCC Non-tearable Paper Market Volume (Kilo Tons) Forecast, by Type, 2022–2031
Table 152: GCC Non-tearable Paper Market Value (US$ Mn) Forecast, by Type, 2022–2031
Table 153: GCC Non-tearable Paper Market Volume (Kilo Tons) Forecast, by Application, 2022–2031
Table 154: GCC Non-tearable Paper Market Value (US$ Mn) Forecast, by Application, 2022–2031
Table 155: GCC Non-tearable Paper Market Volume (Kilo Tons) Forecast, by End-use 2022–2031
Table 156: GCC Non-tearable Paper Market Value (US$ Mn) Forecast, by End-use 2022–2031
Table 157: South Africa Non-tearable Paper Market Volume (Kilo Tons) Forecast, by Type, 2022–2031
Table 158: South Africa Non-tearable Paper Market Value (US$ Mn) Forecast, by Type, 2022–2031
Table 159: South Africa Non-tearable Paper Market Volume (Kilo Tons) Forecast, by Application, 2022–2031
Table 160: South Africa Non-tearable Paper Market Value (US$ Mn) Forecast, by Application, 2022–2031
Table 161: South Africa Non-tearable Paper Market Volume (Kilo Tons) Forecast, by End-use 2022–2031
Table 162: South Africa Non-tearable Paper Market Value (US$ Mn) Forecast, by End-use 2022–2031
Table 163: Rest of Middle East & Africa Non-tearable Paper Market Volume (Kilo Tons) Forecast, by Type, 2022–2031
Table 164: Rest of Middle East & Africa Non-tearable Paper Market Value (US$ Mn) Forecast, by Type, 2022–2031
Table 165: Rest of Middle East & Africa Non-tearable Paper Market Volume (Kilo Tons) Forecast, by Application, 2022–2031
Table 166: Rest of Middle East & Africa Non-tearable Paper Market Value (US$ Mn) Forecast, by Application, 2022–2031
Table 167: Rest of Middle East & Africa Non-tearable Paper Market Volume (Kilo Tons) Forecast, by End-use 2022–2031
Table 168: Rest of Middle East & Africa Non-tearable Paper Market Value (US$ Mn) Forecast, by End-use 2022–2031
List of Figures
Figure 1: Global Non-tearable Paper Market Volume Share Analysis, by Type, 2021, 2025, and 2031
Figure 2: Global Non-tearable Paper Market Attractiveness, by Type
Figure 3: Global Non-tearable Paper Market Volume Share Analysis, by Application, 2021, 2025, and 2031
Figure 4: Global Non-tearable Paper Market Attractiveness, by Application
Figure 5: Global Non-tearable Paper Market Volume Share Analysis, by End-use, 2021, 2025, and 2031
Figure 6: Global Non-tearable Paper Market Attractiveness, by End-use
Figure 7: Global Non-tearable Paper Market Volume Share Analysis, by Region, 2021, 2025, and 2031
Figure 8: Global Non-tearable Paper Market Attractiveness, by Region
Figure 9: North America Non-tearable Paper Market Volume Share Analysis, by Type, 2021, 2025, and 2031
Figure 10: North America Non-tearable Paper Market Attractiveness, by Type
Figure 11: North America Non-tearable Paper Market Volume Share Analysis, by Application, 2021, 2025, and 2031
Figure 12: North America Non-tearable Paper Market Attractiveness, by Application
Figure 13: North America Non-tearable Paper Market Volume Share Analysis, by End-use, 2021, 2025, and 2031
Figure 14: North America Non-tearable Paper Market Attractiveness, by End-use
Figure 15: North America Non-tearable Paper Market Volume Share Analysis, by Country, 2021, 2025, and 2031
Figure 16: North America Non-tearable Paper Market Attractiveness, by Country
Figure 17: Europe Non-tearable Paper Market Volume Share Analysis, by Type, 2021, 2025, and 2031
Figure 18: Europe Non-tearable Paper Market Attractiveness, by Type
Figure 19: Europe Non-tearable Paper Market Volume Share Analysis, by Application, 2021, 2025, and 2031
Figure 20: Europe Non-tearable Paper Market Attractiveness, by Application
Figure 21: Europe Non-tearable Paper Market Volume Share Analysis, by End-use, 2021, 2025, and 2031
Figure 22: Europe Non-tearable Paper Market Attractiveness, by End-use
Figure 23: Europe Non-tearable Paper Market Volume Share Analysis, by Country and Sub-region, 2021, 2025, and 2031
Figure 24: Europe Non-tearable Paper Market Attractiveness, by Country and Sub-region
Figure 25: Asia Pacific Non-tearable Paper Market Volume Share Analysis, by Type, 2021, 2025, and 2031
Figure 26: Asia Pacific Non-tearable Paper Market Attractiveness, by Type
Figure 27: Asia Pacific Non-tearable Paper Market Volume Share Analysis, by Application, 2021, 2025, and 2031
Figure 28: Asia Pacific Non-tearable Paper Market Attractiveness, by Application
Figure 29: Asia Pacific Non-tearable Paper Market Volume Share Analysis, by End-use, 2021, 2025, and 2031
Figure 30: Asia Pacific Non-tearable Paper Market Attractiveness, by End-use
Figure 31: Asia Pacific Non-tearable Paper Market Volume Share Analysis, by Country and Sub-region, 2021, 2025, and 2031
Figure 32: Asia Pacific Non-tearable Paper Market Attractiveness, by Country and Sub-region
Figure 33: Latin America Non-tearable Paper Market Volume Share Analysis, by Type, 2021, 2025, and 2031
Figure 34: Latin America Non-tearable Paper Market Attractiveness, by Type
Figure 35: Latin America Non-tearable Paper Market Volume Share Analysis, by Application, 2021, 2025, and 2031
Figure 36: Latin America Non-tearable Paper Market Attractiveness, by Application
Figure 37: Latin America Non-tearable Paper Market Volume Share Analysis, by End-use, 2021, 2025, and 2031
Figure 38: Latin America Non-tearable Paper Market Attractiveness, by End-use
Figure 39: Latin America Non-tearable Paper Market Volume Share Analysis, by Country and Sub-region, 2021, 2025, and 2031
Figure 40: Latin America Non-tearable Paper Market Attractiveness, by Country and Sub-region
Figure 41: Middle East & Africa Non-tearable Paper Market Volume Share Analysis, by Type, 2021, 2025, and 2031
Figure 42: Middle East & Africa Non-tearable Paper Market Attractiveness, by Type
Figure 43: Middle East & Africa Non-tearable Paper Market Volume Share Analysis, by Application, 2021, 2025, and 2031
Figure 44: Middle East & Africa Non-tearable Paper Market Attractiveness, by Application
Figure 45: Middle East & Africa Non-tearable Paper Market Volume Share Analysis, by End-use, 2021, 2025, and 2031
Figure 46: Middle East & Africa Non-tearable Paper Market Attractiveness, by End-use
Figure 47: Middle East & Africa Non-tearable Paper Market Volume Share Analysis, by Country and Sub-region, 2021, 2025, and 2031
Figure 48: Middle East & Africa Non-tearable Paper Market Attractiveness, by Country and Sub-region
Copyright © Transparency Market Research, Inc. All Rights reserved
Trust Online

Non-tearable Paper Market