
Reports
Reports
Value chains in the chemicals sector are being reconfigured due to changing consumer demands and economic and geopolitical shifts during the ongoing COVID-19 outbreak. Cash-rich companies in the nitrobenzene market are giving a tough competition to medium- and small-scale market players by introducing new technologies in terms of manufacturing, research, and packaging. Stakeholders are focusing in positive or limited negative impact industries such as pharmaceuticals, agriculture, and construction to keep the economies running.
Companies in the nitrobenzene market are striking the right balance for supply chain resilience and other business costs. Stakeholders are entering into collaboration programs to reconfigure and relocate supply chains in line with structural market changes. Due to the unprecedented spike of coronavirus cases in the U.S., stakeholders are strategizing response plans to prepare for uncertain market changes.
It has been found that nitrobenzene and its derivatives are highly toxic compounds that are released into the environment by anthropogenic activities. Such findings are affecting growth of the nitrobenzene market. Hence, stakeholders are increasing R&D in microbial degradation of nitrobenzene. This degradation occurs via either a reductive mode or an oxidative mode. Thus, deep research for microbial degradation of nitrobenzene is required to reduce environmental impact pertaining to nitrobenzene and its derivatives.
Chemical companies are establishing stable revenue streams in pharmaceutical applications by using nitrobenzene in the production of analgesic acetaminophen or paracetamol.
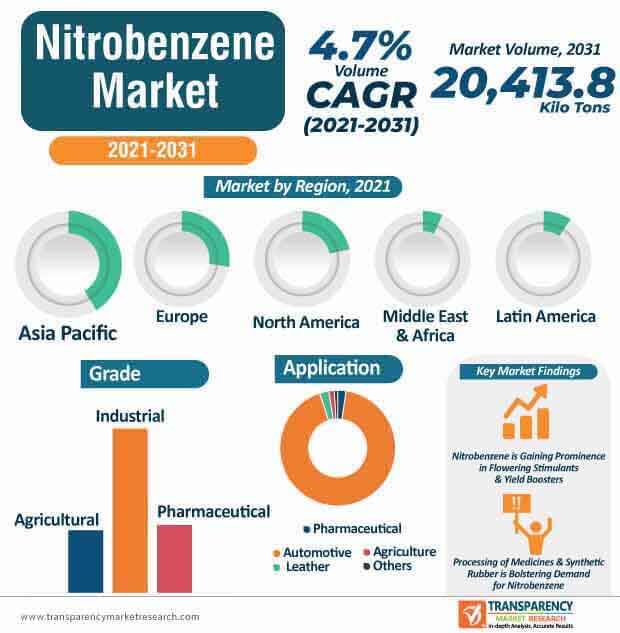
Fertilizers are creating revenue opportunities for manufacturers in the nitrobenzene market. Gupta Agro Enterprises - an agricultural products wholesaler, is taking help of Amazon to expand its supply through eCommerce for Boom Flower plant energizer that helps to maximize yields. Manufacturers are taking cues from such manufacturers to boost the production of flowering stimulants and yield boosters.
The nitrobenzene market is projected to expand at a modest CAGR of 5.3% during the forecast period. Manufacturers are increasing their production in flowering stimulants that are compatible with pesticides and fungicides. They are also increasing focus in foliar applications for major agricultural crops.
Leather dressings and floor polishes are driving the demand for nitrobenzene. Nitrobenzene is used to minimize the smell of shoe polishes. Manufacturers are making sure of high quality standards to ensure the effectiveness and purity of nitrobenzene.
The nitrobenzene market is slated to cross the valuation of US$ 19.86 Bn by 2031. Manufacturers in the nitrobenzene market are expanding their business through lubricants. Solvo Chem - an India-based chemical wholesaler is complying with high quality standards to offer nitrobenzene and its derivatives to end users in the leather industry. Nitrobenzene is being increasingly used for masking harmful odors emitting from shoes, floor polisher, and leather. The processing of lubricating oils, medicines, and synthetic rubber is bolstering the demand for nitrobenzene.
Nitrobenzene is being primarily used for the manufacturing of aniline, which is used in the manufacture of polyurethane. Dyes, drugs, and pesticides are creating income sources for manufacturers in the nitrobenzene market. Regenesis - a specialist in environmental remediation research, is building a comprehensive portfolio in nitrobenzene products such as PlumeStop and RegenOx that have been classified by the Environmental Protection Agency (EPA) as Group D, which reduces the risks of human carcinogenicity.
Acute and chronic inhalation or exposure toward nitrobenzene can result in dizziness, disturbed vision, and coma in extreme cases. Hence, manufacturers in the nitrobenzene market are adhering to regulations stated by the EPA to boost use of nitrobenzene in lubricating oils, synthetic rubber, and pesticides. Thus, specialists in environmental remediation research are playing a key role in reducing harmful effects of nitrobenzene in humans.
Analysts’ Viewpoint
Small- and medium-scale companies in the nitrobenzene market are analyzing their competitive cost position with respect to cash-rich companies in order to grab business opportunities during the COVID-19 outbreak. Manufacturers are increasing the production of organic flower boosters that are made using nitrobenzene and other natural extracts. However, anthropogenic activities associated to nitrobenzene are causing environmental damage. Hence, stakeholders should increase their focus in microbial degradation of nitrobenzene to reduce environmental impact of nitrobenzene and its derivatives. Specialists in environmental remediation research are stepping in to help develop nitrobenzene products as per requirements of the EPA. Manufacturers are taking maintenance measures such as storing nitrobenzene in severely sealed tanks to avoid accidents.
|
Attribute |
Details |
|
Market Size Value in 2020 |
US$ 11.31 Bn |
|
Market Forecast Value in 2031 |
US$ 19.86 Bn |
|
Growth Rate (CAGR) |
5.3% |
|
Forecast Period |
2021-2031 |
|
Quantitative Units |
US$ Mn for Value and Kilo Tons for Volume |
|
Market Analysis |
It includes cross segment analysis at global as well as regional level. Furthermore, qualitative analysis includes drivers, restraints, opportunities, key trends, Porters Five Forces analysis, supply chain analysis, parent industry overview, etc. |
|
Competition Landscape |
|
|
Format |
Electronic (PDF) + Excel |
|
Market Segmentation |
|
|
Regions Covered |
|
|
Key Countries Covered |
|
|
Companies Profiled |
|
|
Customization Scope |
Available upon Request |
|
Pricing |
Available upon Request |
1. Executive Summary
1.1. Nitrobenzene Market Snapshot
1.2. Current Market and Future Potential
2. Market Overview
2.1. Market Segmentation
2.2. Market Indicators
2.3. Market Dynamics
2.3.1. Drivers
2.3.2. Restraints
2.3.3. Opportunities
2.4. Porter’s Five Forces Analysis
2.5. Regulatory Analysis
2.6. Value Chain Analysis
2.6.1. List of Potential Customers
2.6.2. List of Suppliers/Manufacturers
3. COVID-19 Impact Analysis
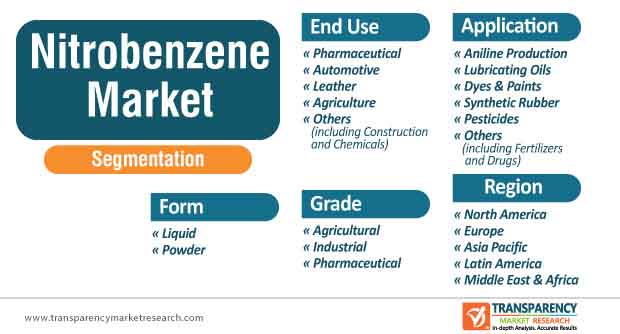
4. Global Nitrobenzene Market Analysis and Forecast, by Form, 2020–2031
4.1. Introduction and Definitions
4.2. Global Nitrobenzene Market Volume (Kilo Tons) and Value (US$ Mn) Forecast, by Form, 2020–2031
4.2.1. Liquid
4.2.2. Powder
4.3. Global Nitrobenzene Market Attractiveness, by Form
5. Global Nitrobenzene Market Analysis and Forecast, Grade, 2020–2031
5.1. Introduction and Definitions
5.2. Global Nitrobenzene Market Volume (Kilo Tons) and Value (US$ Mn) Forecast, by Grade, 2020–2031
5.2.1. Agricultural
5.2.2. Industrial
5.2.3. Pharmaceutical
5.3. Global Nitrobenzene Market Attractiveness, by Grade
6. Global Nitrobenzene Market Analysis and Forecast, by Application, 2020–2031
6.1. Introduction and Definitions
6.2. Global Nitrobenzene Market Volume (Kilo Tons) and Value (US$ Mn) Forecast, by Application, 2020–2031
6.2.1. Aniline Production
6.2.2. Lubricating Oils
6.2.3. Dyes & Paints
6.2.4. Synthetic Rubber
6.2.5. Pesticides
6.2.6. Others
6.3. Global Nitrobenzene Market Attractiveness, by Application
7. Global Nitrobenzene Market Analysis and Forecast, by End-use, 2020–2031
7.1. Introduction and Definitions
7.2. Global Nitrobenzene Market Volume (Kilo Tons) and Value (US$ Mn) Forecast, by End-use, 2020–2031
7.2.1. Pharmaceutical
7.2.2. Automotive
7.2.3. Leather
7.2.4. Agriculture
7.2.5. Others
7.3. Global Nitrobenzene Market Attractiveness, by End-use
8. Global Nitrobenzene Market Analysis and Forecast, by Region, 2020–2031
8.1. Key Findings
8.2. Global Nitrobenzene Market Volume (Kilo Tons) and Value (US$ Mn) Forecast, by Region, 2020–2031
8.2.1. North America
8.2.2. Europe
8.2.3. Asia Pacific
8.2.4. Latin America
8.2.5. Middle East & Africa
8.3. Global Nitrobenzene Market Attractiveness, by Region
9. North America Nitrobenzene Market Analysis and Forecast, 2020–2031
9.1. Key Findings
9.2. North America Nitrobenzene Market Volume (Kilo Tons) and Value (US$ Mn) Forecast, by Form, 2020–2031
9.3. North America Nitrobenzene Market Volume (Kilo Tons) and Value (US$ Mn) Forecast, by Grade, 2020–2031
9.4. North America Nitrobenzene Market Volume (Kilo Tons) and Value (US$ Mn) Forecast, by Application, 2020–2031
9.5. North America Nitrobenzene Market Volume (Kilo Tons) and Value (US$ Mn) Forecast, by End-use, 2020–2031
9.6. North America Nitrobenzene Market Volume (Kilo Tons) and Value (US$ Mn) Forecast, by Country, 2020–2031
9.6.1. U.S. Nitrobenzene Market Volume (Kilo Tons) and Value (US$ Mn) Forecast, by Form, 2020–2031
9.6.2. U.S. Nitrobenzene Market Volume (Kilo Tons) and Value (US$ Mn) Forecast, by Grade, 2020–2031
9.6.3. U.S. Nitrobenzene Market Volume (Kilo Tons) and Value (US$ Mn) Forecast, by Application, 2020–2031
9.6.4. U.S. Nitrobenzene Market Volume (Kilo Tons) and Value (US$ Mn) Forecast, by End-use, 2020–2031
9.6.5. Canada Nitrobenzene Market Volume (Kilo Tons) and Value (US$ Mn) Forecast, by Form, 2020–2031
9.6.6. Canada Nitrobenzene Market Volume (Kilo Tons) and Value (US$ Mn) Forecast, by Grade, 2020–2031
9.6.7. Canada Nitrobenzene Market Volume (Kilo Tons) and Value (US$ Mn) Forecast, by Application, 2020–2031
9.6.8. Canada Nitrobenzene Market Volume (Kilo Tons) and Value (US$ Mn) Forecast, by End-use, 2020–2031
9.7. North America Nitrobenzene Market Attractiveness Analysis
10. Europe Nitrobenzene Market Analysis and Forecast, 2020–2031
10.1. Key Findings
10.2. Europe Nitrobenzene Market Volume (Kilo Tons) and Value (US$ Mn) Forecast, by Form, 2020–2031
10.3. Europe Nitrobenzene Market Volume (Kilo Tons) and Value (US$ Mn) Forecast, by Grade, 2020–2031
10.4. Europe Nitrobenzene Market Volume (Kilo Tons) and Value (US$ Mn) Forecast, by Application, 2020–2031
10.5. Europe Nitrobenzene Market Volume (Kilo Tons) and Value (US$ Mn) Forecast, by End-use, 2020–2031
10.6. Europe Nitrobenzene Market Volume (Kilo Tons) and Value (US$ Mn) Forecast, by Country and Sub-region, 2020-2031
10.6.1. Germany Nitrobenzene Market Volume (Kilo Tons) and Value (US$ Mn) Forecast, by Form, 2020–2031
10.6.2. Germany Nitrobenzene Market Volume (Kilo Tons) and Value (US$ Mn) Forecast, by Grade, 2020–2031
10.6.3. Germany Nitrobenzene Market Volume (Kilo Tons) and Value (US$ Mn) Forecast, by Application, 2020–2031
10.6.4. Germany Nitrobenzene Market Volume (Kilo Tons) and Value (US$ Mn) Forecast, by End-use, 2020–2031
10.6.5. France Nitrobenzene Market Volume (Kilo Tons) and Value (US$ Mn) Forecast, by Form, 2020–2031
10.6.6. France Nitrobenzene Market Volume (Kilo Tons) and Value (US$ Mn) Forecast, by Grade, 2020–2031
10.6.7. France Nitrobenzene Market Volume (Kilo Tons) and Value (US$ Mn) Forecast, by Application, 2020–2031
10.6.8. France Nitrobenzene Market Volume (Kilo Tons) and Value (US$ Mn) Forecast, by End-use, 2020–2031
10.6.9. U.K. Nitrobenzene Market Volume (Kilo Tons) and Value (US$ Mn) Forecast, by Form, 2020–2031
10.6.10. U.K. Nitrobenzene Market Volume (Kilo Tons) and Value (US$ Mn) Forecast, by Grade, 2020–2031
10.6.11. U.K. Nitrobenzene Market Volume (Kilo Tons) and Value (US$ Mn) Forecast, by Application, 2020–2031
10.6.12. U.K. Nitrobenzene Market Volume (Kilo Tons) and Value (US$ Mn) Forecast, by End-use, 2020–2031
10.6.13. Italy Nitrobenzene Market Volume (Kilo Tons) and Value (US$ Mn) Forecast, by Form, 2020–2031
10.6.14. Italy Nitrobenzene Market Volume (Kilo Tons) and Value (US$ Mn) Forecast, by Grade, 2020–2031
10.6.15. Italy Nitrobenzene Market Volume (Kilo Tons) and Value (US$ Mn) Forecast, by Application, 2020–2031
10.6.16. Italy Nitrobenzene Market Volume (Kilo Tons) and Value (US$ Mn) Forecast, by End-use, 2020–2031
10.6.17. Spain Nitrobenzene Market Volume (Kilo Tons) and Value (US$ Mn) Forecast, by Form, 2020–2031
10.6.18. Spain Nitrobenzene Market Volume (Kilo Tons) and Value (US$ Mn) Forecast, by Grade, 2020–2031
10.6.19. Spain Nitrobenzene Market Volume (Kilo Tons) and Value (US$ Mn) Forecast, by Application, 2020–2031
10.6.20. Spain Nitrobenzene Market Volume (Kilo Tons) and Value (US$ Mn) Forecast, by End-use, 2020–2031
10.6.21. Portugal Nitrobenzene Market Volume (Kilo Tons) and Value (US$ Mn) Forecast, by Form, 2020–2031
10.6.22. Portugal Nitrobenzene Market Volume (Kilo Tons) and Value (US$ Mn) Forecast, by Grade, 2020–2031
10.6.23. Portugal Nitrobenzene Market Volume (Kilo Tons) and Value (US$ Mn) Forecast, by Application, 2020–2031
10.6.24. Portugal Nitrobenzene Market Volume (Kilo Tons) and Value (US$ Mn) Forecast, by End-use, 2020–2031
10.6.25. Russia & CIS Nitrobenzene Market Volume (Kilo Tons) and Value (US$ Mn) Forecast, by Form, 2020–2031
10.6.26. Russia & CIS Nitrobenzene Market Volume (Kilo Tons) and Value (US$ Mn) Forecast, by Grade, 2020–2031
10.6.27. Russia & CIS Nitrobenzene Market Volume (Kilo Tons) and Value (US$ Mn) Forecast, by Application, 2020–2031
10.6.28. Russia & CIS Nitrobenzene Market Volume (Kilo Tons) and Value (US$ Mn) Forecast, by End-use, 2020–2031
10.6.29. Rest of Europe Nitrobenzene Market Volume (Kilo Tons) and Value (US$ Mn) Forecast, by Form, 2020–2031
10.6.30. Rest of Europe Nitrobenzene Market Volume (Kilo Tons) and Value (US$ Mn) Forecast, by Grade, 2020–2031
10.6.31. Rest of Europe Nitrobenzene Market Volume (Kilo Tons) and Value (US$ Mn) Forecast, by Application, 2020–2031
10.6.32. Rest of Europe Nitrobenzene Market Volume (Kilo Tons) and Value (US$ Mn) Forecast, by End-use, 2020–2031
10.7. Europe Nitrobenzene Market Attractiveness Analysis
11. Asia Pacific Nitrobenzene Market Analysis and Forecast, 2020–2031
11.1. Key Findings
11.2. Asia Pacific Nitrobenzene Market Volume (Kilo Tons) and Value (US$ Mn) Forecast, by Form, 2020–2031
11.3. Asia Pacific Nitrobenzene Market Volume (Kilo Tons) and Value (US$ Mn) Forecast, by Grade, 2020–2031
11.4. Asia Pacific Nitrobenzene Market Volume (Kilo Tons) and Value (US$ Mn) Forecast, by Application, 2020–2031
11.5. Asia Pacific Nitrobenzene Market Volume (Kilo Tons) and Value (US$ Mn) Forecast, by End-use, 2020–2031
11.6. Asia Pacific Nitrobenzene Market Volume (Kilo Tons) and Value (US$ Mn) Forecast, by Country and Sub-region, 2020-2031
11.6.1. China Nitrobenzene Market Volume (Kilo Tons) and Value (US$ Mn) Forecast, by Form, 2020–2031
11.6.2. China Nitrobenzene Market Volume (Kilo Tons) and Value (US$ Mn) Forecast, by Grade, 2020–2031
11.6.3. China Nitrobenzene Market Volume (Kilo Tons) and Value (US$ Mn) Forecast, by Application, 2020–2031
11.6.4. China Nitrobenzene Market Volume (Kilo Tons) and Value (US$ Mn) Forecast, by End-use, 2020–2031
11.6.5. Japan Nitrobenzene Market Volume (Kilo Tons) and Value (US$ Mn) Forecast, by Form, 2020–2031
11.6.6. Japan Nitrobenzene Market Volume (Kilo Tons) and Value (US$ Mn) Forecast, by Grade, 2020–2031
11.6.7. Japan Nitrobenzene Market Volume (Kilo Tons) and Value (US$ Mn) Forecast, by Application, 2020–2031
11.6.8. Japan Nitrobenzene Market Volume (Kilo Tons) and Value (US$ Mn) Forecast, by End-use, 2020–2031
11.6.9. India Nitrobenzene Market Volume (Kilo Tons) and Value (US$ Mn) Forecast, by Form, 2020–2031
11.6.10. India Nitrobenzene Market Volume (Kilo Tons) and Value (US$ Mn) Forecast, by Grade, 2020–2031
11.6.11. India Nitrobenzene Market Volume (Kilo Tons) and Value (US$ Mn) Forecast, by Application, 2020–2031
11.6.12. India Nitrobenzene Market Volume (Kilo Tons) and Value (US$ Mn) Forecast, by End-use, 2020–2031
11.6.13. ASEAN Nitrobenzene Market Volume (Kilo Tons) and Value (US$ Mn) Forecast, by Form, 2020–2031
11.6.14. ASEAN Nitrobenzene Market Volume (Kilo Tons) and Value (US$ Mn) Forecast, by Grade, 2020–2031
11.6.15. ASEAN Nitrobenzene Market Volume (Kilo Tons) and Value (US$ Mn) Forecast, by Application, 2020–2031
11.6.16. ASEAN Nitrobenzene Market Volume (Kilo Tons) and Value (US$ Mn) Forecast, by End-use, 2020–2031
11.6.17. Rest of Asia Pacific Nitrobenzene Market Volume (Kilo Tons) and Value (US$ Mn) Forecast, by Form, 2020–2031
11.6.18. Rest of Asia Pacific Nitrobenzene Market Volume (Kilo Tons) and Value (US$ Mn) Forecast, by Grade, 2020–2031
11.6.19. Rest of Asia Pacific Nitrobenzene Market Volume (Kilo Tons) and Value (US$ Mn) Forecast, by Application, 2020–2031
11.6.20. Rest of Asia Pacific Nitrobenzene Market Volume (Kilo Tons) and Value (US$ Mn) Forecast, by End-use, 2020–2031
11.7. Asia Pacific Nitrobenzene Market Attractiveness Analysis
12. Latin America Nitrobenzene Market Analysis and Forecast, 2020–2031
12.1. Key Findings
12.2. Latin America Nitrobenzene Market Volume (Kilo Tons) and Value (US$ Mn) Forecast, by Form, 2020–2031
12.3. Latin America Nitrobenzene Market Volume (Kilo Tons) and Value (US$ Mn) Forecast, by Grade, 2020–2031
12.4. Latin America Nitrobenzene Market Volume (Kilo Tons) and Value (US$ Mn) Forecast, by Application, 2020–2031
12.5. Latin America Nitrobenzene Market Volume (Kilo Tons) and Value (US$ Mn) Forecast, by End-use, 2020–2031
12.6. Latin America Nitrobenzene Market Volume (Kilo Tons) and Value (US$ Mn) Forecast, by Country and Sub-region, 2020-2031
12.6.1. Brazil Nitrobenzene Market Volume (Kilo Tons) and Value (US$ Mn) Forecast, by Form, 2020–2031
12.6.2. Brazil Nitrobenzene Market Volume (Kilo Tons) and Value (US$ Mn) Forecast, by Grade, 2020–2031
12.6.3. Brazil Nitrobenzene Market Volume (Kilo Tons) and Value (US$ Mn) Forecast, by Application, 2020–2031
12.6.4. Brazil Nitrobenzene Market Volume (Kilo Tons) and Value (US$ Mn) Forecast, by End-use, 2020–2031
12.6.5. Mexico Nitrobenzene Market Volume (Kilo Tons) and Value (US$ Mn) Forecast, by Form, 2020–2031
12.6.6. Mexico Nitrobenzene Market Volume (Kilo Tons) and Value (US$ Mn) Forecast, by Grade, 2020–2031
12.6.7. Mexico Nitrobenzene Market Volume (Kilo Tons) and Value (US$ Mn) Forecast, by Application, 2020–2031
12.6.8. Mexico Nitrobenzene Market Volume (Kilo Tons) and Value (US$ Mn) Forecast, by End-use, 2020–2031
12.6.9. Rest of Latin America Nitrobenzene Market Volume (Kilo Tons) and Value (US$ Mn) Forecast, by Form, 2020–2031
12.6.10. Rest of Latin America Nitrobenzene Market Volume (Kilo Tons) and Value (US$ Mn) Forecast, by Grade, 2020–2031
12.6.11. Rest of Latin America Nitrobenzene Market Volume (Kilo Tons) and Value (US$ Mn) Forecast, by Application, 2020–2031
12.6.12. Rest of Latin America Nitrobenzene Market Volume (Kilo Tons) and Value (US$ Mn) Forecast, by End-use, 2020–2031
12.7. Latin America Nitrobenzene Market Attractiveness Analysis
13. Middle East & Africa Nitrobenzene Market Analysis and Forecast, 2020–2031
13.1. Key Findings
13.2. Middle East & Africa Nitrobenzene Market Volume (Kilo Tons) and Value (US$ Mn) Forecast, by Form, 2020–2031
13.3. Middle East & Africa Nitrobenzene Market Volume (Kilo Tons) and Value (US$ Mn) Forecast, by Grade, 2020–2031
13.4. Middle East & Africa Nitrobenzene Market Volume (Kilo Tons) and Value (US$ Mn) Forecast, by Application, 2020–2031
13.5. Middle East & Africa Nitrobenzene Market Volume (Kilo Tons) and Value (US$ Mn) Forecast, by End-use, 2020–2031
13.6. Middle East & Africa Nitrobenzene Market Volume (Kilo Tons) and Value (US$ Mn) Forecast, by Country and Sub-region, 2020-2031
13.6.1. GCC Nitrobenzene Market Volume (Kilo Tons) and Value (US$ Mn) Forecast, by Form, 2020–2031
13.6.2. GCC Nitrobenzene Market Volume (Kilo Tons) and Value (US$ Mn) Forecast, by Grade, 2020–2031
13.6.3. GCC Nitrobenzene Market Volume (Kilo Tons) and Value (US$ Mn) Forecast, by Application, 2020–2031
13.6.4. GCC Nitrobenzene Market Volume (Kilo Tons) and Value (US$ Mn) Forecast, by End-use, 2020–2031
13.6.5. South Africa Nitrobenzene Market Volume (Kilo Tons) and Value (US$ Mn) Forecast, by Form, 2020–2031
13.6.6. South Africa Nitrobenzene Market Volume (Kilo Tons) and Value (US$ Mn) Forecast, by Grade, 2020–2031
13.6.7. South Africa Nitrobenzene Market Volume (Kilo Tons) and Value (US$ Mn) Forecast, by Application, 2020–2031
13.6.8. South Africa Nitrobenzene s Market Volume (Kilo Tons) and Value (US$ Mn) Forecast, by End-use, 2020–2031
13.6.9. Rest of Middle East & Africa Nitrobenzene Market Volume (Kilo Tons) and Value (US$ Mn) Forecast, by Form, 2020–2031
13.6.10. Rest of Middle East & Africa Nitrobenzene Market Volume (Kilo Tons) and Value (US$ Mn) Forecast, by Grade, 2020–2031
13.6.11. Rest of Middle East & Africa Nitrobenzene Market Volume (Kilo Tons) and Value (US$ Mn) Forecast, by Application, 2020–2031
13.6.12. Rest of Middle East & Africa Nitrobenzene Market Volume (Kilo Tons) and Value (US$ Mn) Forecast, by End-use, 2020–2031
13.7. Middle East & Africa Nitrobenzene Market Attractiveness Analysis
14. Competition Landscape
14.1. Global Nitrobenzene Company Market Share Analysis, 2020
14.2. Company Profiles (Details – Overview, Financials, Recent Developments, and Strategy)
14.2.1. The Chemours Company
14.2.1.1. Company Description
14.2.1.2. Business Overview
14.2.1.3. Financial Overview
14.2.1.4. Strategic Overview
14.2.2. The Dow Chemical Company
14.2.2.1. Company Description
14.2.2.2. Business Overview
14.2.2.3. Financial Overview
14.2.2.4. Strategic Overview
14.2.3. Huntsman International LLC
14.2.3.1. Company Description
14.2.3.2. Business Overview
14.2.3.3. Financial Overview
14.2.3.4. Strategic Overview
14.2.4. Connell
14.2.4.1. Company Description
14.2.4.2. Business Overview
14.2.4.3. Financial Overview
14.2.4.4. Strategic Overview
14.2.5. Bann Quimica Ltda
14.2.5.1. Company Description
14.2.5.2. Business Overview
14.2.5.3. Financial Overview
14.2.5.4. Strategic Overview
14.2.6. Covestro AG
14.2.6.1. Company Description
14.2.6.2. Business Overview
14.2.6.3. Financial Overview
14.2.6.4. Strategic Overview
14.2.7. SP Chemicals Holdings Ltd
14.2.7.1. Company Description
14.2.7.2. Business Overview
14.2.7.3. Financial Overview
14.2.7.4. Strategic Overview
14.2.8. Aromsyn Co., Ltd
14.2.8.1. Company Description
14.2.8.2. Business Overview
14.2.8.3. Financial Overview
14.2.8.4. Strategic Overview
14.2.9. Nanjing Chemical Material Corp
14.2.9.1. Company Description
14.2.9.2. Business Overview
14.2.9.3. Financial Overview
14.2.9.4. Strategic Overview
14.2.10. KUMHO MITSUI CHEMICALS CORP
14.2.10.1. Company Description
14.2.10.2. Business Overview
14.2.10.3. Financial Overview
14.2.10.4. Strategic Overview
14.2.11. China Qingdao Hongjin Chemical Co., Ltd
14.2.11.1. Company Description
14.2.11.2. Business Overview
14.2.11.3. Financial Overview
14.2.11.4. Strategic Overview
14.2.12. Anhui Bayi Chemical Industry Co., Ltd
14.2.12.1. Company Description
14.2.12.2. Business Overview
14.2.12.3. Financial Overview
14.2.12.4. Strategic Overview
14.2.13. Shanghai Yuanye Bio-Technology Co., Ltd
14.2.13.1. Company Description
14.2.13.2. Business Overview
14.2.13.3. Financial Overview
14.2.13.4. Strategic Overview
14.2.14. Shandong Jinling Chemical Co.
14.2.14.1. Company Description
14.2.14.2. Business Overview
14.2.14.3. Financial Overview
14.2.14.4. Strategic Overview
15. Primary Research: Key Insights
16. Appendix
List of Tables
Table 1: Global Nitrobenzene Market Volume (Kilo Tons) Forecast, by Form, 2020–2031
Table 2: Global Nitrobenzene Market Value (US$ Mn) Forecast, by Form, 2020–2031
Table 3: Global Nitrobenzene Market Volume (Kilo Tons) Forecast, by Grade, 2020–2031
Table 4: Global Nitrobenzene Market Value (US$ Mn) Forecast, by Grade, 2020–2031
Table 5: Global Nitrobenzene Market Volume (Kilo Tons) Forecast, by Application, 2020–2031
Table 6: Global Nitrobenzene Market Value (US$ Mn) Forecast, by Application, 2020–2031
Table 7: Global Nitrobenzene Market Volume (Kilo Tons) Forecast, by End-use 2020–2031
Table 8: Global Nitrobenzene Market Value (US$ Mn) Forecast, by End-use 2020–2031
Table 9: Global Nitrobenzene Market Volume (Kilo Tons) Forecast, by Region, 2020–2031
Table 10: Global Nitrobenzene Market Value (US$ Mn) Forecast, by Region, 2020–2031
Table 11: North America Nitrobenzene Market Volume (Kilo Tons) Forecast, by Form, 2020–2031
Table 12: North America Nitrobenzene Market Value (US$ Mn) Forecast, by Form, 2020–2031
Table 13: North America Nitrobenzene Market Volume (Kilo Tons) Forecast, by Grade, 2020–2031
Table 14: North America Nitrobenzene Market Value (US$ Mn) Forecast, by Grade, 2020–2031
Table 15: North America Nitrobenzene Market Volume (Kilo Tons) Forecast, by Application, 2020–2031
Table 16: North America Nitrobenzene Market Value (US$ Mn) Forecast, by Application, 2020–2031
Table 17: North America Nitrobenzene Market Volume (Kilo Tons) Forecast, by End-use 2020–2031
Table 18: North America Nitrobenzene Market Value (US$ Mn) Forecast, by End-use 2020–2031
Table 19: North America Nitrobenzene Market Volume (Kilo Tons) Forecast, by Country, 2020–2031
Table 20: North America Nitrobenzene Market Value (US$ Mn) Forecast, by Country, 2020–2031
Table 21: U.S. Nitrobenzene Market Volume (Kilo Tons) Forecast, by Form, 2020–2031
Table 22: U.S. Nitrobenzene Market Value (US$ Mn) Forecast, by Form, 2020–2031
Table 23: U.S. Nitrobenzene Market Volume (Kilo Tons) Forecast, by Grade, 2020–2031
Table 24: U.S. Nitrobenzene Market Value (US$ Mn) Forecast, by Grade, 2020–2031
Table 25: U.S. Nitrobenzene Market Volume (Kilo Tons) Forecast, by Application, 2020–2031
Table 26: U.S. Nitrobenzene Market Value (US$ Mn) Forecast, by Application, 2020–2031
Table 27: U.S. Nitrobenzene Market Volume (Kilo Tons) Forecast, by End-use 2020–2031
Table 28: U.S. Nitrobenzene Market Value (US$ Mn) Forecast, by End-use 2020–2031
Table 29: Canada Nitrobenzene Market Volume (Kilo Tons) Forecast, by Form, 2020–2031
Table 30: Canada Nitrobenzene Market Value (US$ Mn) Forecast, by Form, 2020–2031
Table 32: Canada Nitrobenzene Market Volume (Kilo Tons) Forecast, by Grade, 2020–2031
Table 32: Canada Nitrobenzene Market Value (US$ Mn) Forecast, by Grade, 2020–2031
Table 33: Canada Nitrobenzene Market Volume (Kilo Tons) Forecast, by Application, 2020–2031
Table 34: Canada Nitrobenzene Market Value (US$ Mn) Forecast, by Application, 2020–2031
Table 35: Canada Nitrobenzene Market Volume (Kilo Tons) Forecast, by End-use 2020–2031
Table 36: Canada Nitrobenzene Market Value (US$ Mn) Forecast, by End-use 2020–2031
Table 37: Europe Nitrobenzene Market Volume (Kilo Tons) Forecast, by Form, 2020–2031
Table 38: Europe Nitrobenzene Market Value (US$ Mn) Forecast, by Form, 2020–2031
Table 39: Europe Nitrobenzene Market Volume (Kilo Tons) Forecast, by Grade, 2020–2031
Table 40: Europe Nitrobenzene Market Value (US$ Mn) Forecast, by Grade, 2020–2031
Table 41: Europe Nitrobenzene Market Volume (Kilo Tons) Forecast, by Application, 2020–2031
Table 42: Europe Nitrobenzene Market Value (US$ Mn) Forecast, by Application, 2020–2031
Table 43: Europe Nitrobenzene Market Volume (Kilo Tons) Forecast, by End-use 2020–2031
Table 44: Europe Nitrobenzene Market Value (US$ Mn) Forecast, by End-use 2020–2031
Table 45: Europe Nitrobenzene Market Volume (Kilo Tons) Forecast, by Country and Sub-region, 2020–2031
Table 46: Europe Nitrobenzene Market Value (US$ Mn) Forecast, by Country and Sub-region, 2020–2031
Table 47: Germany Nitrobenzene Market Volume (Kilo Tons) Forecast, by Form, 2020–2031
Table 48: Germany Nitrobenzene Market Value (US$ Mn) Forecast, by Form, 2020–2031
Table 49: Germany Nitrobenzene Market Volume (Kilo Tons) Forecast, by Grade, 2020–2031
Table 50: Germany Nitrobenzene Market Value (US$ Mn) Forecast, by Grade, 2020–2031
Table 51: Germany Nitrobenzene Market Volume (Kilo Tons) Forecast, by Form, 2020–2031
Table 52: Germany Nitrobenzene Market Value (US$ Mn) Forecast, by Form, 2020–2031
Table 53: Germany Nitrobenzene Market Volume (Kilo Tons) Forecast, by End-use 2020–2031
Table 54: Germany Nitrobenzene Market Value (US$ Mn) Forecast, by End-use 2020–2031
Table 55: France Nitrobenzene Market Volume (Kilo Tons) Forecast, by Form, 2020–2031
Table 56: France Nitrobenzene Market Value (US$ Mn) Forecast, by Form, 2020–2031
Table 57: France Nitrobenzene Market Volume (Kilo Tons) Forecast, by Grade, 2020–2031
Table 58: France Nitrobenzene Market Value (US$ Mn) Forecast, by Grade, 2020–2031
Table 59: France Nitrobenzene Market Volume (Kilo Tons) Forecast, by Application, 2020–2031
Table 60: France Nitrobenzene Market Value (US$ Mn) Forecast, by Application, 2020–2031
Table 61: France Nitrobenzene Market Volume (Kilo Tons) Forecast, by End-use 2020–2031
Table 62: France Nitrobenzene Market Value (US$ Mn) Forecast, by End-use 2020–2031
Table 63: U.K. Nitrobenzene Market Volume (Kilo Tons) Forecast, by Form, 2020–2031
Table 64: U.K. Nitrobenzene Market Value (US$ Mn) Forecast, by Form, 2020–2031
Table 65: U.K. Nitrobenzene Market Volume (Kilo Tons) Forecast, by Grade, 2020–2031
Table 66: U.K. Nitrobenzene Market Value (US$ Mn) Forecast, by Grade, 2020–2031
Table 67: U.K. Nitrobenzene Market Volume (Kilo Tons) Forecast, by Application, 2020–2031
Table 68: U.K. Nitrobenzene Market Value (US$ Mn) Forecast, by Application, 2020–2031
Table 69: U.K. Nitrobenzene Market Volume (Kilo Tons) Forecast, by End-use 2020–2031
Table 70: U.K. Nitrobenzene Market Value (US$ Mn) Forecast, by End-use 2020–2031
Table 71: Italy Nitrobenzene Market Volume (Kilo Tons) Forecast, by Form, 2020–2031
Table 72: Italy Nitrobenzene Market Value (US$ Mn) Forecast, by Form, 2020–2031
Table 73: Italy Nitrobenzene Market Volume (Kilo Tons) Forecast, by Grade, 2020–2031
Table 74: Italy Nitrobenzene Market Value (US$ Mn) Forecast, by Grade, 2020–2031
Table 75: Italy Nitrobenzene Market Volume (Kilo Tons) Forecast, by Application, 2020–2031
Table 76: Italy Nitrobenzene Market Value (US$ Mn) Forecast, by Application, 2020–2031
Table 77: Italy Nitrobenzene Market Volume (Kilo Tons) Forecast, by End-use 2020–2031
Table 78: Italy Nitrobenzene Market Value (US$ Mn) Forecast, by End-use 2020–2031
Table 79: Spain Nitrobenzene Market Volume (Kilo Tons) Forecast, by Form, 2020–2031
Table 80: Spain Nitrobenzene Market Value (US$ Mn) Forecast, by Form, 2020–2031
Table 81: Spain Nitrobenzene Market Volume (Kilo Tons) Forecast, by Grade, 2020–2031
Table 82: Spain Nitrobenzene Market Value (US$ Mn) Forecast, by Grade, 2020–2031
Table 83: Spain Nitrobenzene Market Volume (Kilo Tons) Forecast, by Application, 2020–2031
Table 84: Spain Nitrobenzene Market Value (US$ Mn) Forecast, by Application, 2020–2031
Table 85: Spain Nitrobenzene Market Volume (Kilo Tons) Forecast, by End-use 2020–2031
Table 86: Spain Nitrobenzene Market Value (US$ Mn) Forecast, by End-use 2020–2031
Table 87: Portugal Nitrobenzene Market Volume (Kilo Tons) Forecast, by Form, 2020–2031
Table 88: Portugal Nitrobenzene Market Value (US$ Mn) Forecast, by Form, 2020–2031
Table 89: Portugal Nitrobenzene Market Volume (Kilo Tons) Forecast, by Grade, 2020–2031
Table 90: Portugal Nitrobenzene Market Value (US$ Mn) Forecast, by Grade, 2020–2031
Table 91: Portugal Nitrobenzene Market Volume (Kilo Tons) Forecast, by Application, 2020–2031
Table 92: Portugal Nitrobenzene Market Value (US$ Mn) Forecast, by Application, 2020–2031
Table 93: Portugal Nitrobenzene Market Volume (Kilo Tons) Forecast, by End-use 2020–2031
Table 94: Portugal Nitrobenzene Market Value (US$ Mn) Forecast, by End-use 2020–2031
Table 95: Russia & CIS Nitrobenzene Market Volume (Kilo Tons) Forecast, by Form, 2020–2031
Table 96: Russia & CIS Nitrobenzene Market Value (US$ Mn) Forecast, by Form, 2020–2031
Table 97: Russia & CIS Nitrobenzene Market Volume (Kilo Tons) Forecast, by Grade, 2020–2031
Table 98: Russia & CIS Nitrobenzene Market Value (US$ Mn) Forecast, by Grade, 2020–2031
Table 99: Russia & CIS Nitrobenzene Market Volume (Kilo Tons) Forecast, by Application, 2020–2031
Table 100: Russia & CIS Nitrobenzene Market Value (US$ Mn) Forecast, by Application, 2020–2031
Table 101: Russia & CIS Nitrobenzene Market Volume (Kilo Tons) Forecast, by End-use 2020–2031
Table 102: Russia & CIS Nitrobenzene Market Value (US$ Mn) Forecast, by End-use 2020–2031
Table 103: Rest of Europe Nitrobenzene Market Volume (Kilo Tons) Forecast, by Form, 2020–2031
Table 104: Rest of Europe Nitrobenzene Market Value (US$ Mn) Forecast, by Form, 2020–2031
Table 105: Rest of Europe Nitrobenzene Market Volume (Kilo Tons) Forecast, by Grade, 2020–2031
Table 106: Rest of Europe Nitrobenzene Market Value (US$ Mn) Forecast, by Grade, 2020–2031
Table 107: Rest of Europe Nitrobenzene Market Volume (Kilo Tons) Forecast, by Application, 2020–2031
Table 108: Rest of Europe Nitrobenzene Market Value (US$ Mn) Forecast, by Application, 2020–2031
Table 109: Rest of Europe Nitrobenzene Market Volume (Kilo Tons) Forecast, by End-use 2020–2031
Table 110: Rest of Europe Nitrobenzene Market Value (US$ Mn) Forecast, by End-use 2020–2031
Table 111: Asia Pacific Nitrobenzene Market Volume (Kilo Tons) Forecast, by Form, 2020–2031
Table 112: Asia Pacific Nitrobenzene Market Value (US$ Mn) Forecast, by Form, 2020–2031
Table 113: Asia Pacific Nitrobenzene Market Volume (Kilo Tons) Forecast, by Grade, 2020–2031
Table 114: Asia Pacific Nitrobenzene Market Value (US$ Mn) Forecast, by Grade, 2020–2031
Table 115: Asia Pacific Nitrobenzene Market Volume (Kilo Tons) Forecast, by Application, 2020–2031
Table 116: Asia Pacific Nitrobenzene Market Value (US$ Mn) Forecast, by Application, 2020–2031
Table 117: Asia Pacific Nitrobenzene Market Volume (Kilo Tons) Forecast, by End-use 2020–2031
Table 118: Asia Pacific Nitrobenzene Market Value (US$ Mn) Forecast, by End-use 2020–2031
Table 119: Asia Pacific Nitrobenzene Market Volume (Kilo Tons) Forecast, by Country and Sub-region, 2020–2031
Table 120: Asia Pacific Nitrobenzene Market Value (US$ Mn) Forecast, by Country and Sub-region, 2020–2031
Table 121: China Nitrobenzene Market Volume (Kilo Tons) Forecast, by Form, 2020–2031
Table 122: China Nitrobenzene Market Value (US$ Mn) Forecast, by Form, 2020–2031
Table 123: China Nitrobenzene Market Volume (Kilo Tons) Forecast, by Grade, 2020–2031
Table 124: China Nitrobenzene Market Value (US$ Mn) Forecast, by Grade, 2020–2031
Table 125: China Nitrobenzene Market Volume (Kilo Tons) Forecast, by Application, 2020–2031
Table 126: China Nitrobenzene Market Value (US$ Mn) Forecast, by Application, 2020–2031
Table 127: China Nitrobenzene Market Volume (Kilo Tons) Forecast, by End-use 2020–2031
Table 128: China Nitrobenzene Market Value (US$ Mn) Forecast, by End-use 2020–2031
Table 129: Japan Nitrobenzene Market Volume (Kilo Tons) Forecast, by Form, 2020–2031
Table 130: Japan Nitrobenzene Market Value (US$ Mn) Forecast, by Form, 2020–2031
Table 131: Japan Nitrobenzene Market Volume (Kilo Tons) Forecast, by Grade, 2020–2031
Table 132: Japan Nitrobenzene Market Value (US$ Mn) Forecast, by Grade, 2020–2031
Table 133: Japan Nitrobenzene Market Volume (Kilo Tons) Forecast, by Application, 2020–2031
Table 134: Japan Nitrobenzene Market Value (US$ Mn) Forecast, by Application, 2020–2031
Table 135: Japan Nitrobenzene Market Volume (Kilo Tons) Forecast, by End-use 2020–2031
Table 136: Japan Nitrobenzene Market Value (US$ Mn) Forecast, by End-use 2020–2031
Table 137: India Nitrobenzene Market Volume (Kilo Tons) Forecast, by Form, 2020–2031
Table 138: India Nitrobenzene Market Value (US$ Mn) Forecast, by Form, 2020–2031
Table 139: India Nitrobenzene Market Volume (Kilo Tons) Forecast, by Grade, 2020–2031
Table 140: India Nitrobenzene Market Value (US$ Mn) Forecast, by Grade, 2020–2031
Table 141: India Nitrobenzene Market Volume (Kilo Tons) Forecast, by Application, 2020–2031
Table 142: India Nitrobenzene Market Value (US$ Mn) Forecast, by Application, 2020–2031
Table 143: India Nitrobenzene Market Volume (Kilo Tons) Forecast, by End-use 2020–2031
Table 144: India Nitrobenzene Market Value (US$ Mn) Forecast, by End-use 2020–2031
Table 145: ASEAN Nitrobenzene Market Volume (Kilo Tons) Forecast, by Form, 2020–2031
Table 146: ASEAN Nitrobenzene Market Value (US$ Mn) Forecast, by Form, 2020–2031
Table 147: ASEAN Nitrobenzene Market Volume (Kilo Tons) Forecast, by Grade, 2020–2031
Table 148: ASEAN Nitrobenzene Market Value (US$ Mn) Forecast, by Grade, 2020–2031
Table 149: ASEAN Nitrobenzene Market Volume (Kilo Tons) Forecast, by Application, 2020–2031
Table 150: ASEAN Nitrobenzene Market Value (US$ Mn) Forecast, by Application, 2020–2031
Table 151: ASEAN Nitrobenzene Market Volume (Kilo Tons) Forecast, by End-use 2020–2031
Table 152: ASEAN Nitrobenzene Market Value (US$ Mn) Forecast, by End-use 2020–2031
Table 153: Rest of Asia Pacific Nitrobenzene Market Volume (Kilo Tons) Forecast, by Form, 2020–2031
Table 154: Rest of Asia Pacific Nitrobenzene Market Value (US$ Mn) Forecast, by Form, 2020–2031
Table 155: Rest of Asia Pacific Nitrobenzene Market Volume (Kilo Tons) Forecast, by Grade, 2020–2031
Table 156: Rest of Asia Pacific Nitrobenzene Market Value (US$ Mn) Forecast, by Grade, 2020–2031
Table 157: Rest of Asia Pacific Nitrobenzene Market Volume (Kilo Tons) Forecast, by Application, 2020–2031
Table 158: Rest of Asia Pacific Nitrobenzene Market Value (US$ Mn) Forecast, by Application, 2020–2031
Table 159: Rest of Asia Pacific Nitrobenzene Market Volume (Kilo Tons) Forecast, by End-use 2020–2031
Table 160: Rest of Asia Pacific Nitrobenzene Market Value (US$ Mn) Forecast, by End-use 2020–2031
Table 161: Latin America Nitrobenzene Market Volume (Kilo Tons) Forecast, by Form, 2020–2031
Table 162: Latin America Nitrobenzene Market Value (US$ Mn) Forecast, by Form, 2020–2031
Table 163: Latin America Nitrobenzene Market Volume (Kilo Tons) Forecast, by Grade, 2020–2031
Table 164: Latin America Nitrobenzene Market Value (US$ Mn) Forecast, by Grade, 2020–2031
Table 165: Latin America Nitrobenzene Market Volume (Kilo Tons) Forecast, by Application, 2020–2031
Table 166: Latin America Nitrobenzene Market Value (US$ Mn) Forecast, by Application, 2020–2031
Table 167: Latin America Nitrobenzene Market Volume (Kilo Tons) Forecast, by End-use, 2020–2031
Table 168: Latin America Nitrobenzene Market Value (US$ Mn) Forecast, by End-use 2020–2031
Table 169: Latin America Nitrobenzene Market Volume (Kilo Tons) Forecast, by Country and Sub-region, 2020–2031
Table 170: Latin America Nitrobenzene Market Value (US$ Mn) Forecast, by Country and Sub-region, 2020–2031
Table 171: Brazil Nitrobenzene Market Volume (Kilo Tons) Forecast, by Form, 2020–2031
Table 172: Brazil Nitrobenzene Market Value (US$ Mn) Forecast, by Form, 2020–2031
Table 173: Brazil Nitrobenzene Market Volume (Kilo Tons) Forecast, by Grade, 2020–2031
Table 174: Brazil Nitrobenzene Market Value (US$ Mn) Forecast, by Grade, 2020–2031
Table 175: Brazil Nitrobenzene Market Volume (Kilo Tons) Forecast, by Application, 2020–2031
Table 176: Brazil Nitrobenzene Market Value (US$ Mn) Forecast, by Application, 2020–2031
Table 177: Brazil Nitrobenzene Market Volume (Kilo Tons) Forecast, by End-use 2020–2031
Table 178: Brazil Nitrobenzene Market Value (US$ Mn) Forecast, by End-use 2020–2031
Table 179: Mexico Nitrobenzene Market Volume (Kilo Tons) Forecast, by Form, 2020–2031
Table 180: Mexico Nitrobenzene Market Value (US$ Mn) Forecast, by Form, 2020–2031
Table 181: Mexico Nitrobenzene Market Volume (Kilo Tons) Forecast, by Grade, 2020–2031
Table 182: Mexico Nitrobenzene Market Value (US$ Mn) Forecast, by Grade, 2020–2031
Table 183: Mexico Nitrobenzene Market Volume (Kilo Tons) Forecast, by Application, 2020–2031
Table 184: Mexico Nitrobenzene Market Value (US$ Mn) Forecast, by Application, 2020–2031
Table 185: Mexico Nitrobenzene Market Volume (Kilo Tons) Forecast, by End-use 2020–2031
Table 186: Mexico Nitrobenzene Market Value (US$ Mn) Forecast, by End-use 2020–2031
Table 187: Rest of Latin America Nitrobenzene Market Volume (Kilo Tons) Forecast, by Form, 2020–2031
Table 188: Rest of Latin America Nitrobenzene Market Value (US$ Mn) Forecast, by Form, 2020–2031
Table 189: Rest of Latin America Nitrobenzene Market Volume (Kilo Tons) Forecast, by Grade, 2020–2031
Table 190: Rest of Latin America Nitrobenzene Market Value (US$ Mn) Forecast, by Grade, 2020–2031
Table 191: Rest of Latin America Nitrobenzene Market Volume (Kilo Tons) Forecast, by Application, 2020–2031
Table 192: Rest of Latin America Nitrobenzene Market Value (US$ Mn) Forecast, by Application, 2020–2031
Table 193: Rest of Latin America Nitrobenzene Market Volume (Kilo Tons) Forecast, by End-use 2020–2031
Table 194: Rest of Latin America Nitrobenzene Market Value (US$ Mn) Forecast, by End-use 2020–2031
Table 195: Middle East & Africa Nitrobenzene Market Volume (Kilo Tons) Forecast, by Form, 2020–2031
Table 196: Middle East & Africa Nitrobenzene Market Value (US$ Mn) Forecast, by Form, 2020–2031
Table 197: Middle East & Africa Nitrobenzene Market Volume (Kilo Tons) Forecast, by Grade, 2020–2031
Table 198: Middle East & Africa Nitrobenzene Market Value (US$ Mn) Forecast, by Grade, 2020–2031
Table 199: Middle East & Africa Nitrobenzene Market Volume (Kilo Tons) Forecast, by Application, 2020–2031
Table 200: Middle East & Africa Nitrobenzene Market Value (US$ Mn) Forecast, by Application, 2020–2031
Table 201: Middle East & Africa Nitrobenzene Market Volume (Kilo Tons) Forecast, by End-use, 2020–2031
Table 202: Middle East & Africa Nitrobenzene Market Value (US$ Mn) Forecast, by End-use, 2020–2031
Table 203: Middle East & Africa Nitrobenzene Market Volume (Kilo Tons) Forecast, by Country and Sub-region, 2020–2031
Table 204: Middle East & Africa Nitrobenzene Market Value (US$ Mn) Forecast, by Country and Sub-region, 2020–2031
Table 205: GCC Nitrobenzene Market Volume (Kilo Tons) Forecast, by Form, 2020–2031
Table 206: GCC Nitrobenzene Market Value (US$ Mn) Forecast, by Form, 2020–2031
Table 207: GCC Nitrobenzene Market Volume (Kilo Tons) Forecast, by Grade, 2020–2031
Table 208: GCC Nitrobenzene Market Value (US$ Mn) Forecast, by Grade, 2020–2031
Table 209: GCC Nitrobenzene Market Volume (Kilo Tons) Forecast, by Application, 2020–2031
Table 210: GCC Nitrobenzene Market Value (US$ Mn) Forecast, by Application, 2020–2031
Table 211: GCC Nitrobenzene Market Volume (Kilo Tons) Forecast, by End-use 2020–2031
Table 212: GCC Nitrobenzene Market Value (US$ Mn) Forecast, by End-use 2020–2031
Table 213: South Africa Nitrobenzene Market Volume (Kilo Tons) Forecast, by Form, 2020–2031
Table 214: South Africa Nitrobenzene Market Value (US$ Mn) Forecast, by Form, 2020–2031
Table 215: South Africa Nitrobenzene Market Volume (Kilo Tons) Forecast, by Grade, 2020–2031
Table 216: South Africa Nitrobenzene Market Value (US$ Mn) Forecast, by Grade, 2020–2031
Table 217: South Africa Nitrobenzene Market Volume (Kilo Tons) Forecast, by Application, 2020–2031
Table 218: South Africa Nitrobenzene Market Value (US$ Mn) Forecast, by Application, 2020–2031
Table 219: South Africa Nitrobenzene Market Volume (Kilo Tons) Forecast, by End-use 2020–2031
Table 220: South Africa Nitrobenzene Market Value (US$ Mn) Forecast, by End-use 2020–2031
Table 221: Rest of Middle East & Africa Nitrobenzene Market Volume (Kilo Tons) Forecast, by Form, 2020–2031
Table 222: Rest of Middle East & Africa Nitrobenzene Market Value (US$ Mn) Forecast, by Form, 2020–2031
Table 223: Rest of Middle East & Africa Nitrobenzene Market Volume (Kilo Tons) Forecast, by Grade, 2020–2031
Table 224: Rest of Middle East & Africa Nitrobenzene Market Value (US$ Mn) Forecast, by Grade, 2020–2031
Table 225: Rest of Middle East & Africa Nitrobenzene Market Volume (Kilo Tons) Forecast, by Application, 2020–2031
Table 226: Rest of Middle East & Africa Nitrobenzene Market Value (US$ Mn) Forecast, by Application, 2020–2031
Table 227: Rest of Middle East & Africa Nitrobenzene Market Volume (Kilo Tons) Forecast, by End-use 2020–2031
Table 228: Rest of Middle East & Africa Nitrobenzene Market Value (US$ Mn) Forecast, by End-use 2020–2031
List of Figures
Figure 1: Global Nitrobenzene Market Volume Share Analysis, by Form, 2020, 2025, and 2031
Figure 2: Global Nitrobenzene Market Attractiveness, by Form
Figure 3: Global Nitrobenzene Market Volume Share Analysis, by Grade, 2020, 2025, and 2031
Figure 4: Global Nitrobenzene Market Attractiveness, by Grade
Figure 5: Global Nitrobenzene Market Volume Share Analysis, by Application, 2020, 2025, and 2031
Figure 6: Global Nitrobenzene Market Attractiveness, by Application
Figure 7: Global Nitrobenzene Market Volume Share Analysis, by End-use, 2020, 2025, and 2031
Figure 8: Global Nitrobenzene Market Attractiveness, by End-use
Figure 9: Global Nitrobenzene Market Volume Share Analysis, by Region, 2020, 2025, and 2031
Figure 10: Global Nitrobenzene Market Attractiveness, by Region
Figure 11: North America Nitrobenzene Market Volume Share Analysis, by Form, 2020, 2025, and 2031
Figure 12: North America Nitrobenzene Market Attractiveness, by Form
Figure 13: North America Nitrobenzene Market Volume Share Analysis, by Grade, 2020, 2025, and 2031
Figure 14: North America Nitrobenzene Market Attractiveness, by Grade
Figure 15: North America Nitrobenzene Market Volume Share Analysis, by Application, 2020, 2025, and 2031
Figure 16: North America Nitrobenzene Market Attractiveness, by Application
Figure 17: North America Nitrobenzene Market Volume Share Analysis, by End-use, 2020, 2025, and 2031
Figure 18: North America Nitrobenzene Market Attractiveness, by End-use
Figure 19: North America Nitrobenzene Market Volume Share Analysis, by Region, 2020, 2025, and 2031
Figure 20: North America Nitrobenzene Market Attractiveness, by Country
Figure 21: Europe Nitrobenzene Market Volume Share Analysis, by Form, 2020, 2025, and 2031
Figure 22: Europe Nitrobenzene Market Attractiveness, by Form
Figure 23: Europe Nitrobenzene Market Volume Share Analysis, by Grade, 2020, 2025, and 2031
Figure 24: Europe Nitrobenzene Market Attractiveness, by Grade
Figure 25: Europe Nitrobenzene Market Volume Share Analysis, by Application, 2020, 2025, and 2031
Figure 26: Europe Nitrobenzene Market Attractiveness, by Application
Figure 27: Europe Nitrobenzene Market Volume Share Analysis, by End-use, 2020, 2025, and 2031
Figure 28: Europe Nitrobenzene Market Attractiveness, by End-use
Figure 29: Europe Nitrobenzene Market Volume Share Analysis, by Region, 2020, 2025, and 2031
Figure 30: Europe Nitrobenzene Market Attractiveness, by Country and Sub-region
Figure 31: Asia Pacific Nitrobenzene Market Volume Share Analysis, by Form, 2020, 2025, and 2031
Figure 32: Asia Pacific Nitrobenzene Market Attractiveness, by Form
Figure 33: Asia Pacific Nitrobenzene Market Volume Share Analysis, by Grade, 2020, 2025, and 2031
Figure 34: Asia Pacific Nitrobenzene Market Attractiveness, by Grade
Figure 35: Asia Pacific Nitrobenzene Market Volume Share Analysis, by Application, 2020, 2025, and 2031
Figure 36: Asia Pacific Nitrobenzene Market Attractiveness, by Application
Figure 37: Asia Pacific Nitrobenzene Market Volume Share Analysis, by End-use, 2020, 2025, and 2031
Figure 38: Asia Pacific Nitrobenzene Market Attractiveness, by End-use
Figure 39: Asia Pacific Nitrobenzene Market Volume Share Analysis, by Region, 2020, 2025, and 2031
Figure 40: Asia Pacific Nitrobenzene Market Attractiveness, by Country and Sub-region
Figure 41: Latin America Nitrobenzene Market Volume Share Analysis, by Form, 2020, 2025, and 2031
Figure 42: Latin America Nitrobenzene Market Attractiveness, by Form
Figure 43: Latin America Nitrobenzene Market Volume Share Analysis, by Grade, 2020, 2025, and 2031
Figure 44: Latin America Nitrobenzene Market Attractiveness, by Grade
Figure 45: Latin America Nitrobenzene Market Volume Share Analysis, by Application, 2020, 2025, and 2031
Figure 46: Latin America Nitrobenzene Market Attractiveness, by Application
Figure 47: Latin America Nitrobenzene Market Volume Share Analysis, by End-use, 2020, 2025, and 2031
Figure 48: Latin America Nitrobenzene Market Attractiveness, by End-use
Figure 49: Latin America Nitrobenzene Market Volume Share Analysis, by Region, 2020, 2025, and 2031
Figure 50: Latin America Nitrobenzene Market Attractiveness, by Country and Sub-region
Figure 51: Middle East & Africa Nitrobenzene Market Volume Share Analysis, by Form, 2020, 2025, and 2031
Figure 52: Middle East & Africa Nitrobenzene Market Attractiveness, by Form
Figure 53: Middle East & Africa Nitrobenzene Market Volume Share Analysis, by Grade, 2020, 2025, and 2031
Figure 54: Middle East & Africa Nitrobenzene Market Attractiveness, by Grade
Figure 55: Middle East & Africa Nitrobenzene Market Volume Share Analysis, by Application, 2020, 2025, and 2031
Figure 56: Middle East & Africa Nitrobenzene Market Attractiveness, by Application
Figure 57: Middle East & Africa Nitrobenzene Market Volume Share Analysis, by End-use, 2020, 2025, and 2031
Figure 58: Middle East & Africa Nitrobenzene Market Attractiveness, by End-use
Figure 59: Middle East & Africa Nitrobenzene Market Volume Share Analysis, by Region, 2020, 2025, and 2031
Figure 60: Middle East & Africa Nitrobenzene Market Attractiveness, by Country and Sub-region
Copyright © Transparency Market Research, Inc. All Rights reserved
Trust Online

Nitrobenzene Market Insights, 2021-2031