
Reports
Reports
Over the years, the nisin market has been showing consistent development. The market is picking up force from the expanding interest in natural food preservatives over the globe. The rising concept of organic farming far and wide has in this manner has opened doors for the nisin market. Other than this, expanding global populace, fast industrialization, and the interest in spotless and new water are the main market drivers. Thus, the nisin market is projected to show substantial growth during the forecast period of 2019-2028.
The report on nisin market by Transparency Market Research has many aspects that can help the stakeholders design the future strategy of their business. Transparency Market Research presents the various aspects of the nisin market such as competitive landscape, regional segmentation, latest trends, and others in a systematic manner to the stakeholders. Furthermore, the predictions are based on real-time data and extensive research. According to the analysis conducted by Transparency Market Research, the nisin market is anticipated to expand at a CAGR of ~5% during the forecast period of 2019-2028. The nisin market is estimated to reach ~US$ 297 Mn by 2028.
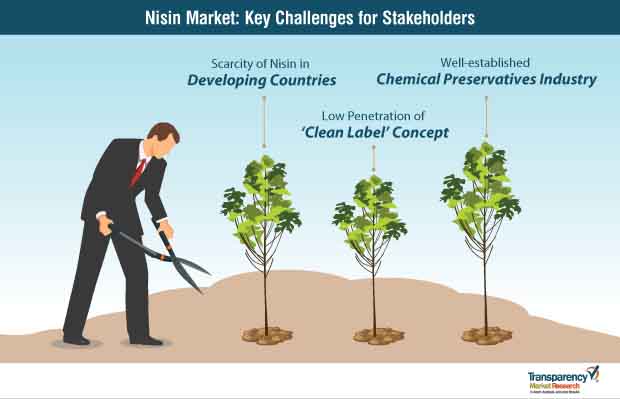
Food adulteration is the key concern around the world. The rising incidences of food adulteration have compelled the regulatory bodies to put forth norms to control food contamination. This has been invigorating a significant wave of optimism in the nisin market. The consumer shift towards synthesized food preservatives over the past few years has stirred optimism among nisin manufacturers. In addition, such efforts have paved the way for natural food preservatives. The need for exploring the rancidity-control property of nisin has been subjected to scientific discussions on its role in curbing serious public health issues among the global populace. For instance, the extensive use of synthetic food preservatives may lead to several health issues related to the stomach and intestines. The use of natural preservatives in food items is recommended by clinicians. The prevalence of organic farming in developing countries of the world is also a key factor bolstering the nisin market growth. Increased focus on the application of nisin in various processes involved in the food and beverages industry has also boosted the demand.
The adoption of nisin in food preservatives has caught steam among the global populace. This aspect has spurred new avenues for nisin makers to tap into the growth prospects of the vitamin deficiency treatment market. This has considerably fueled the prospects of various products using nisin as the main constituent. For instance, the growing demand for anti-bacterial formulation in treating human ulcers and mastitis among cattle has augmented the growth of the nisin market.
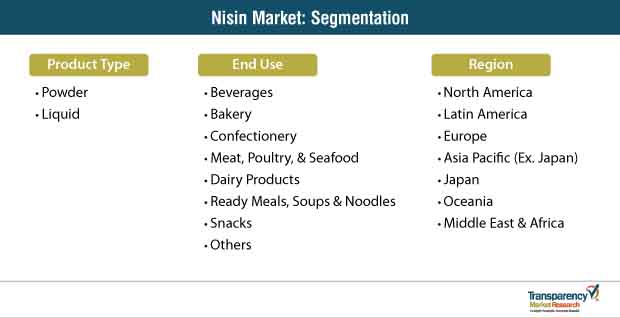
Market players are focused on improving the efficacy of preservatives to meet the needs of the consumers. Players are benefitting from the increasing trend of clean label products. Among the various end-users food and beverage industry has witnessed substantial opportunities. The increasing number of consumers opting for natural and clean labeled products is also boosting the market. Over the past few years, nisin is found in liquid and powdered form. However liquid nisin segment has been projected to show exponential growth in the nisin market.
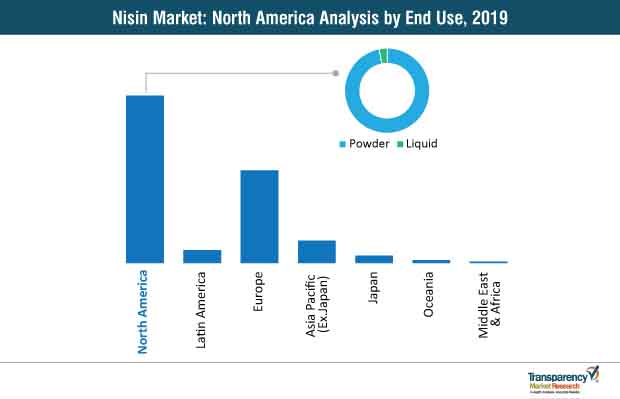
Countries are constantly updating the research activities related to the use of natural preservatives in food products. This has given scope to innovations in the area of preservatives. The growing efforts of government bodies in developed and developing countries to promote natural and safe eating habits will open new avenues in the nisin market over the not-so-distant future. This has been made possible with the approval of nisin as a safe food preservative in commercial use. North America leads the nisin market by holding the major chunk of the market share that accounts for ~54% whereas, Europe holds ~23%of the market share.
Strategic collaborations are also crucial for the growth of the nisin market. The players indulge in mergers, acquisitions, joint ventures, and partnerships. These activities assist in increasing the influence of the players in the nisin market.
Nisin Market is estimated to rise at a CAGR of 5% during forecast period
Growing application in the pharmaceutical to spell growth for nisin market
Asia Pacific is more attractive region for vendors in the Nisin Market
Some of the leading players dominating the global nisin market are Shandong Freda Biotechnology Co., Ltd., Royal DSM N.V., Chihon Biotechnology Co., Ltd., Danisco A/S, Zhejiang Silver-Elephant Bio-engineering Co. Ltd, and MAYASAN Food Industries A.S.
Beverages, Bakery, Confectionery, Meat, Poultry and Seafood, Dairy Products, Ready Meals, Soups and Noodles, Snacks are the end-use segments in the Nisin Market
1. Global Nisin in Food & Beverage Market - Executive Summary
1.1. Global Nisin in Food & Beverage Market Country Analysis
1.2. Vertical Specific Market Penetration
1.3. Application – Product Mapping
1.4. Competition Blueprint
1.5. Technology Time Line Mapping
1.6. TMR Analysis and Recommendations
2. Market Overview
2.1. Market Introduction
2.2. Market Definition
2.3. Market Taxonomy
3. Market Dynamics
3.1. Macro-economic Factors
3.1.1. Rise in Consumption of Food Items across Globe
3.1.2. Global and Regional Per Capita Food Consumption
3.1.3. Population of Key Countries
3.1.4. Food and Beverage Industry Overview
3.2. Trend for Preservation
3.2.1. Natural Preservation
3.2.2. Artificial Preservation
3.3. Drivers
3.3.1. Economic Drivers
3.3.2. Supply Side Drivers
3.3.3. Demand Side Drivers
3.4. Market Restraints
3.4.1. Regulatory concerns
3.4.2. Supply chain issues
3.4.3. Others
3.5. Market Trends
3.6. Trend Analysis- Impact on Time Line (2018-2027)
3.7. Forecast Factors – Relevance and Impact
3.8. Key Regulations By Regions
4. Associated Industry and Key Indicator Assessment
4.1. Food Additives Industry Overview
4.1.1. Market Size and Forecast
4.1.2. Market Size and Y-o-Y Growth
4.1.3. Absolute $ Opportunity
5. Global Nisin in Food & Beverage Market Pricing Analysis
5.1. Price Point Assessment by Form
5.2. Regional Average Pricing Analysis
5.2.1. North America
5.2.2. Latin America
5.2.3. Europe
5.2.4. Asia Pacific Ex. Japan (APEJ)
5.2.5. Japan
5.2.6. Oceania
5.2.7. Middle East and Africa
5.3. Price Forecast till 2027
5.4. Factors Influencing Pricing
6. Global Nisin in Food & Beverage Market Analysis and Forecast
6.1. Market Size Analysis (2013-2016) and Forecast (2018-2026)
6.1.1. Market Value (US$ Mn) and Volume (Tons) and Y-o-Y Growth
6.1.2. Absolute $ Opportunity
6.2. Global Nisin in Food & Beverage Market Scenario Forecast (Optimistic, Likely and Conservative Market Conditions)
6.2.1. Forecast Factors and Relevance of Impact
6.2.2. Regional Nisin in Food & Beverage Market Business Performance Summary
7. Global Nisin in Food & Beverage Market Analysis By Form
7.1. Introduction
7.1.1. Y-o-Y Growth Comparison By Form
7.1.2. Basis Point Share (BPS) Analysis By Form
7.2. Nisin in Food & Beverage Market Size (US$ Mn) and Volume (MT) Analysis (2013-2017) & Forecast (2017-2026) By Form
7.2.1. Powder
7.2.1.1. Beverages
7.2.1.2. Bakery
7.2.1.3. Confectionery
7.2.1.4. Meat, Poultry & Seafood
7.2.1.5. Dairy Products
7.2.1.6. Ready Meals, Soups & Noodles
7.2.1.7. Snacks
7.2.1.8. Others
7.2.2. Liquid
7.2.2.1. Beverages
7.2.2.2. Bakery
7.2.2.3. Confectionery
7.2.2.4. Meat, Poultry & Seafood
7.2.2.5. Dairy Products
7.2.2.6. Ready Meals, Soups & Noodles
7.2.2.7. Snacks
7.2.2.8. Others
7.3. Market Attractiveness Analysis By Form
8. Global Nisin in Food & Beverage Market Analysis By End Use
8.1. Introduction
8.1.1. Y-o-Y Growth Comparison By End Use
8.1.2. Basis Point Share (BPS) Analysis By End Use
8.2. Nisin in Food & Beverage Market Size (US$ Mn) and Volume (MT) Analysis (2013-2017) & Forecast (2018-2026) By End Use
8.2.1. Beverages
8.2.2. Bakery
8.2.3. Confectionery
8.2.4. Meat, Poultry & Seafood
8.2.5. Dairy Products
8.2.6. Ready Meals, Soups & Noodles
8.2.7. Snacks
8.2.8. Others
8.3. Market Attractiveness Analysis By End Use
9. Global Nisin in Food & Beverage Market Analysis and Forecast, By Region
9.1. Introduction
9.1.1. Basis Point Share (BPS) Analysis By Region
9.1.2. Y-o-Y Growth Projections By Region
9.2. Nisin in Food & Beverage Market Size (US$ Mn) and Volume (MT) & Forecast (2018-2026) Analysis By Region
9.2.1. North America
9.2.2. Europe
9.2.3. APEJ
9.2.4. Japan
9.2.5. Oceania
9.2.6. Latin America
9.2.7. Middle East and Africa
9.3. Market Attractiveness Analysis By Region
10. North America Nisin in Food & Beverage Market Analysis and Forecast
10.1. Introduction
10.1.1. Basis Point Share (BPS) Analysis By Country
10.1.2. Y-o-Y Growth Projections By Country
10.2. Nisin in Food & Beverage Market Size (Value (US$) and Volume (MT) Analysis (2013-2018) and Forecast (2018-2026)
10.2.1. Market Attractiveness By Country
10.2.1.1. U.S.
10.2.1.2. Canada
10.2.2. By Form
10.2.3. By End Use
10.3. Market Attractiveness Analysis
10.3.1. By Country
10.3.2. By Form
10.3.3. By End Use
10.4. Drivers and Restraints: Impact Analysis
11. Latin America Nisin in Food & Beverage Market Analysis and Forecast
11.1. Introduction
11.1.1. Basis Point Share (BPS) Analysis By Country
11.1.2. Y-o-Y Growth Projections By Country
11.1.3. Key Regulations
11.2. Nisin in Food & Beverage Market Size (Value (US$) and Volume (MT) Analysis (2013-2018) and Forecast (2018-2026)
11.2.1. By Country
11.2.1.1. Brazil
11.2.1.2. Mexico
11.2.1.3. Chile
11.2.1.4. Peru
11.2.1.5. Argentina
11.2.1.6. Rest of Latin America
11.2.2. By Form
11.2.3. By End Use
11.3. Market Attractiveness Analysis
11.3.1. By Country
11.3.2. By Form
11.3.3. By End Use
11.4. Drivers and Restraints: Impact Analysis
12. Europe Nisin in Food & Beverage Market Analysis and Forecast
12.1. Introduction
12.1.1. Basis Point Share (BPS) Analysis By Country
12.1.2. Y-o-Y Growth Projections By Country
12.1.3. Key Regulations
12.2. Nisin in Food & Beverage Market Size (Value (US$) and Volume (MT) Analysis (2012-2018) and Forecast (2018-2026)
12.2.1. By Country
12.2.1.1. EU-4 (Germany, France, Italy, Spain)
12.2.1.2. U.K.
12.2.1.3. BENELUX
12.2.1.4. Nordic
12.2.1.5. Russia
12.2.1.6. Poland
12.2.1.7. Rest of Europe
12.2.2. By Form
12.2.3. By End Use
12.3. Market Attractiveness Analysis
12.3.1. By Country
12.3.2. By Form
12.3.3. By End Use
12.4. Drivers and Restraints: Impact Analysis
13. APEJ Nisin in Food & Beverage Market Analysis and Forecast
13.1. Introduction
13.1.1. Basis Point Share (BPS) Analysis By Country
13.1.2. Y-o-Y Growth Projections By Country
13.1.3. Key Regulations
13.2. Nisin in Food & Beverage Market Size (Value (US$) and Volume (MT) Analysis (2013-2018) and Forecast (2018-2026)
13.2.1. By Country
13.2.1.1. India
13.2.1.2. China
13.2.1.3. South Korea
13.2.1.4. South East Asia (ASEAN)
13.2.1.4.1. Thailand
13.2.1.4.2. Indonesia
13.2.1.4.3. Malaysia
13.2.1.4.4. Philippines
13.2.1.4.5. Other ASEAN Countries
13.2.1.5. Others
13.2.2. By Form
13.2.3. By End Use
13.3. Market Attractiveness Analysis
13.3.1. By Country
13.3.2. By Form
13.3.3. By End Use
13.4. Drivers and Restraints: Impact Analysis
14. Japan Nisin in Food & Beverage Market Analysis and Forecast
14.1. Introduction
14.1.1. Basis Point Share (BPS) Analysis By Country
14.1.2. Y-o-Y Growth Projections By Country
14.1.3. Key Regulations
14.2. Nisin in Food & Beverage Market Size (Value (US$) and Volume (MT) Analysis (2013-2018) and Forecast (2018-2026)
14.2.1. By Form
14.2.2. By End Use
14.3. Market Attractiveness Analysis
14.3.1. By Form
14.3.2. By End Use
14.4. Drivers and Restraints: Impact Analysis
15. Oceania Nisin in Food & Beverage Market Analysis and Forecast
15.1. Introduction
15.1.1. Basis Point Share (BPS) Analysis By Country
15.1.2. Y-o-Y Growth Projections By Country
15.1.3. Key Regulations
15.2. Nisin in Food & Beverage Market Size (Value (US$) and Volume (MT) Analysis (2013-2018) and Forecast (2018-2026)
15.2.1. By Form
15.2.2. By End Use
15.3. Market Attractiveness Analysis
15.3.1. By Form
15.3.2. By End Use
15.4. Drivers and Restraints: Impact Analysis
16. Middle East and Africa (MEA) Nisin in Food & Beverage Market Analysis and Forecast
16.1. Introduction
16.1.1. Basis Point Share (BPS) Analysis By Country
16.1.2. Y-o-Y Growth Projections By Country
16.1.3. Key Regulations
16.2. Nisin in Food & Beverage Market Size (Value (US$) and Volume (MT) Analysis (2013-2018) and Forecast (2018-2026)
16.2.1. By Country
16.2.1.1. GCC Countries
16.2.1.2. South Africa
16.2.1.3. North Africa
16.2.1.4. Rest of MEA
16.2.2. By Form
16.2.3. By End Use
16.3. Market Attractiveness Analysis
16.3.1. By Country
16.3.2. By Form
16.3.3. By End Use
16.4. Drivers and Restraints: Impact Analysis
17. Thailand Nisin in Food & Beverage Market Analysis and Forecast
17.1. Introduction
17.1.1. Basis Point Share (BPS) Analysis
17.1.2. Y-o-Y Growth Projections
17.1.3. Key Regulations
17.2. Nisin in Food & Beverage Market Size (Value (US$) and Volume (MT) Analysis (2013-2017) and Forecast (2017-2026)
17.2.1. By Form
17.2.2. By End Use
17.3. Market Attractiveness Analysis
17.3.1. By Form
17.3.2. By End Use
18. Recommendation – Critical Success Factors
List of Tables
Table 01: Global Nisin Market Value (US$ Mn) by Region, 2019 & 2028
Table 02: Global Nisin Market Volume (MT) by Region, 2019 & 2028
Table 03: Global Nisin Market Value (US$ Mn) by Form, 2019 & 2028
Table 04: Global Nisin Market Volume (MT) by Form, 2019 & 2028
Table 05: Global Nisin Market Value (US$ Mn) by Form, 2019 & 2028
Table 06: Global Nisin Market Volume (MT) by Form, 2019 & 2028
Table 07: Global Nisin Market Value (US$ Mn) by Form, 2019 & 2028
Table 08: Global Nisin Market Volume (MT) by Form, 2019 & 2028
Table 09: Global Nisin Market Value (US$ Mn) by End Use, 2019 & 2028
Table 10: Global Nisin Market Volume (MT) by End Use, 2019 & 2028
Table 11: North America Nisin Market Value (US$ Mn) by Country, 2019 & 2028
Table 12: North America Nisin Market Volume (MT) by Country, 2019 & 2028
Table 13: North America Nisin Market Value (US$ Mn) by Form, 2019 & 2028
Table 14: North America Nisin Market Volume (MT) by Form, 2019 & 2028
Table 15: North America Nisin Market Value (US$ Mn) by Form, 2019 & 2028
Table 16: North America Nisin Market Volume (MT) by Form, 2019 & 2028
Table 17: North America Nisin Market Value (US$ Mn) by Form, 2019 & 2028
Table 18: North America Nisin Market Volume (MT) by Form, 2019 & 2028
Table 19: North America Nisin Market Value (US$ Mn) by End Use, 2019 & 2028
Table 20: North America Nisin Market Volume (MT) by End Use, 2019 & 2028
Table 21: Latin America Nisin Market Value (US$ Mn) by Country, 2019 & 2028
Table 22: Latin America Nisin Market Volume (MT) by Country, 2019 & 2028
Table 23: Latin America Nisin Market Value (US$ Mn) by Form, 2019 & 2028
Table 24: Latin America Nisin Market Volume (MT) by Form, 2019 & 2028
Table 25: Latin America Nisin Market Value (US$ Mn) by Form, 2019 & 2028
Table 26: Latin America Nisin Market Volume (MT) by Form, 2019 & 2028
Table 27: Latin America Nisin Market Value (US$ Mn) by Form, 2019 & 2028
Table 28: Latin America Nisin Market Volume (MT) by Form, 2019 & 2028
Table 29: Latin America Nisin Market Value (US$ Mn) by End Use, 2019 & 2028
Table 30: Latin America Nisin Market Volume (MT) by End Use, 2019 & 2028
Table 31: Europe Nisin Market Value (US$ Mn) by Country, 2019 & 2028
Table 32: Europe Nisin Market Volume (MT) by Country, 2019 & 2028
Table 33: Europe Nisin Market Value (US$ Mn) by Form, 2019 & 2028
Table 34: Europe Nisin Market Volume (MT) by Form, 2019 & 2028
Table 35: Europe Nisin Market Value (US$ Mn) by Form, 2019 & 2028
Table 36: Europe Nisin Market Volume (MT) by Form, 2019 & 2028
Table 37: Europe Nisin Market Value (US$ Mn) by Form, 2019 & 2028
Table 38: Europe Nisin Market Volume (MT) by Form, 2019 & 2028
Table 39: Europe Nisin Market Value (US$ Mn) by End Use, 2019 & 2028
Table 40: Europe Nisin Market Volume (MT) by End Use, 2019 & 2028
Table 41: APEJ Nisin Market Value (US$ Mn) by Country, 2019 & 2028
Table 42: APEJ Nisin Market Volume (MT) by Country, 2019 & 2028
Table 43: APEJ Nisin Market Value (US$ Mn) by Form, 2019 & 2028
Table 44: APEJ Nisin Market Volume (MT) by Form, 2019 & 2028
Table 45: APEJ Nisin Market Value (US$ Mn) by Form, 2019 & 2028
Table 46: APEJ Nisin Market Volume (MT) by Form, 2019 & 2028
Table 47: APEJ Nisin Market Value (US$ Mn) by Form, 2019 & 2028
Table 48: APEJ Nisin Market Volume (MT) by Form, 2019 & 2028
Table 49: APEJ Nisin Market Value (US$ Mn) by End Use, 2019 & 2028
Table 50: APEJ Nisin Market Volume (MT) by End Use, 2019 & 2028
Table 51: Japan Nisin Market Value (US$ Mn) by Form, 2019 & 2028
Table 52: Japan Nisin Market Volume (MT) by Form, 2019 & 2028
Table 53: Japan Nisin Market Value (US$ Mn) by Form, 2019 & 2028
Table 54: Japan Nisin Market Volume (MT) by Form, 2019 & 2028
Table 55: Japan Nisin Market Value (US$ Mn) by Form, 2019 & 2028
Table 56: Japan Nisin Market Volume (MT) by Form, 2019 & 2028
Table 57: Japan Nisin Market Value (US$ Mn) by End Use, 2019 & 2028
Table 58: Japan Nisin Market Volume (MT) by End Use, 2019 & 2028
Table 59: Oceania Nisin Market Value (US$ Mn) by Country, 2019 & 2028
Table 60: Oceania Nisin Market Volume (MT) by Country, 2019 & 2028
Table 61: Oceania Nisin Market Value (US$ Mn) by Form, 2019 & 2028
Table 62: Oceania Nisin Market Volume (MT) by Form, 2019 & 2028
Table 63: Oceania Nisin Market Value (US$ Mn) by Form, 2019 & 2028
Table 64: Oceania Nisin Market Volume (MT) by Form, 2019 & 2028
Table 65: Oceania Nisin Market Value (US$ Mn) by Form, 2019 & 2028
Table 66: Oceania Nisin Market Volume (MT) by Form, 2019 & 2028
Table 67: Oceania Nisin Market Value (US$ Mn) by End Use, 2019 & 2028
Table 68: Oceania Nisin Market Volume (MT) by End Use, 2019 & 2028
Table 69: MEA Nisin Market Value (US$ Mn) by Country, 2019 & 2028
Table 70: MEA Nisin Market Volume (MT) by Country, 2019 & 2028
Table 71: MEA Nisin Market Value (US$ Mn) by Form, 2019 & 2028
Table 72: MEA Nisin Market Volume (MT) by Form, 2019 & 2028
Table 73: MEA Nisin Market Value (US$ Mn) by Form, 2019 & 2028
Table 74: MEA Nisin Market Volume (MT) by Form, 2019 & 2028
Table 75: MEA Nisin Market Value (US$ Mn) by Form, 2019 & 2028
Table 76: MEA Nisin Market Volume (MT) by Form, 2019 & 2028
Table 77: MEA Nisin Market Value (US$ Mn) by End Use, 2019 & 2028
Table 78: MEA Nisin Market Volume (MT) by End Use, 2019 & 2028
Table 79: Thailand Nisin Market Value (US$ Mn) by Form, 2019 & 2028
Table 80: Thailand Nisin Market Volume (MT) by Form, 2019 & 2028
Table 81: Thailand Nisin Market Value (US$ Mn) by Form, 2019 & 2028
Table 82: Thailand Nisin Market Volume (MT) by Form, 2019 & 2028
Table 83: Thailand Nisin Market Value (US$ Mn) by Form, 2019 & 2028
Table 84: Thailand Nisin Market Volume (MT) by Form, 2019 & 2028
Table 85: Thailand Nisin Market Value (US$ Mn) by End Use, 2019 & 2028
Table 86: Thailand Nisin Market Volume (MT) by End Use, 2019 & 2028
List of Figures
Figure 01: Global Nisin Market Value (US$ Mn) and Volume (MT) Forecast, 2018–2028
Figure 02: Global Nisin Market Absolute $ Opportunity (US$ Mn), 2018–2028
Figure 03: Global Nisin Market Value (US$ Mn) by Region, 2019 & 2028
Figure 04: Global Nisin Market Value (US$ Mn) by Form, 2019 & 2028
Figure 05: Global Nisin Market Value (US$ Mn) by End Use, 2019 & 2028
Figure 06: Global Nisin Market Share (%) & BPS Analysis by Region, 2019 & 2028
Figure 07: Global Nisin Market Share (%) & BPS Analysis by Region, 2019 & 2028
Figure 08: Global Nisin Market Share (%) & BPS Analysis by Form, 2019 & 2028
Figure 09: Global Nisin Market Share (%) & BPS Analysis by Form, 2019 & 2028
Figure 10: Global Nisin Market Share (%) & BPS Analysis by End Use, 2019 & 2028
Figure 11: Global Nisin Market Share (%) & BPS Analysis by End Use, 2019 & 2028
Figure 12: Global Nisin Market Value (US$ Mn) by Region, 2019 & 2028
Figure 13: Global Nisin Market Value (US$ Mn) by Form, 2019 & 2028
Figure 14: Global Nisin Market Value (US$ Mn) by End Use, 2019 & 2028
Figure 15: North America Nisin Market Value (US$ Mn) by Country, 2019 & 2028
Figure 16: North America Nisin Market Value (US$ Mn) by Form, 2019 & 2028
Figure 17: North America Nisin Market Value (US$ Mn) by End Use, 2019 & 2028
Figure 18: North America Nisin Market Share (%) & BPS Analysis by Country, 2019 & 2028
Figure 19: North America Nisin Market Share (%) & BPS Analysis by Country, 2019 & 2028
Figure 20: North America Nisin Market Value (US$ Mn) by Country, 2019 & 2028
Figure 21: North America Nisin Market Value (US$ Mn) by Form, 2019 & 2028
Figure 22: North America Nisin Market Value (US$ Mn) by End Use, 2019 & 2028
Figure 23: Latin America Nisin Market Value (US$ Mn) by Country, 2019 & 2028
Figure 24: Latin America Nisin Market Value (US$ Mn) by Form, 2019 & 2028
Figure 25: Latin America Nisin Market Value (US$ Mn) by End Use, 2019 & 2028
Figure 26: Latin America Nisin Market Share (%) & BPS Analysis by Country, 2019 & 2028
Figure 27: Latin America Nisin Market Share (%) & BPS Analysis by Country, 2019 & 2028
Figure 28: Latin America Nisin Market Value (US$ Mn) by Country, 2019 & 2028
Figure 29: Latin America Nisin Market Value (US$ Mn) by Form, 2019 & 2028
Figure 30: Latin America Nisin Market Value (US$ Mn) by End Use, 2019 & 2028
Figure 31: Europe Nisin Market Value (US$ Mn) by Country, 2019 & 2028
Figure 32: Europe Nisin Market Value (US$ Mn) by Form, 2019 & 2028
Figure 33: Europe Nisin Market Value (US$ Mn) by End Use, 2019 & 2028
Figure 34: Europe Nisin Market Share (%) & BPS Analysis by Country, 2019 & 2028
Figure 35: Europe Nisin Market Share (%) & BPS Analysis by Country, 2019 & 2028
Figure 36: Europe Nisin Market Value (US$ Mn) by Country, 2019 & 2028
Figure 37: Europe Nisin Market Value (US$ Mn) by Form, 2019 & 2028
Figure 38: Europe Nisin Market Value (US$ Mn) by End Use, 2019 & 2028
Figure 39: APEJ Nisin Market Value (US$ Mn) by Country, 2019 & 2028
Figure 40: APEJ Nisin Market Value (US$ Mn) by Form, 2019 & 2028
Figure 41: APEJ Nisin Market Value (US$ Mn) by End Use, 2019 & 2028
Figure 42: APEJ Nisin Market Share (%) & BPS Analysis by Country, 2019 & 2028
Figure 43: APEJ Nisin Market Share (%) & BPS Analysis by Country, 2019 & 2028
Figure 44: APEJ Nisin Market Value (US$ Mn) by Country, 2019 & 2028
Figure 45: APEJ Nisin Market Value (US$ Mn) by Form, 2019 & 2028
Figure 46: APEJ Nisin Market Value (US$ Mn) by End Use, 2019 & 2028
Figure 47: Japan Nisin Market Value (US$ Mn) by Form, 2019 & 2028
Figure 48: Japan Nisin Market Value (US$ Mn) by End Use, 2019 & 2028
Figure 49: Japan Nisin Market Value (US$ Mn) by Form, 2019 & 2028
Figure 50: Japan Nisin Market Value (US$ Mn) by End Use, 2019 & 2028
Figure 51: Oceania Nisin Market Value (US$ Mn) by Country, 2019 & 2028
Figure 52: Oceania Nisin Market Value (US$ Mn) by Form, 2019 & 2028
Figure 53: Oceania Nisin Market Value (US$ Mn) by End Use, 2019 & 2028
Figure 54: Oceania Nisin Market Share (%) & BPS Analysis by Country, 2019 & 2028
Figure 55: Oceania Nisin Market Share (%) & BPS Analysis by Country, 2019 & 2028
Figure 56: Oceania Nisin Market Value (US$ Mn) by Country, 2019 & 2028
Figure 57: Oceania Nisin Market Value (US$ Mn) by Form, 2019 & 2028
Figure 58: Oceania Nisin Market Value (US$ Mn) by End Use, 2019 & 2028
Figure 59: MEA Nisin Market Value (US$ Mn) by Country, 2019 & 2028
Figure 60: MEA Nisin Market Value (US$ Mn) by Form, 2019 & 2028
Figure 61: MEA Nisin Market Value (US$ Mn) by End Use, 2019 & 2028
Figure 62: MEA Nisin Market Share (%) & BPS Analysis by Country, 2019 & 2028
Figure 63: MEA Nisin Market Share (%) & BPS Analysis by Country, 2019 & 2028
Figure 64: MEA Nisin Market Value (US$ Mn) by Country, 2019 & 2028
Figure 65: MEA Nisin Market Value (US$ Mn) by Form, 2019 & 2028
Figure 66: MEA Nisin Market Value (US$ Mn) by End Use, 2019 & 2028
Figure 67: Thailand Nisin Market Value (US$ Mn) by Form, 2019 & 2028
Figure 68: Thailand Nisin Market Value (US$ Mn) by End Use, 2019 & 2028
Figure 69: Thailand Nisin Market Value (US$ Mn) by Form, 2019 & 2028
Figure 70: Thailand Nisin Market Value (US$ Mn) by End Use, 2019 & 2028
Copyright © Transparency Market Research, Inc. All Rights reserved
Trust Online

Nisin Market