
Reports
Reports
Global Neuromicroscopy Market: Snapshot
Companies are integrating latest technologies to provide devices at affordable cost. Moreover, increase in the number of neurosurgeries, the rise in the customized microscopy solutions and the increase in funds by government in various countries for healthcare sector are also contributing towards the growth of the global market for neuromicroscopy. Manufacturers are also designing new neurosurgical microscopes with video technology, thereby providing an option to view and record procedures. High-resolution images along with the high-speed autofocus are also being provided by manufacturers. Meanwhile, integration of Virtual Reality (VR) technology in microscope imaging system is also gaining traction in the global market for neuromicroscopy. Also, the rise in geriatric population is fueling the demand for better treatment.
However, increased cost of advanced microscopes and heavy custom and excise duty imposed by government in various countries are negatively impacting the growth of the market.
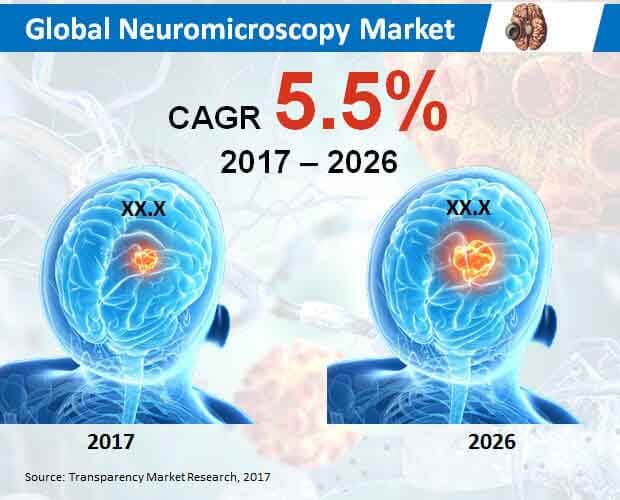
As per the latest study by Transparency Market Research (TMR), the global market for neuromicroscopy is anticipated to experience steady growth. The market is estimated to increase to 5.5% CAGR during 2017-2026, reaching US$ 99.7 million revenue towards 2026 end.
Devices- Top-Selling Product
Devices are likely to be one of the top-selling products in the global market for neuromicroscopy. By 2026 end, devices are estimated to reach nearly US$ 80 million revenue. Meanwhile, softwares are also anticipated to witness strong growth during 2017-2026. With the rise in the various neurological disorders, manufacturers are producing advanced devices that can help in diagnoses as well as assist in surgical procedures.
Hospitals to Emerge as the Largest End Users in the Global Market for Neuromicroscopy
Compared to the various end users, hospitals are likely to gain more than half of the revenue share towards 2017 end. Hospitals are estimated to reach nearly US$ 60 million revenue towards 2026 end. Meanwhile, specialty clinics are also likely to witness growth between 2017 and 2026.
Standalone Devices to Gain Maximum Revenue Share
Standalone devices are likely to account for more than half of the revenue share by 2017 end. Standalone devices are also estimated to exceed US$ 70 million revenue by 2026 end.
Europe to Remain Dominant in the Global Neuromicroscopy Market during 2017-2026
Europe is anticipated to emerge as the most attractive region in the global market for neuromicroscopy. The region is also likely to witness robust growth between 2017 and 2026. Medical tourism initiatives are being taken up, especially to treat critical diseases such as cancer. Moreover, various universities and institutions in the region are also conducting research in the field of neuroscience to come up with the devices that can help in the treatment of various neurological disorders.
On the other hand, North America is also anticipated to witness growth in the neuromicroscopy market between 2017 and 2026. Government is taking an initiative to support on-going research in the field of neuroscience and also the presence of major market players are some of the factors driving the growth of neuromicroscopy market. Asia Pacific Excluding Japan (APEJ) also presents an opportunity for market players, owing to the increase in healthcare expenditure in countries such as India and China.
Competition Tracking
Major participants in the global market for neuromicroscopy market include Hitachi Ltd, GE Healthcare Inc., Siemens AG, Carl Zeiss Meditec AG, Koninklijke Philips N.V., Danaher Corporation, Pridex Medicare Pvt. Ltd., Synaptive Medical Inc., and Haag-Streit AG. Major market players are trying to gain competitive advantage by focusing on innovative technologies.
Global Neuromicroscopy Market to Grow with Advancements in Healthcare Infrastructure
The demand within the global neuromicroscopy market is slated to grow alongside advancements in microbiological research. This is a seemingly trivial driver of demand for the market, but it holds formidable trends associated with it. Microbiology is responsible for several new research explorations across the global healthcare industry. The use of the technique for studying the functioning of the human body, and its associated dynamics, has given an impetus to market expansion. Moreover, the application of neuromicroscopy across a multitude of research sectors for the purpose of acquiring accuracy and precision has also aided market expansion. Henceforth, the global neuromicroscopy market is at the brink of acquiring fresh revenues in the times to come.
Chapter 1 Global Outlook
Chapter 2 Global Neuromicroscopy Market - Executive Summary
Chapter 3 Global Neuromicroscopy Market Overview
3.1 Introduction
3.1.1 Global Neuromicroscopy Market Taxonomy
3.1.2 Global Neuromicroscopy Market Definition
3.2 Global Neuromicroscopy Market Size (US$ Mn) and Forecast, 2012-2026
3.2.1 Global Neuromicroscopy Market Y-o-Y Growth
3.3 Global Neuromicroscopy Market Dynamics
3.4 Supply Chain
3.5 Cost Structure
3.6 Technology Roadmap
3.7 Strategies Followed by Key Companies in the Market
3.8 List of Distributors
3.9 Medical Device Regulation
3.9.1 Medical Device Regulation in United States
3.9.2 Medical Device Regulation in Europe
3.9.3 Medical Device Regulation in Japan
3.10 PATENTS
3.11 PESTL Analysis
3.12 Product Life Cycle
3.13 Key Participants Market Presence (Intensity Map) By Region
Chapter 4 Global Neuromicroscopy Market Analysis and Forecast 2012-2026
4.1 Global Neuromicroscopy Market Size and Forecast by Product Type, 2012-2026
4.1.1 Devices Market Size and Forecast, 2012-2026
4.1.1.1 Revenue (US$ Mn) Comparison, By Region
4.1.1.2 Market Share Comparison, By Region
4.1.1.3 Y-o-Y growth Comparison, By Region
4.1.2 Softwares Market Size and Forecast, 2012-2026
4.1.2.1 Revenue (US$ Mn) Comparison, By Region
4.1.2.2 Market Share Comparison, By Region
4.1.2.3 Y-o-Y growth Comparison, By Region
4.1.3 Services Market Size and Forecast, 2012-2026
4.1.3.1 Revenue (US$ Mn) Comparison, By Region
4.1.3.2 Market Share Comparison, By Region
4.1.3.3 Y-o-Y growth Comparison, By Region
4.2 Global Neuromicroscopy Market Size and Forecast by End User, 2012-2026
4.2.1 Hospitals Market Size and Forecast, 2012-2026
4.2.1.1 Revenue (US$ Mn) Comparison, By Region
4.2.1.2 Market Share Comparison, By Region
4.2.1.3 Y-o-Y growth Comparison, By Region
4.2.2 Ambulatory Surgical Centers Market Size and Forecast, 2012-2026
4.2.2.1 Revenue (US$ Mn) Comparison, By Region
4.2.2.2 Market Share Comparison, By Region
4.2.2.3 Y-o-Y growth Comparison, By Region
4.2.3 Specialty Clinics Market Size and Forecast, 2012-2026
4.2.3.1 Revenue (US$ Mn) Comparison, By Region
4.2.3.2 Market Share Comparison, By Region
4.2.3.3 Y-o-Y growth Comparison, By Region
4.3 Global Neuromicroscopy Market Size and Forecast by Modality, 2012-2026
4.3.1 Standalone Devices Market Size and Forecast, 2012-2026
4.3.1.1 Revenue (US$ Mn) Comparison, By Region
4.3.1.2 Market Share Comparison, By Region
4.3.1.3 Y-o-Y growth Comparison, By Region
4.3.2 Portable Devices Market Size and Forecast, 2012-2026
4.3.2.1 Revenue (US$ Mn) Comparison, By Region
4.3.2.2 Market Share Comparison, By Region
4.3.2.3 Y-o-Y growth Comparison, By Region
Chapter 5 North America Neuromicroscopy Market Size and Forecast, 2012-2026
5.1 North America Market Outlook
5.2 Revenue (US$ Mn) Comparison, By Country
5.3 Revenue (US$ Mn) Comparison, By Product Type
5.4 Revenue (US$ Mn) Comparison, By End User
5.5 Revenue (US$ Mn) Comparison, By Modality
Chapter 6 Latin America Neuromicroscopy Market Size and Forecast, 2012-2026
6.1 Latin America Market Outlook
6.2 Revenue (US$ Mn) Comparison, By Country
6.3 Revenue (US$ Mn) Comparison, By Product Type
6.4 Revenue (US$ Mn) Comparison, By End User
6.5 Revenue (US$ Mn) Comparison, By Modality
Chapter 7 Europe Neuromicroscopy Market Size and Forecast, 2012-2026
7.1 Europe Market Outlook
7.2 Revenue (US$ Mn) Comparison, By Country
7.3 Revenue (US$ Mn) Comparison, By Product Type
7.4 Revenue (US$ Mn) Comparison, By End User
7.5 Revenue (US$ Mn) Comparison, By Modality
Chapter 8 Japan Neuromicroscopy Market Size and Forecast, 2012-2026
8.1 Japan Market Outlook
8.2 Revenue (US$ Mn) Comparison, By Country
8.3 Revenue (US$ Mn) Comparison, By Product Type
8.4 Revenue (US$ Mn) Comparison, By End User
8.5 Revenue (US$ Mn) Comparison, By Modality
Chapter 9 APEJ Neuromicroscopy Market Size and Forecast, 2012-2026
9.1 APEJ Market Outlook
9.2 Revenue (US$ Mn) Comparison, By Country
9.3 Revenue (US$ Mn) Comparison, By Product Type
9.4 Revenue (US$ Mn) Comparison, By End User
9.5 Revenue (US$ Mn) Comparison, By Modality
Chapter 10 MEA Neuromicroscopy Market Size and Forecast, 2012-2026
10.1 MEA Market Outlook
10.2 Revenue (US$ Mn) Comparison, By Country
10.3 Revenue (US$ Mn) Comparison, By Product Type
10.4 Revenue (US$ Mn) Comparison, By End User
10.5 Revenue (US$ Mn) Comparison, By Modality
Chapter 11 Global Neuromicroscopy Market – Competitive Landscape and Company Profiles
11.1 Global Neuromicroscopy Market – Company Share Analysis
11.2 Global Neuromicroscopy Market – Competitive Landscape
11.3 Global Neuromicroscopy Market – Company Profiles
11.3.1 Carl Zeiss Meditec AG
11.3.1.1 Company Overview
11.3.1.2 Product Overview
11.3.1.3 Key Financials
11.3.1.4 Key Developments
11.3.2 Danaher Corporation
11.3.2.1 Company Overview
11.3.2.2 Product Overview
11.3.2.3 Key Financials
11.3.2.4 SWOT Analysis
11.3.3 GE Healthcare Inc
11.3.3.1 Company Overview
11.3.3.2 Product Overview
11.3.3.3 Key Financials
11.3.3.4 Key Developments
11.3.4 Siemens AG
11.3.4.1 Company Overview
11.3.4.2 Product Overview
11.3.4.3 Key Financials
11.3.4.4 Key Developments
11.3.4.5 SWOT Analysis
11.3.5 Koninklijke Philips N.V.
11.3.5.1 Company Overview
11.3.5.2 Product Overview
11.3.5.3 Key Financials
11.3.5.4 Key Developments
11.3.5.5 SWOT Analysis
11.3.6 Hitachi Ltd
11.3.6.1 Company Overview
11.3.6.2 Product Overview
11.3.6.3 Key Financials
11.3.6.4 Key Developments
11.3.6.5 SWOT Analysis
11.3.7 Haag-Streit AG
11.3.7.1 Company Overview
11.3.7.2 Product Overview
11.3.8 Synaptive Medical Inc.
11.3.8.1 Company Overview
11.3.8.2 Product Overview
11.3.9 Pridex Medicare Pvt. Ltd.
11.3.9.1 Company Overview
11.3.9.2 Product Overview
11.4 Key Takeaways – Neuromicroscopy Market
Chapter 12 PMR Research Methodology
Chapter 13 Disclaimer
List of Tables
TABLE 1 Global Neuromicroscopy Market Value (US$ Mn), 2012-2017
TABLE 2 Global Neuromicroscopy Market Value (US$ Mn), 2018-2026
TABLE 3 Global Neuromicroscopy Market Value (US$ Mn) and Y-o-Y, 2017-2026
TABLE 4 Global Devices Segment Value (US$ Mn), By Region 2012-2017
TABLE 5 Global Devices Segment Value (US$ Mn), By Region 2018-2026
TABLE 6 Global Devices Segment Market Share, By Region 2012-2017
TABLE 7 Global Devices Segment Market Share, By Region 2018-2026
TABLE 8 Global Devices Segment Y-o-Y, By Region 2017-2026
TABLE 9 Global Softwares Segment Value (US$ Mn), By Region 2012-2017
TABLE 10 Global Softwares Segment Value (US$ Mn), By Region 2018-2026
TABLE 11 Global Softwares Segment Market Share, By Region 2012-2017
TABLE 12 Global Softwares Segment Market Share, By Region 2018-2026
TABLE 13 Global Softwares Segment Y-o-Y, By Region 2017-2026
TABLE 14 Global Services Segment Value (US$ Mn), By Region 2012-2017
TABLE 15 Global Services Segment Value (US$ Mn), By Region 2018-2026
TABLE 16 Global Services Segment Market Share, By Region 2012-2017
TABLE 17 Global Services Segment Market Share, By Region 2018-2026
TABLE 18 Global Services Segment Y-o-Y, By Region 2017-2026
TABLE 19 Global Hospitals Segment Value (US$ Mn), By Region 2012-2017
TABLE 20 Global Hospitals Segment Value (US$ Mn), By Region 2018-2026
TABLE 21 Global Hospitals Segment Market Share, By Region 2012-2017
TABLE 22 Global Hospitals Segment Market Share, By Region 2018-2026
TABLE 23 Global Hospitals Segment Y-o-Y, By Region 2017-2026
TABLE 24 Global Ambulatory Surgical Centers Segment Value (US$ Mn), By Region 2012-2017
TABLE 25 Global Ambulatory Surgical Centers Segment Value (US$ Mn), By Region 2018-2026
TABLE 26 Global Ambulatory Surgical Centers Segment Market Share, By Region 2012-2017
TABLE 27 Global Ambulatory Surgical Centers Segment Market Share, By Region 2018-2026
TABLE 28 Global Ambulatory Surgical Centers Segment Y-o-Y, By Region 2017-2026
TABLE 29 Global Specialty Clinics Segment Value (US$ Mn), By Region 2012-2017
TABLE 30 Global Specialty Clinics Segment Value (US$ Mn), By Region 2018-2026
TABLE 31 Global Specialty Clinics Segment Market Share, By Region 2012-2017
TABLE 32 Global Specialty Clinics Segment Market Share, By Region 2018-2026
TABLE 33 Global Specialty Clinics Segment Y-o-Y, By Region 2017-2026
TABLE 34 Global Standalone Devices Segment Value (US$ Mn), By Region 2012-2017
TABLE 35 Global Standalone Devices Segment Value (US$ Mn), By Region 2018-2026
TABLE 36 Global Standalone Devices Segment Market Share, By Region 2012-2017
TABLE 37 Global Standalone Devices Segment Market Share, By Region 2018-2026
TABLE 38 Global Standalone Devices Segment Y-o-Y, By Region 2017-2026
TABLE 39 Global Portable Devices Segment Value (US$ Mn), By Region 2012-2017
TABLE 40 Global Portable Devices Segment Value (US$ Mn), By Region 2018-2026
TABLE 41 Global Portable Devices Segment Market Share, By Region 2012-2017
TABLE 42 Global Portable Devices Segment Market Share, By Region 2018-2026
TABLE 43 Global Portable Devices Segment Y-o-Y, By Region 2017-2026
TABLE 44 North America Current Expenditure on Health, (% of GDP), by Country, 2010 – 2016
TABLE 45 North America Per Capita Health Expenditure (US$ PPP), by Country, 2010 - 2016
TABLE 46 North America Per Capita Healthcare Expenditure Y-o-Y Growth (in Real terms %), by Country, 2010 - 2016
TABLE 47 North America Out-of-Pocket Healthcare Expenditure, % of Healthcare Expenditure, by Country, 2010 - 2016
TABLE 48 North America Per Capita Healthcare Expenditure (at Current Price, in US$), by Country, 2010 - 2016
TABLE 49 North America Neuromicroscopy Market Value (US$ Mn), By Country 2012-2017
TABLE 50 North America Neuromicroscopy Market Value (US$ Mn), By Country 2018-2026
TABLE 51 North America Neuromicroscopy Market Value (US$ Mn), By Product Type 2012-2017
TABLE 52 North America Neuromicroscopy Market Value (US$ Mn), By Product Type 2018-2026
TABLE 53 North America Neuromicroscopy Market Value (US$ Mn), By End User 2012-2017
TABLE 54 North America Neuromicroscopy Market Value (US$ Mn), By End User 2018-2026
TABLE 55 North America Neuromicroscopy Market Value (US$ Mn), By Modality 2012-2017
TABLE 56 North America Neuromicroscopy Market Value (US$ Mn), By Modality 2018-2026
TABLE 57 Latin America Current Expenditure on Health, (% of GDP), by Country, 2010 – 2016
TABLE 58 Latin America Per Capita Health Expenditure (US$ PPP), by Country, 2010 - 2016
TABLE 59 Latin America Per Capita Healthcare Expenditure Y-o-Y Growth (in Real terms %), by Country, 2010 - 2016
TABLE 60 Latin America Out-of-Pocket Healthcare Expenditure, % of Healthcare Expenditure, by Country, 2010 - 2016
TABLE 61 Latin America Per Capita Healthcare Expenditure (at Current Price, in US$), by Country, 2010 - 2016
TABLE 62 Latin America Neuromicroscopy Market Value (US$ Mn), By Country 2012-2017
TABLE 63 Latin America Neuromicroscopy Market Value (US$ Mn), By Country 2018-2026
TABLE 64 Latin America Neuromicroscopy Market Value (US$ Mn), By Product Type 2012-2017
TABLE 65 Latin America Neuromicroscopy Market Value (US$ Mn), By Product Type 2018-2026
TABLE 66 Latin America Neuromicroscopy Market Value (US$ Mn), By End User 2012-2017
TABLE 67 Latin America Neuromicroscopy Market Value (US$ Mn), By End User 2018-2026
TABLE 68 Latin America Neuromicroscopy Market Value (US$ Mn), By Modality 2012-2017
TABLE 69 Latin America Neuromicroscopy Market Value (US$ Mn), By Modality 2018-2026
TABLE 70 Europe Current Expenditure on Health, (% of GDP), by Country, 2010 – 2016
TABLE 71 Europe Per Capita Health Expenditure (US$ PPP), by Country, 2010 - 2016
TABLE 72 Europe Per Capita Healthcare Expenditure Y-o-Y Growth (in Real terms %), by Country, 2010 - 2016
TABLE 73 Europe Out-of-Pocket Healthcare Expenditure, % of Healthcare Expenditure, by Country, 2010 - 2016
TABLE 74 Europe Per Capita Healthcare Expenditure (at Current Price, in US$), by Country, 2010 - 2016
TABLE 75 Europe Neuromicroscopy Market Value (US$ Mn), By Country 2012-2017
TABLE 76 Europe Neuromicroscopy Market Value (US$ Mn), By Country 2018-2026
TABLE 77 Europe Neuromicroscopy Market Value (US$ Mn), By Product Type 2012-2017
TABLE 78 Europe Neuromicroscopy Market Value (US$ Mn), By Product Type 2018-2026
TABLE 79 Europe Neuromicroscopy Market Value (US$ Mn), By End User 2012-2017
TABLE 80 Europe Neuromicroscopy Market Value (US$ Mn), By End User 2018-2026
TABLE 81 Europe Neuromicroscopy Market Value (US$ Mn), By Modality 2012-2017
TABLE 82 Europe Neuromicroscopy Market Value (US$ Mn), By Modality 2018-2026
TABLE 83 Japan Current Expenditure on Health, (% of GDP), by Country, 2010 – 2016
TABLE 84 Japan Per Capita Health Expenditure (US$ PPP), by Country, 2010 - 2016
TABLE 85 Japan Per Capita Healthcare Expenditure Y-o-Y Growth (in Real terms %), by Country, 2010 - 2016
TABLE 86 Japan Out-of-Pocket Healthcare Expenditure, % of Healthcare Expenditure, by Country, 2010 - 2016
TABLE 87 Japan Per Capita Healthcare Expenditure (at Current Price, in US$), by Country, 2010 - 2016
TABLE 88 Japan Neuromicroscopy Market Value (US$ Mn), By Country 2012-2017
TABLE 89 Japan Neuromicroscopy Market Value (US$ Mn), By Country 2018-2026
TABLE 90 Japan Neuromicroscopy Market Value (US$ Mn), By Product Type 2012-2017
TABLE 91 Japan Neuromicroscopy Market Value (US$ Mn), By Product Type 2018-2026
TABLE 92 Japan Neuromicroscopy Market Value (US$ Mn), By End User 2012-2017
TABLE 93 Japan Neuromicroscopy Market Value (US$ Mn), By End User 2018-2026
TABLE 94 Japan Neuromicroscopy Market Value (US$ Mn), By Modality 2012-2017
TABLE 95 Japan Neuromicroscopy Market Value (US$ Mn), By Modality 2018-2026
TABLE 96 APEJ Current Expenditure on Health, (% of GDP), by Country, 2010 – 2016
TABLE 97 APEJ Per Capita Health Expenditure (US$ PPP), by Country, 2010 - 2016
TABLE 98 APEJ Per Capita Healthcare Expenditure Y-o-Y Growth (in Real terms %), by Country, 2010 - 2016
TABLE 99 APEJ Out-of-Pocket Healthcare Expenditure, % of Healthcare Expenditure, by Country, 2010 - 2016
TABLE 100 APEJ Per Capita Healthcare Expenditure (at Current Price, in US$), by Country, 2010 - 2016
TABLE 101 APEJ Neuromicroscopy Market Value (US$ Mn), By Country 2012-2017
TABLE 102 APEJ Neuromicroscopy Market Value (US$ Mn), By Country 2018-2026
TABLE 103 APEJ Neuromicroscopy Market Value (US$ Mn), By Product Type 2012-2017
TABLE 104 APEJ Neuromicroscopy Market Value (US$ Mn), By Product Type 2018-2026
TABLE 105 APEJ Neuromicroscopy Market Value (US$ Mn), By End User 2012-2017
TABLE 106 APEJ Neuromicroscopy Market Value (US$ Mn), By End User 2018-2026
TABLE 107 APEJ Neuromicroscopy Market Value (US$ Mn), By Modality 2012-2017
TABLE 108 APEJ Neuromicroscopy Market Value (US$ Mn), By Modality 2018-2026
TABLE 109 MEA Current Expenditure on Health, (% of GDP), by Country, 2010 – 2016
TABLE 110 MEA Per Capita Health Expenditure (US$ PPP), by Country, 2010 - 2016
TABLE 111 MEA Per Capita Healthcare Expenditure Y-o-Y Growth (in Real terms %), by Country, 2010 - 2016
TABLE 112 MEA Out-of-Pocket Healthcare Expenditure, % of Healthcare Expenditure, by Country, 2010 - 2016
TABLE 113 MEA Per Capita Healthcare Expenditure (at Current Price, in US$), by Country, 2010 - 2016
TABLE 114 MEA Neuromicroscopy Market Value (US$ Mn), By Country 2012-2017
TABLE 115 MEA Neuromicroscopy Market Value (US$ Mn), By Country 2018-2026
TABLE 116 MEA Neuromicroscopy Market Value (US$ Mn), By Product Type 2012-2017
TABLE 117 MEA Neuromicroscopy Market Value (US$ Mn), By Product Type 2018-2026
TABLE 118 MEA Neuromicroscopy Market Value (US$ Mn), By End User 2012-2017
TABLE 119 MEA Neuromicroscopy Market Value (US$ Mn), By End User 2018-2026
TABLE 120 MEA Neuromicroscopy Market Value (US$ Mn), By Modality 2012-2017
TABLE 121 MEA Neuromicroscopy Market Value (US$ Mn), By Modality 2018-2026
List of Figures
FIG. 1 Global Neuromicroscopy Market Value (US$ Mn), 2012-2017
FIG. 2 Global Neuromicroscopy Market Value (US$ Mn) Forecast, 2018-2026
FIG. 3 Global Neuromicroscopy Market Value (US$ Mn) and Y-o-Y, 2017-2026
FIG. 4 Global Devices Segment Market Value (US$ Mn) By Region, 2012-2017
FIG. 5 Global Devices Segment Market Value (US$ Mn) By Region, 2018-2026
FIG. 6 Global Devices Segment Y-o-Y Growth Rate, By Region, 2017-2026
FIG. 7 Global Softwares Segment Market Value (US$ Mn) By Region, 2012-2017
FIG. 8 Global Softwares Segment Market Value (US$ Mn) By Region, 2018-2026
FIG. 9 Global Softwares Segment Y-o-Y Growth Rate, By Region, 2017-2026
FIG. 10 Global Services Segment Market Value (US$ Mn) By Region, 2012-2017
FIG. 11 Global Services Segment Market Value (US$ Mn) By Region, 2018-2026
FIG. 12 Global Services Segment Y-o-Y Growth Rate, By Region, 2017-2026
FIG. 13 Global Hospitals Segment Market Value (US$ Mn) By Region, 2012-2017
FIG. 14 Global Hospitals Segment Market Value (US$ Mn) By Region, 2018-2026
FIG. 15 Global Hospitals Segment Y-o-Y Growth Rate, By Region, 2017-2026
FIG. 16 Global Ambulatory Surgical Centers Segment Market Value (US$ Mn) By Region, 2012-2017
FIG. 17 Global Ambulatory Surgical Centers Segment Market Value (US$ Mn) By Region, 2018-2026
FIG. 18 Global Ambulatory Surgical Centers Segment Y-o-Y Growth Rate, By Region, 2017-2026
FIG. 19 Global Specialty Clinics Segment Market Value (US$ Mn) By Region, 2012-2017
FIG. 20 Global Specialty Clinics Segment Market Value (US$ Mn) By Region, 2018-2026
FIG. 21 Global Specialty Clinics Segment Y-o-Y Growth Rate, By Region, 2017-2026
FIG. 22 Global Standalone Devices Segment Market Value (US$ Mn) By Region, 2012-2017
FIG. 23 Global Standalone Devices Segment Market Value (US$ Mn) By Region, 2018-2026
FIG. 24 Global Standalone Devices Segment Y-o-Y Growth Rate, By Region, 2017-2026
FIG. 25 Global Portable Devices Segment Market Value (US$ Mn) By Region, 2012-2017
FIG. 26 Global Portable Devices Segment Market Value (US$ Mn) By Region, 2018-2026
FIG. 27 Global Portable Devices Segment Y-o-Y Growth Rate, By Region, 2017-2026
FIG. 28 North America Neuromicroscopy Market Value (US$ Mn), By Country 2012-2017
FIG. 29 North America Neuromicroscopy Market Value (US$ Mn), By Country 2018-2026
FIG. 30 North America Neuromicroscopy Market Value (US$ Mn), By Product Type 2012-2017
FIG. 31 North America Neuromicroscopy Market Value (US$ Mn), By Product Type 2018-2026
FIG. 32 North America Neuromicroscopy Market Value (US$ Mn), By End User 2012-2017
FIG. 33 North America Neuromicroscopy Market Value (US$ Mn), By End User 2018-2026
FIG. 34 North America Neuromicroscopy Market Value (US$ Mn), By Modality 2012-2017
FIG. 35 North America Neuromicroscopy Market Value (US$ Mn), By Modality 2018-2026
FIG. 36 Latin America Neuromicroscopy Market Value (US$ Mn), By Country 2012-2017
FIG. 37 Latin America Neuromicroscopy Market Value (US$ Mn), By Country 2018-2026
FIG. 38 Latin America Neuromicroscopy Market Value (US$ Mn), By Product Type 2012-2017
FIG. 39 Latin America Neuromicroscopy Market Value (US$ Mn), By Product Type 2018-2026
FIG. 40 Latin America Neuromicroscopy Market Value (US$ Mn), By End User 2012-2017
FIG. 41 Latin America Neuromicroscopy Market Value (US$ Mn), By End User 2018-2026
FIG. 42 Latin America Neuromicroscopy Market Value (US$ Mn), By Modality 2012-2017
FIG. 43 Latin America Neuromicroscopy Market Value (US$ Mn), By Modality 2018-2026
FIG. 44 Europe Neuromicroscopy Market Value (US$ Mn), By Country 2012-2017
FIG. 45 Europe Neuromicroscopy Market Value (US$ Mn), By Country 2018-2026
FIG. 46 Europe Neuromicroscopy Market Value (US$ Mn), By Product Type 2012-2017
FIG. 47 Europe Neuromicroscopy Market Value (US$ Mn), By Product Type 2018-2026
FIG. 48 Europe Neuromicroscopy Market Value (US$ Mn), By End User 2012-2017
FIG. 49 Europe Neuromicroscopy Market Value (US$ Mn), By End User 2018-2026
FIG. 50 Europe Neuromicroscopy Market Value (US$ Mn), By Modality 2012-2017
FIG. 51 Europe Neuromicroscopy Market Value (US$ Mn), By Modality 2018-2026
FIG. 52 Japan Neuromicroscopy Market Value (US$ Mn), By Country 2012-2017
FIG. 53 Japan Neuromicroscopy Market Value (US$ Mn), By Country 2018-2026
FIG. 54 Japan Neuromicroscopy Market Value (US$ Mn), By Product Type 2012-2017
FIG. 55 Japan Neuromicroscopy Market Value (US$ Mn), By Product Type 2018-2026
FIG. 56 Japan Neuromicroscopy Market Value (US$ Mn), By Modality 2012-2017
FIG. 57 Japan Neuromicroscopy Market Value (US$ Mn), By End User 2018-2026
FIG. 58 Japan Neuromicroscopy Market Value (US$ Mn), By Modality 2012-2017
FIG. 59 Japan Neuromicroscopy Market Value (US$ Mn), By Modality 2018-2026
FIG. 60 APEJ Neuromicroscopy Market Value (US$ Mn), By Country 2012-2017
FIG. 61 APEJ Neuromicroscopy Market Value (US$ Mn), By Country 2018-2026
FIG. 62 APEJ Neuromicroscopy Market Value (US$ Mn), By Product Type 2012-2017
FIG. 63 APEJ Neuromicroscopy Market Value (US$ Mn), By Product Type 2018-2026
FIG. 64 APEJ Neuromicroscopy Market Value (US$ Mn), By End User 2012-2017
FIG. 65 APEJ Neuromicroscopy Market Value (US$ Mn), By End User 2018-2026
FIG. 66 APEJ Neuromicroscopy Market Value (US$ Mn), By Modality 2012-2017
FIG. 67 APEJ Neuromicroscopy Market Value (US$ Mn), By Modality 2018-2026
FIG. 68 MEA Neuromicroscopy Market Value (US$ Mn), By Country 2012-2017
FIG. 69 MEA Neuromicroscopy Market Value (US$ Mn), By Country 2018-2026
FIG. 70 MEA Neuromicroscopy Market Value (US$ Mn), By Product Type 2012-2017
FIG. 71 MEA Neuromicroscopy Market Value (US$ Mn), By Product Type 2018-2026
FIG. 72 MEA Neuromicroscopy Market Value (US$ Mn), By End User 2012-2017
FIG. 73 MEA Neuromicroscopy Market Value (US$ Mn), By End User 2018-2026
FIG. 74 MEA Neuromicroscopy Market Value (US$ Mn), By Modality 2012-2017
FIG. 75 MEA Neuromicroscopy Market Value (US$ Mn), By Modality 2018-2026
Copyright © Transparency Market Research, Inc. All Rights reserved
Trust Online

Neuromicroscopy Market