Reports
Reports
The nano-biotechnology market is witnessing a sizable growth, driven by the heightened demand for sophisticated healthcare solutions, integration of technological innovation, and broadening applications of nanotechnology across sectors. Higher incidences of chronic diseases is one of the major drivers, which has also driven demand for efficient diagnostics and focused therapies. Nanotechnology could improve efficiency for drug delivery systems by delivering drugs directly to diseased cells, resulting in reduced side effect incidence, and subsequently improving the care of patients.

In addition, advancements in imaging and diagnostic equipment is propelling market expansion. Nanoparticles are being used on an extensive note in imaging tools, which are offering higher resolution and sensitivity and are the focal point of disease diagnosis at an early stage. This has generated an increased demand for nanotechnology-based diagnostic equipment, especially in infectious diseases and oncology treatment. Support extended by the regulatory bodies and promotional policies are also driving the development of the industry since the governments are encouraging the use as well as commercialization of nanotechnology.
The emerging trend of sustainable and biodegradable nanomaterials in medicine is on the rise as the industry is looking toward minimization of ecological issues and maximization of patient safety and therapeutic efficacy. Biodegradable nanomaterials that are naturally derived, i.e., polysaccharides, lipids, and proteins are emerging for tissue engineering, drug delivery, and medical devices. These materials have some advantages in terms of enhanced biocompatibility and lowered toxicity.
Furthermore, the application of renewable nanomaterials for scaffold production in tissue engineering is transforming scaffold design for cell proliferation and regeneration and is also an ecofriendly approach. These scaffolds are exploitable for the purpose of mimicking native extracellular matrix and improving improved interaction with biological tissue.
Through research and development activities, nano-biotechnology companies are working toward development of innovative nanomaterials for diagnostics, drug delivery, and environmental use. Nano-biotechnology companies are collaborating as well as developing partnerships with research institutions in order to realize innovations in tailored therapies and personalized medicine.
Regulatory initiatives to improve regulatory practices and the safety assessment process for nanomaterials are being developed in parallel for ensuring that the new products generated from nanotechnology meet health and environmental standards while navigating innovation.
Nano-biotechnology is an interdisciplinary branch combining the foundations of nanotechnology and biotechnology in order to manage the nanoscale (usually between 1 and 100 nanometers) living systems. The new field utilizes the peculiarity of the materials at the nanoscale in developing new devices and methods for further biological research and applications.
In the area of medical imaging, nanotechnology advances the imaging aspects of more conventional imaging technologies such as MRI, PET and CT. Nanoparticles will most often be acting as contrast agents with quantum dots and superparamagnetic nanoparticles being examples. These nanoparticles will improve the quality and resolution of images generated with imaging techniques. Nanoparticles can also target certain tissue or cells that will provide informative physiological data and really enable early understandings of disease detection.
| Attribute | Detail |
|---|---|
| Nano-Biotechnology Market Drivers |
|
The rise of targeted therapies is a significant driver to the nano-biotechnology market as it depicts a growing shift in healthcare toward personalized and individualized treatment methods. The purpose of targeted therapies, as the name suggests, is to target a person's cancer cells/disease mechanisms, thereby leading to more efficient treatment with less side effects by preserving healthy tissue. This has altered historical methods of treatment such as chemotherapy/radiation that effectively kill or cause damage to both - the healthy and diseased cells.
Nanoparticles can specifically be designed to deliver genes, drugs, or imaging agents, which can increase the specificity of therapeutics and also enhance the delivery of therapeutics.
In addition, the multifunctionality of nanomaterials has the potential of co-delivering multiple therapeutics, thereby benefiting synergistic responses by addressing several mechanisms of resistance. For instance, nanoparticles can co-deliver chemotherapeutics that provide tumor resistance, thereby interfering with one of the most significant challenges presented in cancer treatment.
The best contribution of nano-biotechnology to diagnostics is the introduction of nanosensors. Nanosensors are able to track molecular markers, referred to as biomarkers, which indicate the presence of diseases found in exceedingly low amounts. Nano-sensors selectively target a biomarker, but ensure that the signals are measured using a variety of mechanisms to obtain better specificity and signal amplification. For example, gold nanoparticles can be used for assays to rapidly detect pathogens, or tumor markers, in blood samples. Gold nanoparticles possess a high surface area that allows for multiple binding sites, makes the assay more sensitive, and allows for rapid results which is crucial in the clinical setting.
In addition, the combination of nanotechnology with imaging modalities has changed the landscape of imaging for diagnostic purposes. Nanoscale contrast agents (e.g. quantum dots and superparamagnetic nanoparticles) improve the resolution of imaging outputs and the clarity of the imaging results. The agents can be developed to specifically target cells or tissue, and provide real-time depiction of pathological changes. This capability could prove advantageous for the early detection of tumors, thus providing an opportunity for timely intervention.
The push for non-invasive and point-of-service diagnostic solutions continues to advance the use of nano-biotechnology. There is a clear preference from both - patients and providers to use minimally invasive methods, with rapid and reliable outputs. The growth in the portable diagnostic devices utilizing nanotechnology portray a marked increase in portable diagnostics.

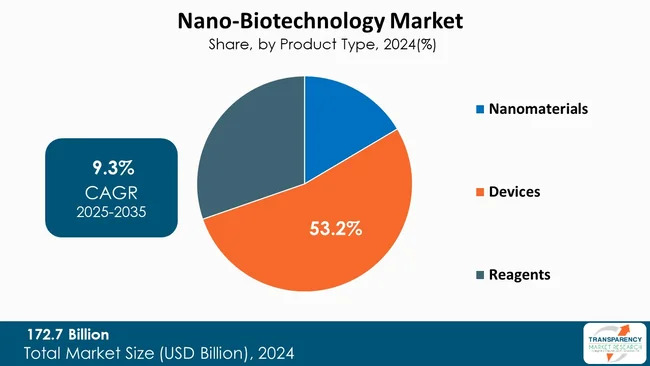
Devices segment continues to lead the global market for nano-biotechnology due to rapid development of nanosensors and miniaturized devices. Nanosensors and point-of-care devices are used for early and precise diagnosis of disease, which leads to faster adoption in health care and diagnostics.
In parallel, developments regarding nano-devices with new nanomaterials has also led to the creation of extremely sensitive devices available for research and medical diagnostics, thus enabling commercial and widespread use. Devices typically also have less complicated regulatory implications than nano-based drugs or biologics, thus providing quicker products and product acceptance to end-users.

| Attribute | Detail |
|---|---|
|
Leading Region |
North America |
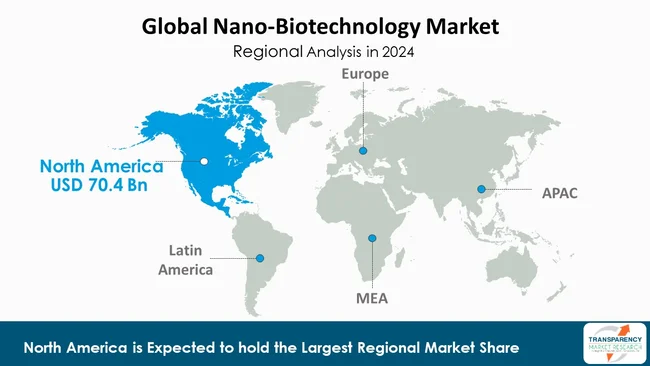
As per the latest nano-biotechnology market analysis, North America dominated in 2024. Advancements in healthcare infrastructure, high investments in research, and augmented healthcare finances are driving market dynamics in the region.
The U.S.’ market share in the North America nano-biotechnology market is attributed to the advancement in healthcare infrastructure, increase in awareness, and augmented health care finances. Also, numerous nano-biotechnology companies are based in the U.S.
Expansion of the nano-biotechnology market in Asia Pacific is primarily ascribed to the rapid expansion of healthcare facilities in countries such as Japan, India, and China, in the region. The market in Asia Pacific is driven by the ongoing privatization of the healthcare sector, in turn driving investment in medical technologies. Further, Asia Pacific countries are increasingly focusing on precision medicine, which involves the use of nanotechnology to develop targeted and personalized treatments.
As nano-biotechnology companies are constantly innovating to improve product capabilities, innovative devices are being introduced for better workflow efficiency.
Johnson & Johnson Services, Inc., Abbott, Novartis AG, Merck and Co. Inc., Bristol-Myers Squibb Company, Danaher Corporation, Thermo Fisher Scientific, Inc., Pfizer, Inc., Sanofi, Nanobiotix, Arcturus Therapeutics, Inc., Cello Therapeutics, Merck KGaA, Ascendia Pharmaceutical Solutions, and OZ Biosciences are some of the leading players operating in the global nano-biotechnology market.
Each of these players has been profiled in the nano-biotechnology market research report based on parameters such as company overview, financial overview, business strategies, product portfolio, business segments, and recent developments.
| Attribute | Detail |
|---|---|
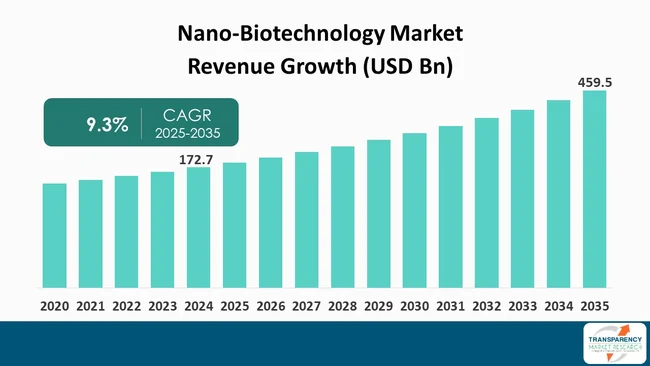
| Size in 2024 | US$ 172.7 Bn |
| Forecast Value in 2035 | US$ 459.5 Bn |
| CAGR | 9.3% |
| Forecast Period | 2025-2035 |
| Historical Data Available for | 2020-2023 |
| Quantitative Units | US$ Bn |
| Nano-biotechnology Market Analysis | It includes segment analysis as well as regional level analysis. Moreover, qualitative analysis includes drivers, restraints, opportunities, key trends, value chain analysis, and key trend analysis. |
| Competition Landscape |
|
| Format | Electronic (PDF) + Excel |
| Segmentation | Product Type
|
| Regions Covered |
|
| Countries Covered |
|
| Companies Profiled |
|
| Customization Scope | Available upon request |
| Pricing | Available upon request |
The global nano-biotechnology market was valued at US$ 172.7 Bn in 2024
The global nano-biotechnology industry is projected to reach more than US$ 459.5 Bn by the end of 2035
Rising demand for targeted therapies, advancements in diagnostic technologies and increasing prevalence of chronic disorders are some of the factors driving the expansion of nano-biotechnology market.
The CAGR is anticipated to be 9.3% from 2025 to 2035
Johnson & Johnson Services, Inc., Abbott, Novartis AG, Merck and Co. Inc., Bristol-Myers Squibb Company, Danaher Corporation, Thermo Fisher Scientific, Inc., Pfizer, Inc., Sanofi, Nanobiotix, Arcturus Therapeutics, Inc., Cello Therapeutics, Merck KGaA, Ascendia Pharmaceutical Solutions, and OZ Biosciences.
Table 01: Global Market Value (US$ Bn) Forecast, By Product Type, 2020 to 2035
Table 02: Global Market Value (US$ Bn) Forecast, By Application, 2020 to 2035
Table 03: Global Market Value (US$ Bn) Forecast, By End-user, 2020 to 2035
Table 04: Global Market Value (US$ Bn) Forecast, By Region, 2020 to 2035
Table 05: North America - Market Value (US$ Bn) Forecast, by Country, 2020 to 2035
Table 06: North America - Market Value (US$ Bn) Forecast, By Product Type, 2020 to 2035
Table 07: North America - Market Value (US$ Bn) Forecast, By Application, 2020 to 2035
Table 08: North America - Market Value (US$ Bn) Forecast, By End-user, 2020 to 2035
Table 09: Europe - Market Value (US$ Bn) Forecast, by Country / Sub-region, 2020 to 2035
Table 10: Europe - Market Value (US$ Bn) Forecast, By Product Type, 2020 to 2035
Table 11: Europe - Market Value (US$ Bn) Forecast, By Application, 2020 to 2035
Table 12: Europe - Market Value (US$ Bn) Forecast, By End-user, 2020 to 2035
Table 13: Asia Pacific - Market Value (US$ Bn) Forecast, by Country / Sub-region, 2020 to 2035
Table 14: Asia Pacific - Market Value (US$ Bn) Forecast, By Product Type, 2020 to 2035
Table 15: Asia Pacific - Market Value (US$ Bn) Forecast, By Application, 2020 to 2035
Table 16: Asia Pacific - Market Value (US$ Bn) Forecast, By End-user, 2020 to 2035
Table 17: Latin America - Market Value (US$ Bn) Forecast, by Country / Sub-region, 2020 to 2035
Table 18: Latin America - Market Value (US$ Bn) Forecast, By Product Type, 2020 to 2035
Table 19: Latin America - Market Value (US$ Bn) Forecast, By Application, 2020 to 2035
Table 21: Middle East & Africa - Market Value (US$ Bn) Forecast, by Country / Sub-region, 2020 to 2035
Table 22: Middle East & Africa - Market Value (US$ Bn) Forecast, By Product Type, 2020 to 2035
Table 23: Middle East & Africa - Market Value (US$ Bn) Forecast, By Application, 2020 to 2035
Table 24: Middle East & Africa - Market Value (US$ Bn) Forecast, By End-user, 2020 to 2035
Figure 01: Global Market Value Share Analysis, By Product Type, 2024 and 2035
Figure 02: Global Market Attractiveness Analysis, By Product Type, 2025 to 2035
Figure 03: Global Market Revenue (US$ Bn), by Nanomaterials, 2020 to 2035
Figure 04: Global Market Revenue (US$ Bn), by Devices, 2020 to 2035
Figure 05: Global Market Revenue (US$ Bn), by Reagents, 2020 to 2035
Figure 06: Global Market Value Share Analysis, By Application, 2024 and 2035
Figure 07: Global Market Attractiveness Analysis, By Application, 2025 to 2035
Figure 08: Global Market Revenue (US$ Bn), by Drug Delivery, 2020 to 2035
Figure 09: Global Market Revenue (US$ Bn), by Diagnostics, 2020 to 2035
Figure 10: Global Market Revenue (US$ Bn), by Imaging, 2020 to 2035
Figure 11: Global Market Revenue (US$ Bn), by Gene Delivery, 2020 to 2035
Figure 12: Global Market Revenue (US$ Bn), by Tissue Engineering, 2020 to 2035
Figure 13: Global Market Revenue (US$ Bn), by Others, 2020 to 2035
Figure 14: Global Market Value Share Analysis, By End-user, 2024 and 2035
Figure 15: Global Market Attractiveness Analysis, By End-user, 2025 to 2035
Figure 16: Global Market Revenue (US$ Bn), by Pharmaceutical and Biopharmaceutical Companies, 2020 to 2035
Figure 17: Global Market Revenue (US$ Bn), by Academic and Research Laboratories, 2020 to 2035
Figure 18: Global Market Revenue (US$ Bn), by Others, 2020 to 2035
Figure 19: Global Market Value Share Analysis, By Region, 2024 and 2035
Figure 20: Global Market Attractiveness Analysis, By Region, 2025 to 2035
Figure 21: North America - Market Value (US$ Bn) Forecast, 2020 to 2035
Figure 22: North America - Market Value Share Analysis, by Country, 2024 and 2035
Figure 23: North America - Market Attractiveness Analysis, by Country, 2025 to 2035
Figure 24: North America - Market Value Share Analysis, By Product Type, 2024 and 2035
Figure 25: North America - Market Attractiveness Analysis, By Product Type, 2025 to 2035
Figure 26: North America - Market Value Share Analysis, By Application, 2024 and 2035
Figure 27: North America - Market Attractiveness Analysis, By Application, 2025 to 2035
Figure 28: North America - Market Value Share Analysis, By End-user, 2024 and 2035
Figure 29: North America - Market Attractiveness Analysis, By End-user, 2025 to 2035
Figure 30: Europe - Market Value (US$ Bn) Forecast, 2020 to 2035
Figure 31: Europe - Market Value Share Analysis, by Country / Sub-region, 2024 and 2035
Figure 32: Europe - Market Attractiveness Analysis, by Country / Sub-region, 2025 to 2035
Figure 33: Europe - Market Value Share Analysis, By Product Type, 2024 and 2035
Figure 34: Europe - Market Attractiveness Analysis, By Product Type, 2025 to 2035
Figure 35: Europe - Market Value Share Analysis, By Application, 2024 and 2035
Figure 36: Europe - Market Attractiveness Analysis, By Application, 2025 to 2035
Figure 37: Europe - Market Value Share Analysis, By End-user, 2024 and 2035
Figure 38: Europe - Market Attractiveness Analysis, By End-user, 2025 to 2035
Figure 39: Asia Pacific - Market Value (US$ Bn) Forecast, 2020 to 2035
Figure 40: Asia Pacific - Market Value Share Analysis, by Country/Sub-region, 2024 and 2035
Figure 41: Asia Pacific - Market Attractiveness Analysis, by Country/Sub-region, 2025 to 2035
Figure 42: Asia Pacific - Market Value Share Analysis, By Product Type, 2024 and 2035
Figure 43: Asia Pacific - Market Attractiveness Analysis, By Product Type, 2025 to 2035
Figure 44: Asia Pacific - Market Value Share Analysis, By Application, 2024 and 2035
Figure 45: Asia Pacific - Market Attractiveness Analysis, By Application, 2025 to 2035
Figure 46: Asia Pacific - Market Value Share Analysis, By End-user, 2024 and 2035
Figure 47: Asia Pacific - Market Attractiveness Analysis, By End-user, 2025 to 2035
Figure 48: Latin America - Market Value (US$ Bn) Forecast, 2020 to 2035
Figure 49: Latin America - Market Value Share Analysis, by Country / Sub-region, 2024 and 2035
Figure 50: Latin America - Market Attractiveness Analysis, by Country / Sub-region, 2025 to 2035
Figure 51: Latin America - Market Value Share Analysis, By Product Type, 2024 and 2035
Figure 52: Latin America - Market Attractiveness Analysis, By Product Type, 2025 to 2035
Figure 53: Latin America - Market Value Share Analysis, By Application, 2024 and 2035
Figure 54: Latin America - Market Attractiveness Analysis, By Application, 2025 to 2035
Figure 55: Latin America - Market Value Share Analysis, By End-user, 2024 and 2035
Figure 56: Latin America - Market Attractiveness Analysis, By End-user, 2025 to 2035
Figure 57: Middle East & Africa - Market Value (US$ Bn) Forecast, 2020 to 2035
Figure 58: Middle East & Africa - Market Value Share Analysis, by Country / Sub-region, 2024 and 2035
Figure 59: Middle East & Africa - Market Attractiveness Analysis, by Country / Sub-region, 2025 to 2035
Figure 60: Middle East & Africa - Market Value Share Analysis, By Product Type, 2024 and 2035
Figure 61: Middle East & Africa - Market Attractiveness Analysis, By Product Type, 2025 to 2035
Figure 62: Middle East & Africa - Market Value Share Analysis, By Application, 2024 and 2035
Figure 63: Middle East & Africa - Market Attractiveness Analysis, By Application, 2025 to 2035
Figure 64: Middle East & Africa - Market Value Share Analysis, By End-user, 2024 and 2035
Figure 65: Middle East & Africa - Market Attractiveness Analysis, By End-user, 2025 to 2035