
Reports
Reports
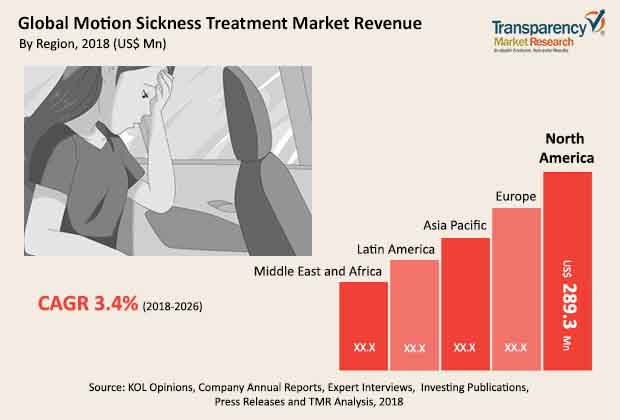
According to the business intelligence survey by the Transparency Market Research, the global motion sickness treatment market is expected to rise at a significant growth rate of 3 % over the forecast years i.e. 2018 to 2026. The professional survey report also predicts that the global motion sickness treatment market will develop from its initial evaluation of US$ 670 million in 2017 and hit the mark of US$ 900 million by the end of the forecast period i.e. in 2026. The increasing adoption of prescription drugs intended for motion sickness in developed economies is expected to emerge as the major driving force, shaping the demand dynamics within the global motion sickness treatment market in coming years. Furthermore, increasing adoption of these drugs owing to the rising number of travelers in developing economies is also expected to bode well for advancement in the global motion sickness treatment market in near future.
The types of treatment offered by the vendors and players operating within the global motion sickness treatment market include antihistamines, sympathomimetic, wearable relief bands, anticholinergic, and traditional medicines, among others. Amongst these, the anticholinergic drugs are expected to lead the global motion sickness treatment market in coming years, followed by the segment of antihistamines. The segments in the global motion sickness treatment market based on the route of administration are transdermal and oral, among others. Among these, the transdermal drugs are anticipated to lead the global motion sickness treatment market in terms of market share, followed closely by the segment of oral drugs.
The segments in the global motion sickness treatment market classified by the distribution channel include online pharmacies, drug stores, hospital pharmacies, and retail pharmacies, among others. The retail pharmacies led the global motion sickness treatment market in 2017 and the same segment is likely to retain its dominant position in the global motion sickness treatment market in coming years. Furthermore, rising reliance on over the counter medications as well as the effectiveness of traditional medicines is also expected to fuel the demand within the global motion sickness treatment market in coming years.
Major regions and leading economies assessed thoroughly in the business intelligence study on the global motion sickness treatment market include Europe (including Germany, Italy, the United Kingdom, France, Spain, and rest of the Europe), Latin America (including Brazil, Mexico, and rest of the Latin America), North America (including the United States and Canada), Asia Pacific (including Japan, Australia and New Zealand, China, India, and rest of the Asia Pacific), and Middle East and Africa (including the Gulf Cooperation Council countries, South Africa, and rest of the Middle East and Africa).
Regionally, North America dominated the global motion sickness treatment market in recent past owing to the rising adoption of expensive motion sickness treatment prescription drugs in regional economies such as the United States. Furthermore, Asia Pacific region is expected to witness substantial increase in the demand in global motion sickness treatment market in near future, owing to rising number of travelers. Moreover, another key driver for the expansion of the global motion sickness treatment market in Asia Pacific is likely to be the increase in the initiatives by multinational pharmaceutical corporations to participate in the regional market in Asia Pacific.
Some of the major incumbent players and providers assessed in the research report on the global motion sickness treatment market include Perrigo Company, PLC, WellSpring Pharmaceutical Corporation, Myungmoon Pharm Co., Ltd., Reliefband Technologies LLC, GlaxoSmithKline PLC, Prestige Brands, Inc., Caleb Pharmaceuticals, Inc., and Baxter International, Inc., among others. Players in the global motion sickness treatment market are focused on increasing their consumer base, regional presence, and product offerings to remain competitive in the industry.
Motion sickness treatment market to touch valuation of US$ 900.0 Mn by the end of 2026
Motion sickness treatment market is projected to clock a CAGR of more than 3.0% during 2018 - 2026
Motion sickness treatment market is driven by increasing adoption of prescription drugs intended for motion sickness in developed economies
North America dominated the global motion sickness treatment market, owing to the rising adoption of expensive motion sickness treatment prescription drugs in regional economies
Key players in the global motion sickness treatment market include Perrigo Company, PLC, WellSpring Pharmaceutical Corporation, Myungmoon Pharm Co., Ltd., Reliefband Technologies LLC
1. Preface
1.1. Market Definition and Scope
1.2. Market Segmentation
1.3. Key Research Objectives
1.4. Research Highlights
2. Assumptions and Research Methodology
3. Executive Summary: Global Motion Sickness Treatment Market
4. Market Overview
4.1. Overview
4.2. Market Dynamics
4.2.1. Drivers
4.2.1. Restraints
4.3. Global Motion Sickness Treatment Market Analysis and Forecast, 2016–2026
4.3.1. Market Revenue Projections (US$ Mn)
4.4. Porter’s Five Force Analysis
5. Market Outlook
5.1.Pipeline Analysis
5.2.Key Mergers & Acquisitions
5.3.OTC & Prescription Market Analysis
6. Global Motion Sickness Treatment Market Analysis and Forecasts, by Treatment Type
6.1. Introduction & Definition
6.2. Key Findings / Developments
6.3. Market Value Forecast, by Treatment Type, 2016–2026
6.3.1. Anticholinergic
6.3.2. Antihistamines
6.3.3. Others
6.4. Market Attractiveness, by Treatment Type
7. Global Motion Sickness Treatment Market Analysis and Forecasts, by Route of Administration
7.1. Introduction & Definition
7.2. Key Findings / Developments
7.3. Market Value Forecast, by Route of Administration, 2016–2026
7.3.1. Oral
7.3.2. Transdermal
7.3.3. Others
7.4. Market Attractiveness, by Route of Administration
8. Global Motion Sickness Treatment Market Analysis and Forecasts, by Distribution Channel
8.1. Introduction & Definition
8.2. Key Findings / Developments
8.3. Market Value Forecast, by Distribution Channel, 2016–2026
8.3.1. Retail Pharmacies
8.3.2. Online Pharmacies
8.3.3. Others
8.4. Market Attractiveness, by Distribution Channel
9. Global Motion Sickness Treatment Market Analysis and Forecasts, by Region
9.1. Key Findings
9.2. Market Value Forecast, by Region
9.2.1. North America
9.2.2. Europe
9.2.3. Asia Pacific
9.2.4. Latin America
9.2.5. Middle East & Africa
9.3. Market Attractiveness, by Region
10. North America Motion Sickness Treatment Market Analysis and Forecast
10.1. Introduction
10.1.1. Key Findings
10.2. Market Value Forecast, by Treatment Type, 2016–2026
10.2.1. Anticholinergic
10.2.2. Antihistamines
10.2.3. Others
10.3. Market Value Forecast, by Route of Administration, 2016–2026
10.3.1. Oral
10.3.2. Transdermal
10.3.3. Others
10.4. Market Value Forecast, by Distribution Channel, 2016–2026
10.4.1. Retail Pharmacies
10.4.2. Online Pharmacies
10.4.3. Others
10.5. Market Value Forecast, by Country, 2016–2026
10.5.1. U.S.
10.5.2. Canada
10.6. Market Attractiveness Analysis
10.6.1. By Treatment Type
10.6.2. By Route of Administration
10.6.3. By Distribution Channel
10.6.4. By Country
11. Europe Motion Sickness Treatment Market Analysis and Forecast
11.1.Introduction
11.1.1. Key Findings
11.2.Market Value Forecast, by Treatment Type, 2016–2026
11.2.1. Anticholinergic
11.2.2. Antihistamines
11.2.3. Others
11.3.Market Value Forecast, by Route of Administration, 2016–2026
11.3.1. Oral
11.3.2. Transdermal
11.3.3. Others
11.4.Market Value Forecast, by Distribution Channel, 2016–2026
11.4.1. Retail Pharmacies
11.4.2. Online Pharmacies
11.4.3. Others
11.5.Market Value Forecast, by Country / Sub-region, 2016–2026
11.5.1. Germany
11.5.2. France
11.5.3. U.K.
11.5.4. Italy
11.5.5. Spain
11.5.6. Rest of Europe
11.6.Market Attractiveness Analysis
11.6.1. By Treatment Type
11.6.2. By Route of Administration
11.6.3. By Distribution Channel
11.6.4. By Country / Sub-region
12. Asia Pacific Motion Sickness Treatment Market Analysis and Forecast
12.1.Introduction
12.1.1. Key Findings
12.2.Market Value Forecast, by Treatment Type, 2016–2026
12.2.1. Anticholinergic
12.2.2. Antihistamines
12.2.3. Others
12.3.Market Value Forecast, by Route of Administration, 2016–2026
12.3.1. Oral
12.3.2. Transdermal
12.3.3. Others
12.4.Market Value Forecast, by Distribution Channel, 2016–2026
12.4.1. Retail Pharmacies
12.4.2. Online Pharmacies
12.4.3. Others
12.5.Market Value Forecast, by Country / Sub-region, 2016–2026
12.5.1. China
12.5.2. Japan
12.5.3. India
12.5.4. Australia & New Zealand
12.5.5. Rest of Asia Pacific
12.6.Market Attractiveness Analysis
12.6.1. By Treatment Type
12.6.2. By Route of Administration
12.6.3. By Distribution Channel
12.6.4. By Country / Sub-region
13. Latin America Motion Sickness Treatment Market Analysis and Forecast
13.1.Introduction
13.1.1. Key Findings
13.2.Market Value Forecast, by Treatment Type, 2016–2026
13.2.1. Anticholinergic
13.2.2. Antihistamines
13.2.3. Others
13.3.Market Value Forecast, by Route of Administration, 2016–2026
13.3.1. Oral
13.3.2. Transdermal
13.3.3. Others
13.4.Market Value Forecast, by Distribution Channel, 2016–2026
13.4.1. Retail Pharmacies
13.4.2. Online Pharmacies
13.4.3. Others
13.5.Market Value Forecast, by Country, 2016–2026
13.5.1. Brazil
13.5.2. Mexico
13.5.3. Rest of Latin America
13.6.Market Attractiveness Analysis
13.6.1. By Treatment Type
13.6.2. By Route of Administration
13.6.3. By Distribution Channel
13.6.4. By Country / Sub-region
14. Middle East & Africa Motion Sickness Treatment Market Analysis and Forecast
14.1.Introduction
14.1.1. Key Findings
14.2.Market Value Forecast, by Treatment Type, 2016–2026
14.2.1. Anticholinergic
14.2.2. Antihistamines
14.2.3. Others
14.3.Market Value Forecast, by Route of Administration, 2016–2026
14.3.1. Oral
14.3.2. Transdermal
14.3.3. Others
14.4.Market Value Forecast, by Distribution Channel, 2016–2026
14.4.1. Retail Pharmacies
14.4.2. Online Pharmacies
14.4.3. Others
14.5.Market Value Forecast, by Country / Sub-region, 2016–2026
14.5.1. GCC Countries
14.5.2. South Africa
14.5.3. Rest of Middle East & Africa
14.6.Market Attractiveness Analysis
14.6.1. By Treatment Type
14.6.2. By Route of Administration
14.6.3. By Distribution Channel
14.6.4. By Country / Sub-region
15. Competition Landscape
15.1.Market Player – Competition Matrix (By Tier and Size of companies)
15.2.Market Footprint Analysis
15.2.1. By Region
15.2.2. By Treatment Type
15.3. Competitive Business Strategies
15.4. Company Profiles
15.4.1. GlaxoSmithKline plc
15.4.1.1. Company Overview (HQ, Business Segments, Employee Strength)
15.4.1.2.Product Portfolio
15.4.1.3.Financial Overview
15.4.1.4.SWOT Analysis
15.4.1.5.Strategic Overview
15.4.2. Perrigo Company plc
15.4.2.1. Company Overview (HQ, Business Segments, Employee Strength)
15.4.2.2.Product Portfolio
15.4.2.3.Financial Overview
15.4.2.4.SWOT Analysis
15.4.2.5.Strategic Overview
15.4.3. Prestige Brands, Inc.
15.4.3.1. Company Overview (HQ, Business Segments, Employee Strength)
15.4.3.2.Product Portfolio
15.4.3.3.Financial Overview
15.4.3.4.SWOT Analysis
15.4.3.5.Strategic Overview
15.4.4. Wellspring Pharmaceutical Corporation
15.4.4.1. Company Overview (HQ, Business Segments, Employee Strength)
15.4.4.2.Product Portfolio
15.4.4.3.SWOT Analysis
15.4.4.4.Strategic Overview
15.4.5. Caleb Pharmaceuticals, Inc.
15.4.5.1. Company Overview (HQ, Business Segments, Employee Strength)
15.4.5.2.Product Portfolio
15.4.5.3.SWOT Analysis
15.4.5.4.Strategic Overview
15.4.6. Myungmoon Pharm CO., LTD.
15.4.6.1. Company Overview (HQ, Business Segments, Employee Strength)
15.4.6.2.Product Portfolio
15.4.6.3.Financial Overview
15.4.6.4.SWOT Analysis
15.4.6.5.Strategic Overview
15.4.7. Baxter International Inc.
15.4.7.1. Company Overview (HQ, Business Segments, Employee Strength)
15.4.7.2.Product Portfolio
15.4.7.3.Financial Overview
15.4.7.4.SWOT Analysis
15.4.7.5.Strategic Overview
15.4.8. Reliefband Technologies LLC
15.4.8.1. Company Overview (HQ, Business Segments, Employee Strength)
15.4.8.2.Product Portfolio
15.4.8.3.Financial Overview
15.4.8.4.SWOT Analysis
15.4.8.5.Strategic Overview
List of Tables
Table 01: Pipeline Analysis (1/2)
Table 02: Pipeline Analysis (2/2)
Table 03: Key Mergers and Acquisitions Snapshot (1/2)
Table 04: Key Mergers and Acquisitions Snapshot (2/2)
Table 05: Global Motion Sickness Treatment Market Size (US$ Mn) Forecast, by Treatment Type, 2016–2026
Table 06: Global Motion Sickness Treatment Market Size (US$ Mn) Forecast, by Route of Administration, 2016–2026
Table 07: Global Motion Sickness Treatment Market Size (US$ Mn) Forecast, by Distribution Channel, 2016–2026
Table 08: Global Motion Sickness Treatment Market Size (US$ Mn) Forecast, by Region, 2016–2026
Table 09: North America Motion Sickness Treatment Market Size (US$ Mn) Forecast, by Treatment Type, 2016–2026
Table 10: North America Motion Sickness Treatment Market Size (US$ Mn) Forecast, by Route of Administration, 2016–2026
Table 11: North America Motion Sickness Treatment Market Size (US$ Mn) Forecast, by Distribution Channel, 2016–2026
Table 12: North America Motion Sickness Treatment Market Size (US$ Mn) Forecast, by Country, 2016–2026
Table 13: Europe Motion Sickness Treatment Market Size (US$ Mn) Forecast, by Treatment Type, 2016–2026
Table 14: Europe Motion Sickness Treatment Market Size (US$ Mn) Forecast, by Route of Administration, 2016–2026
Table 15: Europe Motion Sickness Treatment Market Size (US$ Mn) Forecast, by Distribution Channel, 2016–2026
Table 16: Europe Motion Sickness Treatment Market Size (US$ Mn) Forecast, by Country/Sub-region, 2016–2026
Table 17: Asia Pacific Motion Sickness Treatment Market Size (US$ Mn) Forecast, by Treatment Type, 2016–2026
Table 18: Asia Pacific Motion Sickness Treatment Market Size (US$ Mn) Forecast, by Route of Administration, 2016–2026
Table 19: Asia Pacific Motion Sickness Treatment Market Size (US$ Mn) Forecast, by Distribution Channel, 2016–2026
Table 20: Asia Pacific Motion Sickness Treatment Market Size (US$ Mn) Forecast, by Country/Sub-region, 2016–2026
Table 21: Latin America Motion Sickness Treatment Market Size (US$ Mn) Forecast, by Treatment Type, 2016–2026
Table 22: Latin America Motion Sickness Treatment Market Size (US$ Mn) Forecast, by Route of Administration, 2016–2026
Table 23: Latin America Motion Sickness Treatment Market Size (US$ Mn) Forecast, by Distribution Channel, 2016–2026
Table 24: Latin America Motion Sickness Treatment Market Size (US$ Mn) Forecast, by Country / Sub-region, 2016–2026
Table 25: Middle East & Africa Motion Sickness Treatment Market Size (US$ Mn) Forecast, by Treatment Type, 2016–2026
Table 26: Middle East & Africa Motion Sickness Treatment Market Size (US$ Mn) Forecast, by Route of Administration, 2016–2026
Table 27: Middle East & Africa Motion Sickness Treatment Market Size (US$ Mn) Forecast, by Distribution Channel, 2016–2026
Table 28: Middle East & Africa Motion Sickness Treatment Market Size (US$ Mn) Forecast, by Country/Sub-region, 2016–2026
Table 29: Key Players Market Footprint Analysis, by Treatment Type
Table 30: Key Players Market Footprint Analysis, by Region
List of Figures
Figure 01: Global Motion Sickness Treatment Market Size (US$ Mn) and Distribution, by Region, 2017 and 2026
Figure 02: Global Motion Sickness Treatment
Figure 03: Top 3 Trends
Figure 04: Global Motion Sickness Treatment Market Value Share, by Region (2017)
Figure 05: Global Motion Sickness Treatment Market Size (US$ Mn) Forecast and Y-o-Y Growth (%) Projection, 2016–2026
Figure 06: Global Market Value Share, by Treatment Type (2017)
Figure 07: Global Market Value Share, by Route of Administration (2017)
Figure 08: Global Market Value Share, by Distribution Channel (2017)
Figure 09: Global Market Value Share, by Region (2017)
Figure 10: OTC and Prescription Drugs Comparison Snapshot (2017)
Figure 11: Global Motion Sickness Treatment Market Value Share, by Treatment Type, 2017 and 2026
Figure 12: Global Motion Sickness Treatment Market Attractiveness Analysis, by Treatment Type, 2018–2026
Figure 13: Global Motion Sickness Treatment Market Revenue (US$ Mn) and Y-o-Y Growth (%), by Anticholinergic, 2016–2026
Figure 14: Global Motion Sickness Treatment Market Revenue (US$ Mn) and Y-o-Y Growth (%), by Antihistamines, 2016–2026
Figure 15: Global Motion Sickness Treatment Market Revenue (US$ Mn) and Y-o-Y Growth (%), by Others, 2016–2026
Figure 16: Global Motion Sickness Treatment Market Value Share, by Route of Administration, 2017 and 2026
Figure 17: Global Motion Sickness Treatment Market Attractiveness Analysis, by Route of Administration, 2018-2026
Figure 18: Global Motion Sickness Treatment Market Revenue (US$ Mn) and Y-o-Y Growth (%), by Oral Drugs, 2016–2026
Figure 19: Global Motion Sickness Treatment Market Revenue (US$ Mn) and Y-o-Y Growth (%), by Transdermal Drugs, 2016–2026
Figure 20: Global Motion Sickness Treatment Market Revenue (US$ Mn) and Y-o-Y Growth (%), by Others, 2016–2026
Figure 21: Global Motion Sickness Treatment Market Value Share, by Distribution Channel, 2017 and 2026
Figure 22: Global Motion Sickness Treatment Market Attractiveness, by Distribution Channel, 2018–2026
Figure 23: Global Motion Sickness Treatment Market Revenue (US$ Mn) and Y-o-Y Growth (%), by Retail Pharmacies, 2016–2026
Figure 24: Global Motion Sickness Treatment Market Revenue (US$ Mn) and Y-o-Y Growth (%), by Online Pharmacies, 2016–2026
Figure 25: Global Motion Sickness Treatment Market Revenue (US$ Mn) and Y-o-Y Growth (%), by Others, 2016–2026
Figure 26: Global Motion Sickness Treatment Market Value Share, by Region, 2017 and 2026
Figure 27: Global Motion Sickness Treatment Market Attractiveness Analysis, by Region, 2018–2026
Figure 28: Market Snapshot, by Country
Figure 29: North America Motion Sickness Treatment Market Size (US$ Mn) Forecast and Y-o-Y Growth (%) Projection, 2016–2026
Figure 30: North America Motion Sickness Treatment Market Value Share Analysis, by Treatment Type, 2017 and 2026
Figure 31: North America Motion Sickness Treatment Market Attractiveness Analysis, by Treatment Type, 2018– 2026
Figure 32: North America Motion Sickness Treatment Market Value Share Analysis, by Route of Administration, 2017 and 2026
Figure 33: North America Motion Sickness Treatment Market Attractiveness Analysis, by Route of Administration, 2018–2026
Figure 34: North America Motion Sickness Treatment Market Value Share Analysis, by Distribution Channel, 2017 and 2026
Figure 35: North America Motion Sickness Treatment Market Attractiveness Analysis, by Distribution Channel, 2018–2026
Figure 36: North America Motion Sickness Treatment Market Value Share Analysis, by Country, 2017 and 2026
Figure 37: North America Motion Sickness Treatment Market Attractiveness Analysis, by Country, 2018–2026
Figure 38: Europe Motion Sickness Treatment Market Size (US$ Mn) Forecast and Y-o-Y Growth (%) Projection, 2016–2026
Figure 39: Europe Motion Sickness Treatment Market Value Share Analysis, by Treatment Type, 2017 and 2026
Figure 40: Europe Motion Sickness Treatment Market Attractiveness Analysis, by Treatment Type, 2018–2026
Figure 41: Europe Motion Sickness Treatment Market Value Share Analysis, by Route of Administration, 2017 and 2026
Figure 42: Europe Motion Sickness Treatment Market Attractiveness Analysis, by Route of Administration, 2018–2026
Figure 43: Europe Motion Sickness Treatment Market Value Share Analysis, by Distribution Channel, 2017 and 2026
Figure 44: Europe Motion Sickness Treatment Market Attractiveness Analysis, by Distribution Channel, 2018–2026
Figure 45: Europe Motion Sickness Treatment Market Value Share Analysis, by Country/Sub-region, 2017 and 2026
Figure 46: Europe Motion Sickness Treatment Market Attractiveness Analysis, by Country/Sub-region, 2018–2026
Figure 47: Asia Pacific Motion Sickness Treatment Market Size (US$ Mn) Forecast and Y-o-Y Growth (%) Projection, 2016–2026
Figure 48: Asia Pacific Motion Sickness Treatment Market Value Share Analysis, by Treatment Type, 2017 and 2026
Figure 49: Asia Pacific Motion Sickness Treatment Market Attractiveness Analysis, by Treatment Type, 2018–2026
Figure 50: Asia Pacific Motion Sickness Treatment Market Value Share Analysis, by Route of Administration, 2017 and 2026
Figure 51: Asia Pacific Motion Sickness Treatment Market Attractiveness Analysis, by Route of Administration, 2018–2026
Figure 52: Asia Pacific Motion Sickness Treatment Market Value Share Analysis, by Distribution Channel, 2017 and 2026
Figure 53: Asia Pacific Motion Sickness Treatment Market Attractiveness Analysis, by Distribution Channel, 2018–2026
Figure 54: Asia Pacific Motion Sickness Treatment Market Value Share Analysis, by Country/Sub-region, 2017 and 2026
Figure 55: Asia Pacific Motion Sickness Treatment Market Attractiveness Analysis, by Country/Sub-region, 2018–2026
Figure 56: Latin America Motion Sickness Treatment Market Size (US$ Mn) Forecast and Y-o-Y Growth (%) Projection, 2016–2026
Figure 57: Latin America Motion Sickness Treatment Market Value Share Analysis, by Treatment Type, 2017 and 2026
Figure 58: Latin America Motion Sickness Treatment Market Attractiveness Analysis, by Treatment Type, 2018–2026
Figure 59: Latin America Motion Sickness Treatment Market Value Share Analysis, by Route of Administration, 2017 and 2026
Figure 60: Latin America Motion Sickness Treatment Market Attractiveness Analysis, by Route of Administration, 2018–2026
Figure 61: Latin America Motion Sickness Treatment Market Value Share Analysis, by Distribution Channel, 2017 and 2026
Figure 62: Latin America Motion Sickness Treatment Market Attractiveness Analysis, by Distribution Channel, 2018–2026
Figure 63: Latin America Motion Sickness Treatment Market Value Share Analysis, by Country / Sub-region, 2017 and 2026
Figure 64: Latin America Motion Sickness Treatment Market Attractiveness Analysis, by Country / Sub-region, 2018–2026
Figure 65: Middle East & Africa Motion Sickness Treatment Market Size (US$ Mn) Forecast and Y-o-Y Growth (%) Projection, 2016–2026
Figure 66: Middle East & Africa Motion Sickness Treatment Market Value Share Analysis, by Treatment Type, 2017 and 2026
Figure 67: Middle East & Africa Motion Sickness Treatment Market Attractiveness Analysis, by Treatment Type, 2018–2026
Figure 68: Middle East & Africa Motion Sickness Treatment Market Value Share Analysis, by Route of Administration, 2017 and 2026
Figure 69: Middle East & Africa Motion Sickness Treatment Market Attractiveness Analysis, by Route of Administration, 2018–2026
Figure 70: Middle East & Africa Motion Sickness Treatment Market Value Share Analysis, by Distribution Channel, 2017 and 2026
Figure 71: Middle East & Africa Motion Sickness Treatment Market Attractiveness Analysis, by Distribution Channel, 2018–2026
Figure 72: Middle East & Africa Motion Sickness Treatment Market Value Share Analysis, by Country/Sub-region, 2017 and 2026
Figure 73: Middle East & Africa Motion Sickness Treatment Market Attractiveness Analysis, by Country/Sub-region, 2018–2026
Figure 74: Key Competitive Strategies Snapshot
Copyright © Transparency Market Research, Inc. All Rights reserved
Trust Online

Motion Sickness Treatment Market