
Reports
Reports
Molded fiber trays have gained a wide preference in the food and beverages packaging industry as they are sustainable, biodegradable, and eco-friendly. Made from newsprint, corrugated boxes, or other plant fibers, molded fiber or molded pulp trays are gaining traction as an environmental-friendly packaging of consumer durables and electronics items, healthcare products, automotive and mechanical parts, and a range of food such as fruits and eggs. On account of their excellent protection and the ease of handling, molded fibers are extensively used for providing edge protection to goods in the transportation and logistics industry. A burgeoning e-commerce retail in a number of industrialized countries is a notable trend catalyzing the demand for molded fiber trays. The demand for molded fibers trays in several packaging applications is also attributed to their flexibility to mold into any shape and size and their environmental friendliness, along with the factor that they are less expensive than most plastics packaging. In addition, their versatility of packing light as well as heavy, non-fragile items has bolstered their demand.
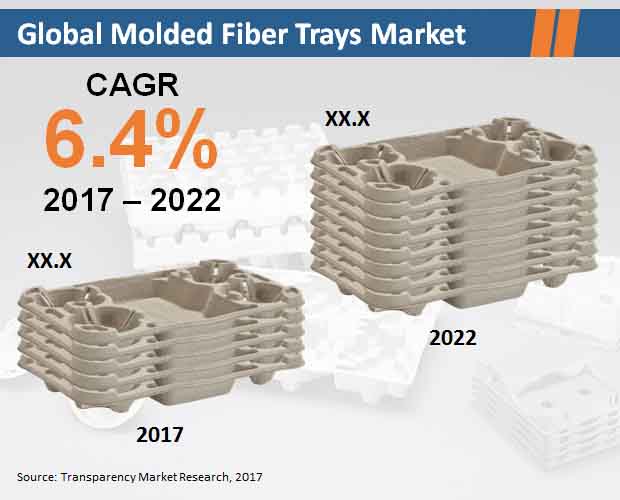
The global molded fiber trays market is estimated to be valued at US$1,777.0 Mn by 2017 end and is forecast to reach a worth of US$2,422.8 Mn by 2022 end. The market is projected to rise at a CAGR of 6.4% from 2017 to 2022.
Based on pulp type, the various segments of the molded fiber trays are transfer molded, thick wall, thermoformed fiber, and processed pulp. Of these, the transfer molded pulp type segment leads the market holding a share of 54.3% in 2017 or US$965.4 Mn of the market. Expanding at a CAGR of 6.9% during 2017–2022, the segment is anticipated to be worth US$1,346.9 Mn by 2022 end. The segment is projected to witness an annual growth of US$76.3 Mn during the forecast timeline and this growth in absolute terms is more than that of any other segment. The wide prevalence of this type of molded fiber trays is attributed to an excellent product finish and their substantial demand in packaging a variety of electronic equipment and household items. Typically being thin-walled relative to other pulp types, transfer molded fiber trays find wide use in the packaging of delicate and light-weight items.
The growth of molded fiber trays is observed in regions such as Latin America, North America, the Middle East and Africa, Europe, Asia Pacific excluding Japan, and Japan. Of these, the Europe molded fiber trays market currently leads the global market and is forecast to hold the dominant share, vis-à-vis revenue, throughout the forecast period. The regional market is projected to expand at a CAGR of 6.6% during 2017–2022 and is anticipated to account for an absolute opportunity of US$231.2 Mn during this period.
North America is anticipated to emerge as a prominent market for molded fiber trays in the coming years. A robust food processing industry and a burgeoning modern trade store for packed food items in various parts of North America are notable factors expected to accentuate the regional market. Rising at a CAGR of 5.1% from 2017 to 2022, the North America market is predicted to be worth US$ 492.9 Mn by the end of the forecast period. The regional market is forecast to be valued at US$ 384.6 Mn by 2017 end.
Leading players profiled in the report are Brødrene Hartmann A/S, UFP Technologies, Inc., Huhtamaki, Oyj, Henry Molded Products, Inc., Pactiv LLC, Fibercel Packaging LLC, Orcon Industries Corporation, and Vernacare Limited. Prominent packaging companies operating in the market are expanding their production capabilities and entering into partnerships in major regions, in order to gain a competitive edge over other players.
Products in Molded Fiber Trays Market Reinforce Packaging Recyclability as Key Consumer Proposition
Trays made of molded fiber are used in both primary and secondary packaging and are used in shipping and transporting applications. Molded fiber are usually made of recyclable or environmentally friendly packaging materials. Key raw materials used are newsprint, plant fiber, and corrugated boxes, and key product types in the molded fiber trays market are processed pulps, transfer molded fiber, and thermoformed fiber. A range of pre and post consumer recycled fibers used in making these trays make them environmentally friendly as well as functional to meet the wide range of needs in end-use industries. They have been used extensively in food packaging as food containers. Growing use of molded fiber packaging in the food and beverages industry is a key factor propelling the expansion of sales in the molded fiber trays market. Advances in composting infrastructures have helped magnify the recyclability quotient of molded fiber. Substantially growing demand for conventional and microwave ovens in the food sector in range of shapes and sizes in several developing economies is a key trend boosting the market. Packaging companies in the molded fiber trays have been increasingly leaning on customizing their offering.
The COVID-19 pandemic has altered the retail and distribution strategies of the food sector around the world. The outbreaks in several parts of the world had led to massive lockdowns and restrictions of various economic activities. The restrictions has also put snags on the consumer demand for retail products, including packaged food and beverages products. Such dynamic has hindered the prospect of the molded fiber trays market as well. However, in recent months, there has been new positive developments and consumer demands have also been growing significantly. Food services industry has also making some strides. All these have favoured the growth dynamics of the molded fiber trays. On the other hand, the recyclability quotients will continue to make waves in the overall packaging sector.
Molded Fiber Trays Market is projected to reach US$2,422.8 Mn by 2022
Brødrene Hartmann A/S, UFP Technologies, Inc., Huhtamaki, Oyj, Henry Molded Products, Inc., Pactiv LLC, Fibercel Packaging LLC, are a few of the key vendors in the Molded Fiber Trays Market.
The Molded Fiber Trays Market is expected to grow at a CAGR of 6.4% during 2017-2022
Molded Fiber Trays Market has been segmented on the basis of technology, end-use industry and region.
North America Shows Signs of Fastest Growth in Near Future
1. Global Molded Fiber Trays Market - Executive Summary
2. Global Molded Fiber Trays Market Overview
2.1. Introduction
2.1.1. Global Molded Fiber Trays Market Taxonomy
2.1.2. Global Molded Fiber Trays Market Definition
2.2. Global Molded Fiber Trays Market Size (US$ Mn) and Forecast, 2012-2022
2.2.1. Global Molded Fiber Trays Market Y-o-Y Growth
2.3. Global Molded Fiber Trays Market Dynamics
2.4. Supply Chain
2.5. Cost Structure
2.6. Pricing Analysis
2.7. Raw Material Sourcing Strategy and Analysis
2.8. List of Distributors
2.9. Key Participants Market Presence (Intensity Map) By Region
3. Global Molded Fiber Trays Market Analysis and Forecast By Molded Pulp Type
3.1. Global Molded Fiber Trays Market Size and Forecast By Molded Pulp Type, 2012-2022
3.1.1. Thick Wall Market Size and Forecast, 2012-2022
3.1.1.1. Revenue (US$ Mn) Comparison, By Region
3.1.1.2. Market Share Comparison, By Region
3.1.1.3. Y-o-Y growth Comparison, By Region
3.1.2. Transfer Molded Market Size and Forecast, 2012-2022
3.1.2.1. Revenue (US$ Mn) Comparison, By Region
3.1.2.2. Market Share Comparison, By Region
3.1.2.3. Y-o-Y growth Comparison, By Region
3.1.3. Thermoformed Fiber Market Size and Forecast, 2012-2022
3.1.3.1. Revenue (US$ Mn) Comparison, By Region
3.1.3.2. Market Share Comparison, By Region
3.1.3.3. Y-o-Y growth Comparison, By Region
3.1.4. Processed Pulp Market Size and Forecast, 2012-2022
3.1.4.1. Revenue (US$ Mn) Comparison, By Region
3.1.4.2. Market Share Comparison, By Region
3.1.4.3. Y-o-Y growth Comparison, By Region
4. Global Molded Fiber Trays Market Analysis and Forecast By End Use
4.1. Global Molded Fiber Trays Market Size and Forecast By End Use, 2012-2022
4.1.1. Consumer Durables & Electronics Market Size and Forecast, 2012-2022
4.1.1.1. Revenue (US$ Mn) Comparison, By Region
4.1.1.2. Market Share Comparison, By Region
4.1.1.3. Y-o-Y growth Comparison, By Region
4.1.2. Food & Beverage Packaging (Egg, Wine, frozen food, vegetables etc) Market Size and Forecast, 2012-2022
4.1.2.1. Revenue (US$ Mn) Comparison, By Region
4.1.2.2. Market Share Comparison, By Region
4.1.2.3. Y-o-Y growth Comparison, By Region
4.1.3. Healthcare Products Packaging Market Size and Forecast, 2012-2022
4.1.3.1. Revenue (US$ Mn) Comparison, By Region
4.1.3.2. Market Share Comparison, By Region
4.1.3.3. Y-o-Y growth Comparison, By Region
4.1.4. Automotive & Mechanical Parts Packaging Market Size and Forecast, 2012-2022
4.1.4.1. Revenue (US$ Mn) Comparison, By Region
4.1.4.2. Market Share Comparison, By Region
4.1.4.3. Y-o-Y growth Comparison, By Region
4.1.5. Transportation & Logistics Market Size and Forecast, 2012-2022
4.1.5.1. Revenue (US$ Mn) Comparison, By Region
4.1.5.2. Market Share Comparison, By Region
4.1.5.3. Y-o-Y growth Comparison, By Region
4.1.6. Food Service Disposables Market Size and Forecast, 2012-2022
4.1.6.1. Revenue (US$ Mn) Comparison, By Region
4.1.6.2. Market Share Comparison, By Region
4.1.6.3. Y-o-Y growth Comparison, By Region
4.1.7. Others Market Size and Forecast, 2012-2022
4.1.7.1. Revenue (US$ Mn) Comparison, By Region
4.1.7.2. Market Share Comparison, By Region
4.1.7.3. Y-o-Y growth Comparison, By Region
5. Global Molded Fiber Trays Market Analysis and Forecast By Region
5.1. Global Molded Fiber Trays Market Size and Forecast, 2012-2022
5.1.1. North America Molded Fiber Trays Market Size and Forecast, 2012-2022
5.1.1.1. Revenue (US$ Mn) Comparison, By Molded Pulp Type
5.1.1.2. Revenue (US$ Mn) Comparison, By End Use
5.1.2. Latin America Molded Fiber Trays Market Size and Forecast, 2012-2022
5.1.2.1. Revenue (US$ Mn) Comparison, By Molded Pulp Type
5.1.2.2. Revenue (US$ Mn) Comparison, By End Use
5.1.3. Europe Molded Fiber Trays Market Size and Forecast, 2012-2022
5.1.3.1. Revenue (US$ Mn) Comparison, By Molded Pulp Type
5.1.3.2. Revenue (US$ Mn) Comparison, By End Use
5.1.4. Japan Molded Fiber Trays Market Size and Forecast, 2012-2022
5.1.4.1. Revenue (US$ Mn) Comparison, By Molded Pulp Type
5.1.4.2. Revenue (US$ Mn) Comparison, By End Use
5.1.5. APEJ Molded Fiber Trays Market Size and Forecast, 2012-2022
5.1.5.1. Revenue (US$ Mn) Comparison, By Molded Pulp Type
5.1.5.2. Revenue (US$ Mn) Comparison, By End Use
5.1.6. MEA Molded Fiber Trays Market Size and Forecast, 2012-2022
5.1.6.1. Revenue (US$ Mn) Comparison, By Molded Pulp Type
5.1.6.2. Revenue (US$ Mn) Comparison, By End Use
6. North America Molded Fiber Trays Market Analysis and Forecast, By Country, 2012-2022
6.1. US Molded Fiber Trays Market Size and Forecast, 2012-2022
6.1.1. Revenue (US$ Mn) Comparison, By Molded Pulp Type
6.1.2. Revenue (US$ Mn) Comparison, By End Use
6.2. Canada Molded Fiber Trays Market Size and Forecast, 2012-2022
6.2.1. Revenue (US$ Mn) Comparison, By Molded Pulp Type
6.2.2. Revenue (US$ Mn) Comparison, By End Use
7. Latin America Molded Fiber Trays Market Analysis and Forecast, By Country, 2012-2022
7.1. Brazil Molded Fiber Trays Market Size and Forecast, 2012-2022
7.1.1. Revenue (US$ Mn) Comparison, By Molded Pulp Type
7.1.2. Revenue (US$ Mn) Comparison, By End Use
7.2. Mexico Molded Fiber Trays Market Size and Forecast, 2012-2022
7.2.1. Revenue (US$ Mn) Comparison, By Molded Pulp Type
7.2.2. Revenue (US$ Mn) Comparison, By End Use
7.3. Argentina Molded Fiber Trays Market Size and Forecast, 2012-2022
7.3.1. Revenue (US$ Mn) Comparison, By Molded Pulp Type
7.3.2. Revenue (US$ Mn) Comparison, By End Use
8. Europe Molded Fiber Trays Market Analysis and Forecast, By Country, 2012-2022
8.1. Germany Molded Fiber Trays Market Size and Forecast, 2012-2022
8.1.1. Revenue (US$ Mn) Comparison, By Molded Pulp Type
8.1.2. Revenue (US$ Mn) Comparison, By End Use
8.2. UK Molded Fiber Trays Market Size and Forecast, 2012-2022
8.2.1. Revenue (US$ Mn) Comparison, By Molded Pulp Type
8.2.2. Revenue (US$ Mn) Comparison, By End Use
8.3. France Molded Fiber Trays Market Size and Forecast, 2012-2022
8.3.1. Revenue (US$ Mn) Comparison, By Molded Pulp Type
8.3.2. Revenue (US$ Mn) Comparison, By End Use
8.4. Spain Molded Fiber Trays Market Size and Forecast, 2012-2022
8.4.1. Revenue (US$ Mn) Comparison, By Molded Pulp Type
8.4.2. Revenue (US$ Mn) Comparison, By End Use
8.5. Italy Molded Fiber Trays Market Size and Forecast, 2012-2022
8.5.1. Revenue (US$ Mn) Comparison, By Molded Pulp Type
8.5.2. Revenue (US$ Mn) Comparison, By End Use
8.6. Russia Molded Fiber Trays Market Size and Forecast, 2012-2022
8.6.1. Revenue (US$ Mn) Comparison, By Molded Pulp Type
8.6.2. Revenue (US$ Mn) Comparison, By End Use
9. Japan Molded Fiber Trays Market Analysis and Forecast, By Country, 2012-2022
9.1. Japan Molded Fiber Trays Market Size and Forecast, 2012-2022
9.1.1. Revenue (US$ Mn) Comparison, By Molded Pulp Type
9.1.2. Revenue (US$ Mn) Comparison, By End Use
10. APEJ Molded Fiber Trays Market Analysis and Forecast, By Country, 2012-2022
10.1. China Molded Fiber Trays Market Size and Forecast, 2012-2022
10.1.1. Revenue (US$ Mn) Comparison, By Molded Pulp Type
10.1.2. Revenue (US$ Mn) Comparison, By End Use
10.2. India Molded Fiber Trays Market Size and Forecast, 2012-2022
10.2.1. Revenue (US$ Mn) Comparison, By Molded Pulp Type
10.2.2. Revenue (US$ Mn) Comparison, By End Use
10.3. Malaysia Molded Fiber Trays Market Size and Forecast, 2012-2022
10.3.1. Revenue (US$ Mn) Comparison, By Molded Pulp Type
10.3.2. Revenue (US$ Mn) Comparison, By End Use
10.4. Thailand Molded Fiber Trays Market Size and Forecast, 2012-2022
10.4.1. Revenue (US$ Mn) Comparison, By Molded Pulp Type
10.4.2. Revenue (US$ Mn) Comparison, By End Use
10.5. Singapore Molded Fiber Trays Market Size and Forecast, 2012-2022
10.5.1. Revenue (US$ Mn) Comparison, By Molded Pulp Type
10.5.2. Revenue (US$ Mn) Comparison, By End Use
10.6. Australia Molded Fiber Trays Market Size and Forecast, 2012-2022
10.6.1. Revenue (US$ Mn) Comparison, By Molded Pulp Type
10.6.2. Revenue (US$ Mn) Comparison, By End Use
11. MEA Molded Fiber Trays Market Analysis and Forecast, By Country, 2012-2022
11.1. GCC Countries Molded Fiber Trays Market Size and Forecast, 2012-2022
11.1.1. Revenue (US$ Mn) Comparison, By Molded Pulp Type
11.1.2. Revenue (US$ Mn) Comparison, By End Use
11.2. South Africa Molded Fiber Trays Market Size and Forecast, 2012-2022
11.2.1. Revenue (US$ Mn) Comparison, By Molded Pulp Type
11.2.2. Revenue (US$ Mn) Comparison, By End Use
11.3. Nigeria Molded Fiber Trays Market Size and Forecast, 2012-2022
11.3.1. Revenue (US$ Mn) Comparison, By Molded Pulp Type
11.3.2. Revenue (US$ Mn) Comparison, By End Use
11.4. Israel Molded Fiber Trays Market Size and Forecast, 2012-2022
11.4.1. Revenue (US$ Mn) Comparison, By Molded Pulp Type
11.4.2. Revenue (US$ Mn) Comparison, By End Use
12. Global Molded Fiber Trays Market Company Share, Competition Landscape and Company Profiles
12.1. Company Share Analysis
12.2. Competition Landscape
12.3. Company Profiles
12.3.1. Huhtamaki, Oyj
12.3.2. Brødrene Hartmann A/S
12.3.3. UFP Technologies, Inc.
12.3.4. Pactiv LLC
12.3.5. Henry Molded Products, Inc.
12.3.6. Orcon Industries Corp.
12.3.7. Fibercel Packaging LLC
12.3.8. Vernacare Limited
13. Research Methodology
14. Secondary and Primary Sources
15. Assumptions and Acronyms
16. Disclaimer
List of Tables
TABLE 1 Global Molded Fiber Trays Market Value (US$ Mn), 2012-2016
TABLE 2 Global Molded Fiber Trays Market Value (US$ Mn), 2017-2022
TABLE 3 Global Molded Fiber Trays Market Value (US$ Mn) and Y-o-Y, 2015-2022
TABLE 4 Global Thick Wall Segment Value (US$ Mn), By Region 2012-2016
TABLE 5 Global Thick Wall Segment Value (US$ Mn), By Region 2017-2022
TABLE 6 Global Thick Wall Segment Market Share, By Region 2012-2016
TABLE 7 Global Thick Wall Segment Market Share, By Region 2017-2022
TABLE 8 Global Thick Wall Segment Y-o-Y, By Region 2015-2022
TABLE 9 Global Transfer Molded Segment Value (US$ Mn), By Region 2012-2016
TABLE 10 Global Transfer Molded Segment Value (US$ Mn), By Region 2017-2022
TABLE 11 Global Transfer Molded Segment Market Share, By Region 2012-2016
TABLE 12 Global Transfer Molded Segment Market Share, By Region 2017-2022
TABLE 13 Global Transfer Molded Segment Y-o-Y, By Region 2015-2022
TABLE 14 Global Thermoformed Fiber Segment Value (US$ Mn), By Region 2012-2016
TABLE 15 Global Thermoformed Fiber Segment Value (US$ Mn), By Region 2017-2022
TABLE 16 Global Thermoformed Fiber Segment Market Share, By Region 2012-2016
TABLE 17 Global Thermoformed Fiber Segment Market Share, By Region 2017-2022
TABLE 18 Global Thermoformed Fiber Segment Y-o-Y, By Region 2015-2022
TABLE 19 Global Processed Pulp Segment Value (US$ Mn), By Region 2012-2016
TABLE 20 Global Processed Pulp Segment Value (US$ Mn), By Region 2017-2022
TABLE 21 Global Processed Pulp Segment Market Share, By Region 2012-2016
TABLE 22 Global Processed Pulp Segment Market Share, By Region 2017-2022
TABLE 23 Global Processed Pulp Segment Y-o-Y, By Region 2015-2022
TABLE 24 Global Consumer Durables & Electronics Segment Value (US$ Mn), By Region 2012-2016
TABLE 25 Global Consumer Durables & Electronics Segment Value (US$ Mn), By Region 2017-2022
TABLE 26 Global Consumer Durables & Electronics Segment Market Share, By Region 2012-2016
TABLE 27 Global Consumer Durables & Electronics Segment Market Share, By Region 2017-2022
TABLE 28 Global Consumer Durables & Electronics Segment Y-o-Y, By Region 2015-2022
TABLE 29 Global Food & Beverage Packaging (Egg, Wine, frozen food, vegetables etc) Segment Value (US$ Mn), By Region 2012-2016
TABLE 30 Global Food & Beverage Packaging (Egg, Wine, frozen food, vegetables etc) Segment Value (US$ Mn), By Region 2017-2022
TABLE 31 Global Food & Beverage Packaging (Egg, Wine, frozen food, vegetables etc) Segment Market Share, By Region 2012-2016
TABLE 32 Global Food & Beverage Packaging (Egg, Wine, frozen food, vegetables etc) Segment Market Share, By Region 2017-2022
TABLE 33 Global Food & Beverage Packaging (Egg, Wine, frozen food, vegetables etc) Segment Y-o-Y, By Region 2015-2022
TABLE 34 Global Healthcare Products Packaging Segment Value (US$ Mn), By Region 2012-2016
TABLE 35 Global Healthcare Products Packaging Segment Value (US$ Mn), By Region 2017-2022
TABLE 36 Global Healthcare Products Packaging Segment Market Share, By Region 2012-2016
TABLE 37 Global Healthcare Products Packaging Segment Market Share, By Region 2017-2022
TABLE 38 Global Healthcare Products Packaging Segment Y-o-Y, By Region 2015-2022
TABLE 39 Global Automotive & Mechanical Parts Packaging Segment Value (US$ Mn), By Region 2012-2016
TABLE 40 Global Automotive & Mechanical Parts Packaging Segment Value (US$ Mn), By Region 2017-2022
TABLE 41 Global Automotive & Mechanical Parts Packaging Segment Market Share, By Region 2012-2016
TABLE 42 Global Automotive & Mechanical Parts Packaging Segment Market Share, By Region 2017-2022
TABLE 43 Global Automotive & Mechanical Parts Packaging Segment Y-o-Y, By Region 2015-2022
TABLE 44 Global Transportation & Logistics Segment Value (US$ Mn), By Region 2012-2016
TABLE 45 Global Transportation & Logistics Segment Value (US$ Mn), By Region 2017-2022
TABLE 46 Global Transportation & Logistics Segment Market Share, By Region 2012-2016
TABLE 47 Global Transportation & Logistics Segment Market Share, By Region 2017-2022
TABLE 48 Global Transportation & Logistics Segment Y-o-Y, By Region 2015-2022
TABLE 49 Global Food Service Disposables Segment Value (US$ Mn), By Region 2012-2016
TABLE 50 Global Food Service Disposables Segment Value (US$ Mn), By Region 2017-2022
TABLE 51 Global Food Service Disposables Segment Market Share, By Region 2012-2016
TABLE 52 Global Food Service Disposables Segment Market Share, By Region 2017-2022
TABLE 53 Global Food Service Disposables Segment Y-o-Y, By Region 2015-2022
TABLE 54 Global Others Segment Value (US$ Mn), By Region 2012-2016
TABLE 55 Global Others Segment Value (US$ Mn), By Region 2017-2022
TABLE 56 Global Others Segment Market Share, By Region 2012-2016
TABLE 57 Global Others Segment Market Share, By Region 2017-2022
TABLE 58 Global Others Segment Y-o-Y, By Region 2015-2022
TABLE 59 North America Molded Fiber Trays Market Value (US$ Mn), By Molded Pulp Type 2012-2016
TABLE 60 North America Molded Fiber Trays Market Value (US$ Mn), By Molded Pulp Type 2017-2022
TABLE 61 North America Molded Fiber Trays Market Value (US$ Mn), By End Use 2012-2016
TABLE 62 North America Molded Fiber Trays Market Value (US$ Mn), By End Use 2017-2022
TABLE 63 Latin America Molded Fiber Trays Market Value (US$ Mn), By Molded Pulp Type 2012-2016
TABLE 64 Latin America Molded Fiber Trays Market Value (US$ Mn), By Molded Pulp Type 2017-2022
TABLE 65 Latin America Molded Fiber Trays Market Value (US$ Mn), By End Use 2012-2016
TABLE 66 Latin America Molded Fiber Trays Market Value (US$ Mn), By End Use 2017-2022
TABLE 67 Europe Molded Fiber Trays Market Value (US$ Mn), By Molded Pulp Type 2012-2016
TABLE 68 Europe Molded Fiber Trays Market Value (US$ Mn), By Molded Pulp Type 2017-2022
TABLE 69 Europe Molded Fiber Trays Market Value (US$ Mn), By End Use 2012-2016
TABLE 70 Europe Molded Fiber Trays Market Value (US$ Mn), By End Use 2017-2022
TABLE 71 Japan Molded Fiber Trays Market Value (US$ Mn), By Molded Pulp Type 2012-2016
TABLE 72 Japan Molded Fiber Trays Market Value (US$ Mn), By Molded Pulp Type 2017-2022
TABLE 73 Japan Molded Fiber Trays Market Value (US$ Mn), By End Use 2012-2016
TABLE 74 Japan Molded Fiber Trays Market Value (US$ Mn), By End Use 2017-2022
TABLE 75 APEJ Molded Fiber Trays Market Value (US$ Mn), By Molded Pulp Type 2012-2016
TABLE 76 APEJ Molded Fiber Trays Market Value (US$ Mn), By Molded Pulp Type 2017-2022
TABLE 77 APEJ Molded Fiber Trays Market Value (US$ Mn), By End Use 2012-2016
TABLE 78 APEJ Molded Fiber Trays Market Value (US$ Mn), By End Use 2017-2022
TABLE 79 MEA Molded Fiber Trays Market Value (US$ Mn), By Molded Pulp Type 2012-2016
TABLE 80 MEA Molded Fiber Trays Market Value (US$ Mn), By Molded Pulp Type 2017-2022
TABLE 81 MEA Molded Fiber Trays Market Value (US$ Mn), By End Use 2012-2016
TABLE 82 MEA Molded Fiber Trays Market Value (US$ Mn), By End Use 2017-2022
TABLE 83 US Molded Fiber Trays Market Value (US$ Mn), By Molded Pulp Type 2012-2016
TABLE 84 US Molded Fiber Trays Market Value (US$ Mn), By Molded Pulp Type 2017-2022
TABLE 85 US Molded Fiber Trays Market Value (US$ Mn), By End Use 2012-2016
TABLE 86 US Molded Fiber Trays Market Value (US$ Mn), By End Use 2017-2022
TABLE 87 Canada Molded Fiber Trays Market Value (US$ Mn), By Molded Pulp Type 2012-2016
TABLE 88 Canada Molded Fiber Trays Market Value (US$ Mn), By Molded Pulp Type 2017-2022
TABLE 89 Canada Molded Fiber Trays Market Value (US$ Mn), By End Use 2012-2016
TABLE 90 Canada Molded Fiber Trays Market Value (US$ Mn), By End Use 2017-2022
TABLE 91 Brazil Molded Fiber Trays Market Value (US$ Mn), By Molded Pulp Type 2012-2016
TABLE 92 Brazil Molded Fiber Trays Market Value (US$ Mn), By Molded Pulp Type 2017-2022
TABLE 93 Brazil Molded Fiber Trays Market Value (US$ Mn), By End Use 2012-2016
TABLE 94 Brazil Molded Fiber Trays Market Value (US$ Mn), By End Use 2017-2022
TABLE 95 Mexico Molded Fiber Trays Market Value (US$ Mn), By Molded Pulp Type 2012-2016
TABLE 96 Mexico Molded Fiber Trays Market Value (US$ Mn), By Molded Pulp Type 2017-2022
TABLE 97 Mexico Molded Fiber Trays Market Value (US$ Mn), By End Use 2012-2016
TABLE 98 Mexico Molded Fiber Trays Market Value (US$ Mn), By End Use 2017-2022
TABLE 99 Argentina Molded Fiber Trays Market Value (US$ Mn), By Molded Pulp Type 2012-2016
TABLE 100 Argentina Molded Fiber Trays Market Value (US$ Mn), By Molded Pulp Type 2017-2022
TABLE 101 Argentina Molded Fiber Trays Market Value (US$ Mn), By End Use 2012-2016
TABLE 102 Argentina Molded Fiber Trays Market Value (US$ Mn), By End Use 2017-2022
TABLE 103 Germany Molded Fiber Trays Market Value (US$ Mn), By Molded Pulp Type 2012-2016
TABLE 104 Germany Molded Fiber Trays Market Value (US$ Mn), By Molded Pulp Type 2017-2022
TABLE 105 Germany Molded Fiber Trays Market Value (US$ Mn), By End Use 2012-2016
TABLE 106 Germany Molded Fiber Trays Market Value (US$ Mn), By End Use 2017-2022
TABLE 107 UK Molded Fiber Trays Market Value (US$ Mn), By Molded Pulp Type 2012-2016
TABLE 108 UK Molded Fiber Trays Market Value (US$ Mn), By Molded Pulp Type 2017-2022
TABLE 109 UK Molded Fiber Trays Market Value (US$ Mn), By End Use 2012-2016
TABLE 110 UK Molded Fiber Trays Market Value (US$ Mn), By End Use 2017-2022
TABLE 111 France Molded Fiber Trays Market Value (US$ Mn), By Molded Pulp Type 2012-2016
TABLE 112 France Molded Fiber Trays Market Value (US$ Mn), By Molded Pulp Type 2017-2022
TABLE 113 France Molded Fiber Trays Market Value (US$ Mn), By End Use 2012-2016
TABLE 114 France Molded Fiber Trays Market Value (US$ Mn), By End Use 2017-2022
TABLE 115 Spain Molded Fiber Trays Market Value (US$ Mn), By Molded Pulp Type 2012-2016
TABLE 116 Spain Molded Fiber Trays Market Value (US$ Mn), By Molded Pulp Type 2017-2022
TABLE 117 Spain Molded Fiber Trays Market Value (US$ Mn), By End Use 2012-2016
TABLE 118 Spain Molded Fiber Trays Market Value (US$ Mn), By End Use 2017-2022
TABLE 119 Italy Molded Fiber Trays Market Value (US$ Mn), By Molded Pulp Type 2012-2016
TABLE 120 Italy Molded Fiber Trays Market Value (US$ Mn), By Molded Pulp Type 2017-2022
TABLE 121 Italy Molded Fiber Trays Market Value (US$ Mn), By End Use 2012-2016
TABLE 122 Italy Molded Fiber Trays Market Value (US$ Mn), By End Use 2017-2022
TABLE 123 Russia Molded Fiber Trays Market Value (US$ Mn), By Molded Pulp Type 2012-2016
TABLE 124 Russia Molded Fiber Trays Market Value (US$ Mn), By Molded Pulp Type 2017-2022
TABLE 125 Russia Molded Fiber Trays Market Value (US$ Mn), By End Use 2012-2016
TABLE 126 Russia Molded Fiber Trays Market Value (US$ Mn), By End Use 2017-2022
TABLE 127 Japan Molded Fiber Trays Market Value (US$ Mn), By Molded Pulp Type 2012-2016
TABLE 128 Japan Molded Fiber Trays Market Value (US$ Mn), By Molded Pulp Type 2017-2022
TABLE 129 Japan Molded Fiber Trays Market Value (US$ Mn), By End Use 2012-2016
TABLE 130 Japan Molded Fiber Trays Market Value (US$ Mn), By End Use 2017-2022
TABLE 131 China Molded Fiber Trays Market Value (US$ Mn), By Molded Pulp Type 2012-2016
TABLE 132 China Molded Fiber Trays Market Value (US$ Mn), By Molded Pulp Type 2017-2022
TABLE 133 China Molded Fiber Trays Market Value (US$ Mn), By End Use 2012-2016
TABLE 134 China Molded Fiber Trays Market Value (US$ Mn), By End Use 2017-2022
TABLE 135 India Molded Fiber Trays Market Value (US$ Mn), By Molded Pulp Type 2012-2016
TABLE 136 India Molded Fiber Trays Market Value (US$ Mn), By Molded Pulp Type 2017-2022
TABLE 137 India Molded Fiber Trays Market Value (US$ Mn), By End Use 2012-2016
TABLE 138 India Molded Fiber Trays Market Value (US$ Mn), By End Use 2017-2022
TABLE 139 Malaysia Molded Fiber Trays Market Value (US$ Mn), By Molded Pulp Type 2012-2016
TABLE 140 Malaysia Molded Fiber Trays Market Value (US$ Mn), By Molded Pulp Type 2017-2022
TABLE 141 Malaysia Molded Fiber Trays Market Value (US$ Mn), By End Use 2012-2016
TABLE 142 Malaysia Molded Fiber Trays Market Value (US$ Mn), By End Use 2017-2022
TABLE 143 Thailand Molded Fiber Trays Market Value (US$ Mn), By Molded Pulp Type 2012-2016
TABLE 144 Thailand Molded Fiber Trays Market Value (US$ Mn), By Molded Pulp Type 2017-2022
TABLE 145 Thailand Molded Fiber Trays Market Value (US$ Mn), By End Use 2012-2016
TABLE 146 Thailand Molded Fiber Trays Market Value (US$ Mn), By End Use 2017-2022
TABLE 147 Singapore Molded Fiber Trays Market Value (US$ Mn), By Molded Pulp Type 2012-2016
TABLE 148 Singapore Molded Fiber Trays Market Value (US$ Mn), By Molded Pulp Type 2017-2022
TABLE 149 Singapore Molded Fiber Trays Market Value (US$ Mn), By End Use 2012-2016
TABLE 150 Singapore Molded Fiber Trays Market Value (US$ Mn), By End Use 2017-2022
TABLE 151 Australia Molded Fiber Trays Market Value (US$ Mn), By Molded Pulp Type 2012-2016
TABLE 152 Australia Molded Fiber Trays Market Value (US$ Mn), By Molded Pulp Type 2017-2022
TABLE 153 Australia Molded Fiber Trays Market Value (US$ Mn), By End Use 2012-2016
TABLE 154 Australia Molded Fiber Trays Market Value (US$ Mn), By End Use 2017-2022
TABLE 155 GCC Countries Molded Fiber Trays Market Value (US$ Mn), By Molded Pulp Type 2012-2016
TABLE 156 GCC Countries Molded Fiber Trays Market Value (US$ Mn), By Molded Pulp Type 2017-2022
TABLE 157 GCC Countries Molded Fiber Trays Market Value (US$ Mn), By End Use 2012-2016
TABLE 158 GCC Countries Molded Fiber Trays Market Value (US$ Mn), By End Use 2017-2022
TABLE 159 South Africa Molded Fiber Trays Market Value (US$ Mn), By Molded Pulp Type 2012-2016
TABLE 160 South Africa Molded Fiber Trays Market Value (US$ Mn), By Molded Pulp Type 2017-2022
TABLE 161 South Africa Molded Fiber Trays Market Value (US$ Mn), By End Use 2012-2016
TABLE 162 South Africa Molded Fiber Trays Market Value (US$ Mn), By End Use 2017-2022
TABLE 163 Nigeria Molded Fiber Trays Market Value (US$ Mn), By Molded Pulp Type 2012-2016
TABLE 164 Nigeria Molded Fiber Trays Market Value (US$ Mn), By Molded Pulp Type 2017-2022
TABLE 165 Nigeria Molded Fiber Trays Market Value (US$ Mn), By End Use 2012-2016
TABLE 166 Nigeria Molded Fiber Trays Market Value (US$ Mn), By End Use 2017-2022
TABLE 167 Israel Molded Fiber Trays Market Value (US$ Mn), By Molded Pulp Type 2012-2016
TABLE 168 Israel Molded Fiber Trays Market Value (US$ Mn), By Molded Pulp Type 2017-2022
TABLE 169 Israel Molded Fiber Trays Market Value (US$ Mn), By End Use 2012-2016
TABLE 170 Israel Molded Fiber Trays Market Value (US$ Mn), By End Use 2017-2022
List of Figures
FIG. 1 Global Molded Fiber Trays Market Value (US$ Mn), 2012-2016
FIG. 2 Global Molded Fiber Trays Market Value (US$ Mn) Forecast, 2017-2022
FIG. 3 Global Molded Fiber Trays Market Value (US$ Mn) and Y-o-Y, 2015-2022
FIG. 4 Global Thick Wall Segment Market Value (US$ Mn) By Region, 2012-2016
FIG. 5 Global Thick Wall Segment Market Value (US$ Mn) By Region, 2017-2022
FIG. 6 Global Thick Wall Segment Y-o-Y Growth Rate, By Region, 2015-2022
FIG. 7 Global Transfer Molded Segment Market Value (US$ Mn) By Region, 2012-2016
FIG. 8 Global Transfer Molded Segment Market Value (US$ Mn) By Region, 2017-2022
FIG. 9 Global Transfer Molded Segment Y-o-Y Growth Rate, By Region, 2015-2022
FIG. 10 Global Thermoformed Fiber Segment Market Value (US$ Mn) By Region, 2012-2016
FIG. 11 Global Thermoformed Fiber Segment Market Value (US$ Mn) By Region, 2017-2022
FIG. 12 Global Thermoformed Fiber Segment Y-o-Y Growth Rate, By Region, 2015-2022
FIG. 13 Global Processed Pulp Segment Market Value (US$ Mn) By Region, 2012-2016
FIG. 14 Global Processed Pulp Segment Market Value (US$ Mn) By Region, 2017-2022
FIG. 15 Global Processed Pulp Segment Y-o-Y Growth Rate, By Region, 2015-2022
FIG. 16 Global Consumer Durables & Electronics Segment Market Value (US$ Mn) By Region, 2012-2016
FIG. 17 Global Consumer Durables & Electronics Segment Market Value (US$ Mn) By Region, 2017-2022
FIG. 18 Global Consumer Durables & Electronics Segment Y-o-Y Growth Rate, By Region, 2015-2022
FIG. 19 Global Food & Beverage Packaging (Egg, Wine, frozen food, vegetables etc) Segment Market Value (US$ Mn) By Region, 2012-2016
FIG. 20 Global Food & Beverage Packaging (Egg, Wine, frozen food, vegetables etc) Segment Market Value (US$ Mn) By Region, 2017-2022
FIG. 21 Global Food & Beverage Packaging (Egg, Wine, frozen food, vegetables etc) Segment Y-o-Y Growth Rate, By Region, 2015-2022
FIG. 22 Global Healthcare Products Packaging Segment Market Value (US$ Mn) By Region, 2012-2016
FIG. 23 Global Healthcare Products Packaging Segment Market Value (US$ Mn) By Region, 2017-2022
FIG. 24 Global Healthcare Products Packaging Segment Y-o-Y Growth Rate, By Region, 2015-2022
FIG. 25 Global Automotive & Mechanical Parts Packaging Segment Market Value (US$ Mn) By Region, 2012-2016
FIG. 26 Global Automotive & Mechanical Parts Packaging Segment Market Value (US$ Mn) By Region, 2017-2022
FIG. 27 Global Automotive & Mechanical Parts Packaging Segment Y-o-Y Growth Rate, By Region, 2015-2022
FIG. 28 Global Transportation & Logistics Segment Market Value (US$ Mn) By Region, 2012-2016
FIG. 29 Global Transportation & Logistics Segment Market Value (US$ Mn) By Region, 2017-2022
FIG. 30 Global Transportation & Logistics Segment Y-o-Y Growth Rate, By Region, 2015-2022
FIG. 31 Global Food Service Disposables Segment Market Value (US$ Mn) By Region, 2012-2016
FIG. 32 Global Food Service Disposables Segment Market Value (US$ Mn) By Region, 2017-2022
FIG. 33 Global Food Service Disposables Segment Y-o-Y Growth Rate, By Region, 2015-2022
FIG. 34 Global Others Segment Market Value (US$ Mn) By Region, 2012-2016
FIG. 35 Global Others Segment Market Value (US$ Mn) By Region, 2017-2022
FIG. 36 Global Others Segment Y-o-Y Growth Rate, By Region, 2015-2022
FIG. 37 North America Molded Fiber Trays Market Value (US$ Mn), By Molded Pulp Type 2012-2016
FIG. 38 North America Molded Fiber Trays Market Value (US$ Mn), By Molded Pulp Type 2017-2022
FIG. 39 North America Molded Fiber Trays Market Value (US$ Mn), By End Use 2012-2016
FIG. 40 North America Molded Fiber Trays Market Value (US$ Mn), By End Use 2017-2022
FIG. 41 Latin America Molded Fiber Trays Market Value (US$ Mn), By Molded Pulp Type 2012-2016
FIG. 42 Latin America Molded Fiber Trays Market Value (US$ Mn), By Molded Pulp Type 2017-2022
FIG. 43 Latin America Molded Fiber Trays Market Value (US$ Mn), By End Use 2012-2016
FIG. 44 Latin America Molded Fiber Trays Market Value (US$ Mn), By End Use 2017-2022
FIG. 45 Europe Molded Fiber Trays Market Value (US$ Mn), By Molded Pulp Type 2012-2016
FIG. 46 Europe Molded Fiber Trays Market Value (US$ Mn), By Molded Pulp Type 2017-2022
FIG. 47 Europe Molded Fiber Trays Market Value (US$ Mn), By End Use 2012-2016
FIG. 48 Europe Molded Fiber Trays Market Value (US$ Mn), By End Use 2017-2022
FIG. 49 Japan Molded Fiber Trays Market Value (US$ Mn), By Molded Pulp Type 2012-2016
FIG. 50 Japan Molded Fiber Trays Market Value (US$ Mn), By Molded Pulp Type 2017-2022
FIG. 51 Japan Molded Fiber Trays Market Value (US$ Mn), By End Use 2012-2016
FIG. 52 Japan Molded Fiber Trays Market Value (US$ Mn), By End Use 2017-2022
FIG. 53 APEJ Molded Fiber Trays Market Value (US$ Mn), By Molded Pulp Type 2012-2016
FIG. 54 APEJ Molded Fiber Trays Market Value (US$ Mn), By Molded Pulp Type 2017-2022
FIG. 55 APEJ Molded Fiber Trays Market Value (US$ Mn), By End Use 2012-2016
FIG. 56 APEJ Molded Fiber Trays Market Value (US$ Mn), By End Use 2017-2022
FIG. 57 MEA Molded Fiber Trays Market Value (US$ Mn), By Molded Pulp Type 2012-2016
FIG. 58 MEA Molded Fiber Trays Market Value (US$ Mn), By Molded Pulp Type 2017-2022
FIG. 59 MEA Molded Fiber Trays Market Value (US$ Mn), By End Use 2012-2016
FIG. 60 MEA Molded Fiber Trays Market Value (US$ Mn), By End Use 2017-2022
Copyright © Transparency Market Research, Inc. All Rights reserved
Trust Online

Molded Fiber Trays Market