
Reports
Reports
Analysts’ Viewpoint on Microgrid-as-a-Service Market Scenario
Companies operating in the microgrid-as-a-service market are focused on business expansion in commercial, industrial, residential, and other high-growth sectors to enhance their share post COVID-19 pandemic. Surge in consumption of electricity and adoption of solar- and wind-based energy is expected to boost the demand for microgrid systems across the globe.
Key players operating in the energy sector are focused on the diversification of utility-based grid infrastructure to drive growth inside and outside the energy sector. The market has witnessed extensive deployment of renewable energy solutions to cater to consumer demand and comply with regulatory guidelines. The microgrid market forecast also suggests higher electricity delivery costs as compared to the cost of production and local storage. Thus, players in the market may focus on enhancement of microgrid infrastructure, primarily to minimize reliance on long-distance distribution lines in order to reduce transmission losses.
Microgrid-as-a-Service (MaaS) is a cutting-edge financing method that enables businesses to deploy microgrid control systems with no upfront costs. The microgrid-as-a-service model reduces complexity and financial risk, enabling more microgrids to be built. In solar energy, microgrid controllers regulate energy generation when the loads or battery system are unable to absorb power.
Currently, conventional centralized grids experience frequent instability, outages, and uncertainty. Particularly, the outages deprive numerous customers of electricity for hours, days, or even weeks. In extreme circumstances, such as natural disasters that disrupt the grid and the supply chain, the situation is even worse. Institutions, businesses, and other organizations rely on microgrid solutions to address frequent power outages.
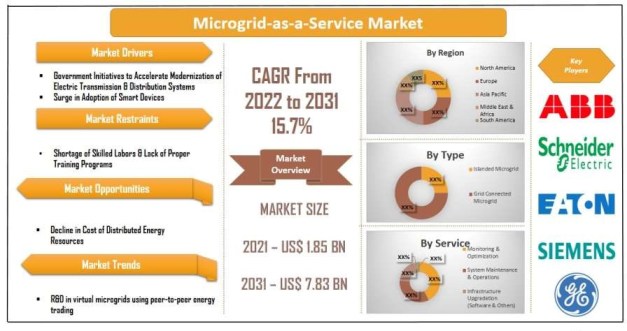
Government initiatives such as feed-in tariffs, tax breaks, and investment subsidies are expected to boost the adoption of renewable microgrids. For instance, the U.S Department of Energy’s Smart Grid Investment Grant (SGIG) Program is focused on acceleration of the modernization of the country’s electric transmission and distribution systems. The American Recovery and Reinvestment Act of 2009 provided US$ 4.5 Bn in funds to modernize the electric power grid. The Smart Grid Investment Grant program, DOE, and the electricity industry represent a total of US$ 8 Bn in investment to empower the electricity delivery system in the country. Such investments are expected to fuel the microgrid market in the U.S.
Several developing countries have deployed smart meters in residential, commercial, and industrial sectors. The number of substations and transmission grids has also increased significantly in these countries. Use of innovative technologies, equipment, and controls in these grids has greatly minimized power outages, reduced storm impacts, and restored services faster when outages occur. Thus, a surge in adoption of smart devices is expected to propel the global microgrid-as-a-services market.
Microgrid solution for commercial and industrial applications also provide various benefits such as improved security, robust integration of renewables in grids, reduced peak loads, and minimized operational costs. However, factors such as absence of adequate training programs and low awareness about advantages of a microgrid-as-a-service are expected to hinder the market.
In terms of type, the global microgrid-as-a-service market has been segregated into islanded microgrid and grid connected microgrid. The grid connected microgrid segment held the highest share of 78% in 2021.
Microgrid is developed to provide a balanced combination of generation and usage for stable and clean energy supply. It is widely used in remote areas such as islands. However, these microgrids are currently becoming cost-effective in urban areas, as solar panels and batteries have become cheaper.
Grid connected microgrids are flexible, as they allow to share or sell unused energy. These microgrids improve the operation and stability of regional electric grids. In a grid connected microgrid, the microgrid works in parallel with the grid, either as the primary or secondary power source. A switching mechanism at the point of coupling enables the microgrid to disconnect from the utility grid and work in island mode. Moreover, it can reconnect to the regional grid when required.
In terms of service, the global microgrid-as-a-service has been classified into monitoring & optimization, system maintenance & operations, infrastructure upgradation (software & others), training, and others. Among these segments, monitoring & optimization held the highest share in the market in 2021.
Microgrid-as-a-service provides monitoring & optimization services to optimize the economic performance of grids. AIO Systems Ltd is one of the major players in the market, offering microgrid management solutions for energy sources, energy status, energy supply, and energy storage. Additionally, the company provides integrated optimal designable software and control hardware solutions for the generation and distribution of electrical energy as well as monitoring and controlling microgrids. These solutions are used to monitor system displays and record real-time information from all assets including current capacity, storage levels, and standby status.
North America held a prominent share of approximately 38% of the global market. The microgrid-as-a-service market in the region is expected to grow significantly in the next few years. Presence of major players and high investment in infrastructure development are likely to augment the market in the region.
Asia Pacific accounted for the second-largest share of the global market, owing to rapid industrialization and urbanization in the region. Adoption of microgrid-as-a-service for residential and commercial applications is increasing in the region. Favorable government regulations are also augmenting the adoption of advanced technologies for grid modernization. These factors are driving the market in Asia Pacific.
Middle East & Africa is a larger market for of microgrid-as-a-service as compared to the South America; however, the market in South America is estimated to grow at a rapid pace as compared to the market in Middle East & Africa.
The global microgrid-as-a-service market is consolidated, with a small number of large-scale vendors controlling majority of the market share. Key players are focused on adoption of various strategies such as investments in R&D, product launches, and mergers & acquisitions to enhance their microgrid as a service market share. Green Energy Corp., Schneider Electric, ENGIE, Spirae, LLC, AIO System Ltd., Aggreko, ABB, General Electric, Eaton, Tech Mahindra, Siemens AG, and Metco Engineering are the prominent entities operating in this market.
Major players in the market are focused on providing cost-saving solutions. Schneider Electric provides Energy-as-a Service (EaaS) - a financing model for microgrids that allows to avoid upfront costs. The company also provides various types of tools such as microgrid advisor, microgrid operation, and grid-tie string inverter.
Furthermore, major players are contributing to market growth through new product launches. ABB provides comprehensive solutions to seamlessly integrate the microgrid into the grid and to control and manage every aspect efficiently. Moreover, the company provides technical expertise and consultancy that are necessary to plan, design, develop, and operate microgrids efficiently. It becomes easier to manage, and control the assets on-site and remotely, as utilities digitize the grid. Likewise, Eaton Corporation provides microgrid solutions to both grid-connected and islanded operations. The solutions help companies facilitate electrical energy savings, resiliency, and independence from a utility.
R&D in virtual microgrids using peer-to-peer energy trading is gaining traction. Use of blockchain technology in microgrids can facilitate trade within a specific virtual or physical microgrid. This emerging approach has the potential to validate, record, and settle energy transactions in real-time.
In February 2021, ABB announced a new strategic collaboration with DEIF, offering control technology to land power, marine, and offshore wind power industries based in Denmark. Both the companies are focused on promoting green energy as the world shifts from fossil to renewable energy resources.
In December 2021, Schneider Electric, a company that specializes in the digital transformation of energy management and automation, and Temasek announced the launch of GreeNext, a joint venture that would offer sustainable and resilient energy solutions to industrial and commercial and industrial vendors through solar and battery hybrid microgrid technology.
Each of these players has been profiled in the microgrid-as-a-service market report based on parameters such as company overview, financial overview, business strategies, product portfolio, business segments, and recent developments.
|
Attribute |
Detail |
|
Market Size Value in 2021 |
US$ 1.85 Bn |
|
Market Forecast Value in 2031 |
US$ 7.83 Bn |
|
Growth Rate (CAGR) |
15.7% |
|
Forecast Period |
2022–2031 |
|
Historical Data Available for |
2017–2020 |
|
Quantitative Units |
US$ Bn for Value |
|
Market Analysis |
It includes cross segment analysis at global as well as regional level. Furthermore, qualitative analysis includes drivers, restraints, opportunities, key trends, Porter’s Five Forces analysis, value chain analysis, and key trend analysis. |
|
Competition Landscape |
|
|
Format |
Electronic (PDF) + Excel |
|
Market Segmentation |
|
|
Regions Covered |
|
|
Countries Covered |
|
|
Companies Profiled |
|
|
Customization Scope |
Available upon request |
|
Pricing |
Available upon request |
The global microgrid-as-a-service market stood at US$ 1.85 Bn in 2021.
The global microgrid-as-a-service market is expected to advance at a CAGR of 15.7% by 2031.
The global microgrid-as-a-service market is expected to reach US$ 7.83 Bn by 2031.
The U.S. accounted for approximately 31% share of the global microgrid-as-a-service market.
The grid connected microgrid segment is expected to hold approximately 75% share of the microgrid-as-a-service market.
R&D in virtual microgrids using peer-to-peer energy trading.
North America is a more lucrative region of the global microgrid-as-a-service market.
Green Energy Corp., Schneider Electric, ENGIE, Spirae, LLC, AIO System Ltd., Aggreko, ABB, General Electric, Eaton, Tech Mahindra, Siemens AG, and Metco Engineering.
1. Preface
1.1. Market Introduction
1.2. Market and Segments Definition
1.3. Market Taxonomy
1.4. Research Methodology
1.5. Assumption and Acronyms
2. Executive Summary
2.1. Microgrid-as-a-Service Market Overview
2.2. Regional Outline
2.3. Industry Outline
2.4. Market Dynamics Snapshot
2.5. Competition Blueprint
3. Market Dynamics
3.1. Macro-economic Factors
3.2. Drivers
3.3. Restraints
3.4. Opportunities
3.5. Key Trends
3.6. Regulatory Scenario
4. Associated Industry and Key Indicator Assessment
4.1. Parent Industry Overview – Global Power Grid Industry Overview
4.2. Supply Chain Analysis
4.3. Insulation Roadmap Analysis
4.4. Industry SWOT Analysis
4.5. Porter Five Forces Analysis
4.6. Covid-19 Impact and Recovery Analysis
5. Microgrid-as-a-Service Market Analysis, by Type
5.1. Microgrid-as-a-Service Market Value (US$ Mn) Analysis & Forecast, by Type, 2017–2031
5.1.1. Islanded Microgrid
5.1.2. Grid Connected Microgrid
5.2. Market Attractiveness Analysis, By Type
6. Microgrid-as-a-Service Market Analysis, by Service
6.1. Microgrid-as-a-Service Market Value (US$ Mn) Analysis & Forecast, by Service, 2017–2031
6.1.1. Monitoring & Optimization
6.1.2. System Maintenance & Operations
6.1.3. Infrastructure Upgradation (Software & Others)
6.1.4. Training
6.1.5. Others
6.2. Market Attractiveness Analysis, By Service
7. Microgrid-as-a-Service Market Analysis, by End-user
7.1. Microgrid-as-a-Service Market Value (US$ Mn) Analysis & Forecast, by End-user, 2017–2031
7.1.1. Government & Utility
7.1.2. Commercial
7.1.3. Industrial
7.1.4. Residential
7.2. Market Attractiveness Analysis, By End-user
8. Microgrid-as-a-Service Market Analysis and Forecast, by Region
8.1. Microgrid-as-a-Service Market Value (US$ Mn) Analysis & Forecast, by Region, 2017–2031
8.1.1. North America
8.1.2. Europe
8.1.3. Asia Pacific
8.1.4. Middle East & Africa
8.1.5. South America
8.2. Market Attractiveness Analysis, By Region
9. North America Microgrid-as-a-Service Market Analysis and Forecast
9.1. Market Snapshot
9.2. Drivers and Restraints: Impact Analysis
9.3. Microgrid-as-a-Service Market Value (US$ Mn) Analysis & Forecast, by Type, 2017–2031
9.3.1. Islanded Microgrid
9.3.2. Grid Connected Microgrid
9.4. Microgrid-as-a-Service Market Value (US$ Mn) Analysis & Forecast, by Service, 2017–2031
9.4.1. Monitoring & Optimization
9.4.2. System Maintenance & Operations
9.4.3. Infrastructure Upgradation (Software & Others)
9.4.4. Training
9.4.5. Others
9.5. Microgrid-as-a-Service Market Value (US$ Mn) Analysis & Forecast, by End-user, 2017–2031
9.5.1. Government & Utility
9.5.2. Commercial
9.5.3. Industrial
9.5.4. Residential
9.6. Microgrid-as-a-Service Value (US$ Mn) Analysis & Forecast, by Country and Sub-region, 2017–2031
9.6.1. U.S.
9.6.2. Canada
9.6.3. Rest of North America
9.7. Market Attractiveness Analysis
9.7.1. By Type
9.7.2. By Service
9.7.3. By End-user
9.7.4. By Country and Sub-region
10. Europe Microgrid-as-a-Service Market Analysis and Forecast
10.1. Market Snapshot
10.2. Drivers and Restraints: Impact Analysis
10.3. Microgrid-as-a-Service Market Value (US$ Mn) Analysis & Forecast, by Type, 2017–2031
10.3.1. Islanded Microgrid
10.3.2. Grid Connected Microgrid
10.4. Microgrid-as-a-Service Market Value (US$ Mn) Analysis & Forecast, by Service, 2017–2031
10.4.1. Monitoring & Optimization
10.4.2. System Maintenance & Operations
10.4.3. Infrastructure Upgradation (Software & Others)
10.4.4. Training
10.4.5. Others
10.5. Microgrid-as-a-Service Market Value (US$ Mn) Analysis & Forecast, by End-user, 2017–2031
10.5.1. Government & Utility
10.5.2. Commercial
10.5.3. Industrial
10.5.4. Residential
10.6. Microgrid-as-a-Service Value (US$ Mn) Analysis & Forecast, by Country and Sub-region, 2017–2031
10.6.1. U.K.
10.6.2. Germany
10.6.3. France
10.6.4. Rest of Europe
10.7. Market Attractiveness Analysis
10.7.1. By Type
10.7.2. By Service
10.7.3. By End-user
10.7.4. By Country and Sub-region
11. Asia Pacific Microgrid-as-a-Service Market Analysis and Forecast
11.1. Market Snapshot
11.2. Drivers and Restraints: Impact Analysis
11.3. Microgrid-as-a-Service Market Value (US$ Mn) Analysis & Forecast, by Type, 2017–2031
11.3.1. Islanded Microgrid
11.3.2. Grid Connected Microgrid
11.4. Microgrid-as-a-Service Market Value (US$ Mn) Analysis & Forecast, by Service, 2017–2031
11.4.1. Monitoring & Optimization
11.4.2. System Maintenance & Operations
11.4.3. Infrastructure Upgradation (Software & Others)
11.4.4. Training
11.4.5. Others
11.5. Microgrid-as-a-Service Market Value (US$ Mn) Analysis & Forecast, by End-user, 2017–2031
11.5.1. Government & Utility
11.5.2. Commercial
11.5.3. Industrial
11.5.4. Residential
11.6. Microgrid-as-a-Service Value (US$ Mn) Analysis & Forecast, by Country and Sub-region, 2017–2031
11.6.1. China
11.6.2. India
11.6.3. Japan
11.6.4. South Korea
11.6.5. ASEAN
11.6.6. Rest of Asia Pacific
11.7. Market Attractiveness Analysis
11.7.1. By Type
11.7.2. By Service
11.7.3. By End-user
11.7.4. By Country and Sub-region
12. Middle East & Africa Microgrid-as-a-Service Market Analysis and Forecast
12.1. Market Snapshot
12.2. Drivers and Restraints: Impact Analysis
12.3. Microgrid-as-a-Service Market Value (US$ Mn) Analysis & Forecast, by Type, 2017–2031
12.3.1. Islanded Microgrid
12.3.2. Grid Connected Microgrid
12.4. Microgrid-as-a-Service Market Value (US$ Mn) Analysis & Forecast, by Service, 2017–2031
12.4.1. Monitoring & Optimization
12.4.2. System Maintenance & Operations
12.4.3. Infrastructure Upgradation (Software & Others)
12.4.4. Training
12.4.5. Others
12.5. Microgrid-as-a-Service Market Value (US$ Mn) Analysis & Forecast, by End-user, 2017–2031
12.5.1. Government & Utility
12.5.2. Commercial
12.5.3. Industrial
12.5.4. Residential
12.6. Microgrid-as-a-Service Value (US$ Mn) Analysis & Forecast, by Country and Sub-region, 2017–2031
12.6.1. GCC
12.6.2. South Africa
12.6.3. Rest of the Middle East & Africa
12.7. Market Attractiveness Analysis
12.7.1. By Type
12.7.2. By Service
12.7.3. By End-user
12.7.4. By Country and Sub-region
13. South America Microgrid-as-a-Service Market Analysis and Forecast
13.1. Market Snapshot
13.2. Drivers and Restraints: Impact Analysis
13.3. Microgrid-as-a-Service Market Value (US$ Mn) Analysis & Forecast, by Type, 2017–2031
13.3.1. Islanded Microgrid
13.3.2. Grid Connected Microgrid
13.4. Microgrid-as-a-Service Market Value (US$ Mn) Analysis & Forecast, by Service, 2017–2031
13.4.1. Monitoring & Optimization
13.4.2. System Maintenance & Operations
13.4.3. Infrastructure Upgradation (Software & Others)
13.4.4. Training
13.4.5. Others
13.5. Microgrid-as-a-Service Market Value (US$ Mn) Analysis & Forecast, by End-user, 2017–2031
13.5.1. Government & Utility
13.5.2. Commercial
13.5.3. Industrial
13.5.4. Residential
13.6. Microgrid-as-a-Service Value (US$ Mn) Analysis & Forecast, by Country and Sub-region, 2017–2031
13.6.1. Brazil
13.6.2. Rest of South America
13.7. Market Attractiveness Analysis
13.7.1. By Type
13.7.2. By Service
13.7.3. By End-user
13.7.4. By Country and Sub-region
14. Competition Assessment
14.1. Global Microgrid-as-a-Service Market Competition Matrix - a Dashboard View
14.1.1. Global Microgrid-as-a-Service Market Company Share Analysis, by Value (2021)
14.1.2. Technological Differentiator
15. Company Profiles (Global Manufacturers/Suppliers)
15.1. ABB
15.1.1. Overview
15.1.2. Product Portfolio
15.1.3. Sales Footprint
15.1.4. Key Subsidiaries or Distributors
15.1.5. Strategy and Recent Developments
15.1.6. Key Financials
15.2. Aggreko
15.2.1. Overview
15.2.2. Product Portfolio
15.2.3. Sales Footprint
15.2.4. Key Subsidiaries or Distributors
15.2.5. Strategy and Recent Developments
15.2.6. Key Financials
15.3. AIO Systems Ltd.
15.3.1. Overview
15.3.2. Product Portfolio
15.3.3. Sales Footprint
15.3.4. Key Subsidiaries or Distributors
15.3.5. Strategy and Recent Developments
15.3.6. Key Financials
15.4. Eaton
15.4.1. Overview
15.4.2. Product Portfolio
15.4.3. Sales Footprint
15.4.4. Key Subsidiaries or Distributors
15.4.5. Strategy and Recent Developments
15.4.6. Key Financials
15.5. ENGIE
15.5.1. Overview
15.5.2. Product Portfolio
15.5.3. Sales Footprint
15.5.4. Key Subsidiaries or Distributors
15.5.5. Strategy and Recent Developments
15.5.6. Key Financials
15.6. General Electric
15.6.1. Overview
15.6.2. Product Portfolio
15.6.3. Sales Footprint
15.6.4. Key Subsidiaries or Distributors
15.6.5. Strategy and Recent Developments
15.6.6. Key Financials
15.7. Green Energy Corp.
15.7.1. Overview
15.7.2. Product Portfolio
15.7.3. Sales Footprint
15.7.4. Key Subsidiaries or Distributors
15.7.5. Strategy and Recent Developments
15.7.6. Key Financials
15.8. Metco Engineering
15.8.1. Overview
15.8.2. Product Portfolio
15.8.3. Sales Footprint
15.8.4. Key Subsidiaries or Distributors
15.8.5. Strategy and Recent Developments
15.8.6. Key Financials
15.9. Schneider Electric
15.9.1. Overview
15.9.2. Product Portfolio
15.9.3. Sales Footprint
15.9.4. Key Subsidiaries or Distributors
15.9.5. Strategy and Recent Developments
15.9.6. Key Financials
15.10. Siemens AG
15.10.1. Overview
15.10.2. Product Portfolio
15.10.3. Sales Footprint
15.10.4. Key Subsidiaries or Distributors
15.10.5. Strategy and Recent Developments
15.10.6. Key Financials
15.11. Spirae, LLC
15.11.1. Overview
15.11.2. Product Portfolio
15.11.3. Sales Footprint
15.11.4. Key Subsidiaries or Distributors
15.11.5. Strategy and Recent Developments
15.11.6. Key Financials
15.12. Tech Mahindra
15.12.1. Overview
15.12.2. Product Portfolio
15.12.3. Sales Footprint
15.12.4. Key Subsidiaries or Distributors
15.12.5. Strategy and Recent Developments
15.12.6. Key Financials
16. Recommendation
16.1. Opportunity Assessment
16.1.1. By Type
16.1.2. By Service
16.1.3. By End-user
16.1.4. By Region
List of Tables
Table 01: Global Microgrid-as-a-Service Market Value (US$ Mn) Forecast, by Type 2017-2031
Table 02: Global Microgrid-as-a-Service Market Value (US$ Mn) Forecast, by Service 2017-2031
Table 03: Global Microgrid-as-a-Service Market Value (US$ Mn) Forecast, by End-user, 2017-2031
Table 04: Microgrid-as-a-Service Market Value (US$ Mn) Forecast, by Region, 2017-2031
Table 05: North America Microgrid-as-a-Service Market Value (US$ Mn) Forecast, by Type, 2017-2031
Table 06: North America Microgrid-as-a-Service Market Value (US$ Mn) Forecast, by Service, 2017-2031
Table 07: North America Microgrid-as-a-Service Market Value (US$ Mn) Forecast, by End-user, 2017-2031
Table 08: North America Microgrid-as-a-Service Market Value (US$ Mn) Forecast, by Country, 2017-2031
Table 09: Europe Microgrid-as-a-Service Market Value (US$ Mn) Forecast, by Type, 2017-2031
Table 10: Europe Microgrid-as-a-Service Market Value (US$ Mn) Forecast, by Service, 2017-2031
Table 11: Europe Microgrid-as-a-Service Market Value (US$ Mn) Forecast, by End-user, 2017-2031
Table 12: Europe Microgrid-as-a-Service Market Value (US$ Mn) Forecast, by Country and Sub-region, 2017-2031
Table 13: Asia Pacific Microgrid-as-a-Service Market Value (US$ Mn) Forecast, by Type, 2017-2031
Table 14: Asia Pacific Microgrid-as-a-Service Market Value (US$ Mn) Forecast, by Service, 2017-2031
Table 15: Asia Pacific Microgrid-as-a-Service Market Value (US$ Mn) Forecast, by End-user, 2017-2031
Table 16: Asia Pacific Microgrid-as-a-Service Market Value (US$ Mn) Forecast, by Country and Sub-region, 2017-2031
Table 17: Middle East & Africa Microgrid-as-a-Service Market Value (US$ Mn) Forecast, by Type, 2017-2031
Table 18: Middle East & Africa Microgrid-as-a-Service Market Value (US$ Mn) Forecast, by Service, 2017-2031
Table 19: Middle East & Africa Microgrid-as-a-Service Market Value (US$ Mn) Forecast, by End-user 2017-2031
Table 20: Middle East & Africa Microgrid-as-a-Service Market Value (US$ Mn) Forecast, by Country and Sub-region, 2017-2031
Table 21: South America Microgrid-as-a-Service Market Value (US$ Mn) Forecast, by Type, 2017-2031
Table 22: South America Microgrid-as-a-Service Market Value (US$ Mn) Forecast, by Service, 2017-2031
Table 23: South America Microgrid-as-a-Service Market Value (US$ Mn) Forecast, by End-user,2017-2031
Table 24: South America Microgrid-as-a-Service Market Value (US$ Mn) Forecast, by Country and Sub-region, 2017-2031
List of Figures
Figure 01: Global Microgrid-as-a-Service Market, Value (US$ Mn), 2017-2031
Figure 02: Global Microgrid-as-a-Service Market, Y-O-Y, 2017-2031
Figure 03: Global Microgrid-as-a-Service Market, Year-on-Year Growth, Global Overview, 2021-2031
Figure 04: Global Microgrid-as-a-Service Market, Year-on-Year Growth, by Type, 2021-2031
Figure 05: Global Microgrid-as-a-Service Market Projections by Type, Value (US$ Mn), 2017-2031
Figure 06: Global Microgrid-as-a-Service Market Share Analysis, by Type, 2021 and 2031
Figure 07: Global Microgrid-as-a-Service Market, Incremental Opportunity, by Type, Value (US$ Mn), 2021-2031
Figure 08: Global Microgrid-as-a-Service Market, Year-on-Year Growth, by Service, 2021-2031
Figure 09: Global Microgrid-as-a-Service Market Projections by Service, Value (US$ Mn), 2017-2031
Figure 10: Global Microgrid-as-a-Service Market Share Analysis, by Service, 2021 and 2031
Figure 11: Global Microgrid-as-a-Service Market, Incremental Opportunity, by Service (US$ Mn), 2021-2031
Figure 12: Global Microgrid-as-a-Service Market, Year-on-Year Growth, by End-user, 2017-2031
Figure 13: Global Microgrid-as-a-Service Market Projections by End-user, Value (US$ Mn), 2017-2031
Figure 14: Global Microgrid-as-a-Service Market Share Analysis, by End-user, 2021 and 2031
Figure 15: Global Microgrid-as-a-Service Market, Incremental Opportunity, by End-user, Value (US$ Mn), 2021-2031
Figure 16: Global Microgrid-as-a-Service Market, Year-on-Year Growth, by Region, 2021-2031
Figure 17: Global Microgrid-as-a-Service Market Projections by Region, Value (US$ Mn), 2017-2031
Figure 18: Global Microgrid-as-a-Service Market Share Analysis, by Region, 2021 and 2031
Figure 19: Global Microgrid-as-a-Service Market, Incremental Opportunity, by Region, Value (US$ Mn), 2021-2031
Figure 20: North America Microgrid-as-a-Service Market, Year-on-Year Growth
Figure 21: North America Microgrid-as-a-Service Market Projections by Type, Value (US$ Mn), 2017-2031
Figure 22: North America Microgrid-as-a-Service Market Share Analysis, by Type, 2021 and 2031
Figure 23: North America Microgrid-as-a-Service Market, Incremental Opportunity, by Type, Value (US$ Mn), 2021-2031
Figure 24: North America Microgrid-as-a-Service Market Projections by Service, Value (US$ Mn), 2017-2031
Figure 25: North America Microgrid-as-a-Service Market Share Analysis, by Service, 2021 and 2031
Figure 26: North America Microgrid-as-a-Service Market, Incremental Opportunity, by Service(US$ Mn), 2021-2031
Figure 27: North America Microgrid-as-a-Service Market Projections by End-user, Value (US$ Mn), 2017-2031
Figure 28: North America Microgrid-as-a-Service Market Share Analysis, by End-user, 2021 and 2031
Figure 29: North America Microgrid-as-a-Service Market, Incremental Opportunity, by End-user, Value (US$ Mn), 2021-2031
Figure 30: North America Microgrid-as-a-Service Market Projections by Country and Sub-region, Value (US$ Mn), 2017-2031
Figure 31: North America Microgrid-as-a-Service Market Share Analysis, by Country and Sub-region, 2021 and 2031
Figure 32: North America Microgrid-as-a-Service Market, Incremental Opportunity, by Country and Sub-region, Value (US$ Mn), 2021-2031
Figure 33: Europe Microgrid-as-a-Service Market, Year-on-Year Growth, 2021-2031
Figure 34: Europe Microgrid-as-a-Service Market Projections by Type, Value (US$ Mn), 2017-2031
Figure 35: Europe Microgrid-as-a-Service Market Share Analysis, by Type, 2021 and 2031
Figure 36: Europe Microgrid-as-a-Service Market, Incremental Opportunity, by Type, Value (US$ Mn), 2021-2031
Figure 37: Europe Microgrid-as-a-Service Market Projections by Service, Value (US$ Mn), 2017-2031
Figure 38: Europe Microgrid-as-a-Service Market Share Analysis, by Service, 2021 and 2031
Figure 39: Europe Microgrid-as-a-Service Market, Incremental Opportunity, by Service(US$ Mn), 2021-2031
Figure 40: Europe Microgrid-as-a-Service Market Projections by End-user, Value (US$ Mn), 2017-2031
Figure 41: Europe Microgrid-as-a-Service Market Share Analysis, by End-user, 2021 and 2031
Figure 42: Europe Microgrid-as-a-Service Market, Incremental Opportunity, by End-user, Value (US$ Mn), 2021-2031
Figure 43: Europe Microgrid-as-a-Service Market Projections by Country and Sub-region, Value (US$ Mn), 2017-2031
Figure 44: Europe Microgrid-as-a-Service Market Share Analysis, by Country and Sub-region, 2021 and 2031
Figure 45: Europe Microgrid-as-a-Service Market, Incremental Opportunity, by Country and Sub-region, Value (US$ Mn), 2021-2031
Figure 46: Asia Pacific Microgrid-as-a-Service Market, Year-on-Year Growth, 2021-2031
Figure 47: Asia Pacific Microgrid-as-a-Service Market Projections by Type, Value (US$ Mn), 2017-2031
Figure 48: Asia Pacific Microgrid-as-a-Service Market Share Analysis, by Type, 2021 and 2031
Figure 49: Asia Pacific Microgrid-as-a-Service Market, Incremental Opportunity, by Type, Value (US$ Mn), 2021-2031
Figure 50: Asia Pacific Microgrid-as-a-Service Market Projections by Service, Value (US$ Mn), 2017-2031
Figure 51: Asia Pacific Microgrid-as-a-Service Market Share Analysis, by Service, 2021 and 2031
Figure 52: Asia Pacific Microgrid-as-a-Service Market, Incremental Opportunity, by Service(US$ Mn), 2021-2031
Figure 53: Asia Pacific Microgrid-as-a-Service Market Projections by End-user, Value (US$ Mn), 2017-2031
Figure 54: Asia Pacific Microgrid-as-a-Service Market Share Analysis, by End-user, 2021 and 2031
Figure 55: Asia Pacific Microgrid-as-a-Service Market, Incremental Opportunity, by End-user, Value (US$ Mn), 2021-2031
Figure 56: Asia Pacific Microgrid-as-a-Service Market Projections by Country and Sub-region, Value (US$ Mn), 2017-2031
Figure 57: Asia Pacific Microgrid-as-a-Service Market Share Analysis, by Country and Sub-region, 2021 and 2031
Figure 58: Asia Pacific Microgrid-as-a-Service Market, Incremental Opportunity, by Country and Sub-region, Value (US$ Mn), 2021-2031
Figure 59: Middle East & Africa Microgrid-as-a-Service Market, Year-on-Year Growth
Figure 60: Middle East & Africa Microgrid-as-a-Service Market Projections by Type, Value (US$ Mn), 2017-2031
Figure 61: Middle East & Africa Microgrid-as-a-Service Market Share Analysis, by Type, 2021 and 2031
Figure 62: Middle East & Africa Microgrid-as-a-Service Market, Incremental Opportunity, by Type, Value (US$ Mn), 2021-2031
Figure 63: Middle East & Africa Microgrid-as-a-Service Market Projections by Service, Value (US$ Mn), 2017-2031
Figure 64: Middle East & Africa Microgrid-as-a-Service Market Share Analysis, by Service, 2021 and 2031
Figure 65: Middle East & Africa Microgrid-as-a-Service Market, Incremental Opportunity, by Service(US$ Mn), 2021-2031
Figure 66: Middle East & Africa Microgrid-as-a-Service Market Projections by End-user, Value (US$ Mn), 2017-2031
Figure 67: Middle East & Africa Microgrid-as-a-Service Market Share Analysis, by End-user, 2021 and 2031
Figure 68: Middle East & Africa Microgrid-as-a-Service Market, Incremental Opportunity, by End-user, Value (US$ Mn), 2021-2031
Figure 69: Middle East & Africa Microgrid-as-a-Service Market Projections by Country and Sub-region, Value (US$ Mn), 2017-2031
Figure 70: Middle East & Africa Microgrid-as-a-Service Market Share Analysis, by Country and Sub-region, 2021 and 2031
Figure 71: Middle East & Africa Microgrid-as-a-Service Market, Incremental Opportunity, by Country and Sub-region, Value (US$ Mn), 2021-2031
Figure 72: South America Microgrid-as-a-Service Market, Year-on-Year Growth
Figure 73: South America Microgrid-as-a-Service Market Projections by Type, Value (US$ Mn), 2017-2031
Figure 74: South America Microgrid-as-a-Service Market Share Analysis, by Type, 2020 and 2031
Figure 75: South America Microgrid-as-a-Service Market, Incremental Opportunity, by Type, Value (US$ Mn), 2021-2031
Figure 76: South America Microgrid-as-a-Service Market Projections by Service, Value (US$ Mn), 2017-2031
Figure 77: South America Microgrid-as-a-Service Market Share Analysis, by Service, 2021 and 2031
Figure 78: South America Microgrid-as-a-Service Market, Incremental Opportunity, by Service(US$ Mn), 2021-2031
Figure 79: South America Microgrid-as-a-Service Market Projections by End-user, Value (US$ Mn), 2017-2031
Figure 80: South America Microgrid-as-a-Service Market Share Analysis, by End-user, 2020 and 2031
Figure 81: South America Microgrid-as-a-Service Market, Incremental Opportunity, by End-user, Value (US$ Mn), 2021-2031
Figure 82: South America Microgrid-as-a-Service Market Projections by Country and Sub-region, Value (US$ Mn), 2017-2031
Figure 83: South America Microgrid-as-a-Service Market Share Analysis, by Country and Sub-region, 2021 and 2031
Figure 84: South America Microgrid-as-a-Service Market, Incremental Opportunity, by Country and Sub-region, Value (US$ Mn), 2021-2031
Copyright © Transparency Market Research, Inc. All Rights reserved
Trust Online

Microgrid-as-a-Service Market