
Reports
Reports
Microencapsulated Pesticides Market -Snapshot
Rising adoption of IPM or integrated pest management particles as well as increasing regulatory support for sustainable approach to restrict extensive agrochemical application are some of the major drivers for the global microencapsulated pesticides market. However, reluctance by farmers about adopting these new and novel techniques as well as high production costs are two of the major restrains for the growth of the global microencapsulated pesticides market in the next few years. Types of products offered by the players and manufacturers in the global microencapsulated pesticides market include herbicides, rodenticides, fungicides, and insecticides.
Products in the global microencapsulated pesticides market are protective coatings with an active liquid or powder substance. These coatings in the global microencapsulated pesticides market can be made up of various materials, including plastic and starch, among others. Products in the global microencapsulated pesticides market are mixed in the water in order to spray them on crops. The rising restrictions and ban on using particular types of harmful chemicals in several regions and nations across the world is also motivating the development of the global microencapsulated pesticides market in coming years.
Increase in the awareness pertaining to availability of microencapsulated pesticides as well as growing instances of pets and insect occurrences may drive the growth in the global microencapsulated pesticides market in the next few years. Players and manufacturers in the global microencapsulated pesticides market are focused on product innovation and green manufacturing and production in a bid to attract more conusmers. Reduction in the usage of toxic chemicals and materials in the production of pesticides is also expected to offer the players and manufacturers with new opportunities to explore organic and non-volatile chemicals and ingredients. This trend is expected to foster the development of the global microencapsulated pesticides market in coming years.
Microencapsulated Pesticides Market – Snapshot
Dry and liquid pesticides encapsulated in small-sized plastic capsules are known as microencapsulated pesticides. The term ‘microencapsulation’ usually refers to capsule size ranging from 1 µm to 1 mm. Microencapsulated pesticides are mixed with water and sprayed. Plastic walls of capsules break on spraying and the pesticide is slowly released. This helps in gradual release of the pesticide. It also avoids loss. Microencapsulated pesticides contain an active agent and surrounded polymeric shell dispersed in polymeric matrix. The technique of microencapsulation involves packing of solid, liquid, or gaseous active ingredients within a protective coating for the purpose of protecting these ingredients from the surrounding environment. Microcapsules offer several benefits such as conversion of liquids into solids, protection of the environment, separation of reactive compounds, and superior material-handling properties.
Based on type, the global microencapsulated pesticides market has been segmented into insecticides, herbicides, fungicides, and rodenticides. Insecticides is a prominent segment of the global market. Insecticides are applied in different formulations such as sprays, gels, or as baits to target insects. They are beneficial in the fields of forestry, public health, and agriculture. The insecticides segment is estimated to expand at a moderate pace during the forecast period. Herbicides is another significant segment of the market. It is expected to expand at a rapid pace during the forecast period. Herbicides are chemicals used on a large scale to kill unwanted vegetation. They are generally utilized to kill or inhibit the growth of weeds. Herbicides limit the growth of weeds that overpower the desired vegetation. Fungicides and rodenticides segments collectively constituted a minimal share of the market in 2017. However, these segments are anticipated to expand at a significant pace during the forecast period.
In terms of crop, the global microencapsulated pesticides market has been divided into cereals & grains, oilseeds & pulses, fruits & vegetables, and turf & ornamental. In terms of both value and volume, the cereals & grains segment accounted for a leading share of the global microencapsulated pesticides market in 2017. The segment is estimated to expand at a significant pace during the forecast period. Cereals and grains are crops cultivated widely across the globe and they are highly affected by pests. Insecticides and herbicides are primarily used for cereals and grains. Fruits & vegetables is another significant segment of the market and it is anticipated to expand at a rapid pace during the forecast period. Fruits and vegetables that require pesticides in high concentrations include peaches, nectarines, cherries, strawberries, grapes, raspberries, pear, apples, potatoes, spinach, bell peppers, and celery. The turf & ornamental segment constituted the minimal share of the market in 2017. However, it is projected to expand at a considerable pace during the forecast period. The turf & ornamental segment comprises decorative plants, cut flowers, and bulbs.
In terms of application, the global microencapsulated pesticides market has been divided into agricultural and non-agricultural. In terms of both revenue and volume, the agricultural segment accounted for a dominant share of the global market in 2017. The segment is estimated to expand rapidly during the forecast period, due to increase in the demand for microencapsulated pesticides, which help reduce the rate of application by 10–15 times compared to traditional formulations such as emulsifiable concentrates and suspension concentrates. The non-agricultural segment constituted a key share of the global microencapsulated pesticides market in 2017. Increase in the trend of forming lawns and gardens is expected to drive the segment during the forecast period.
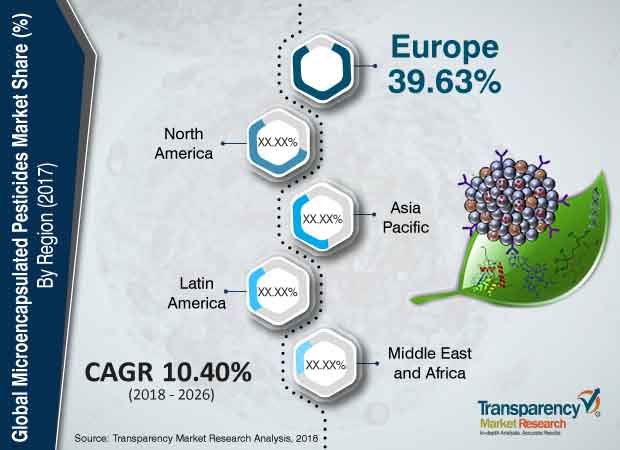
Based on region, the global microencapsulated pesticides market can be classified into North America, Europe, Asia Pacific, Middle East & Africa, and Latin America. In terms of value and volume, Europe was the leading region of the global market in 2017. The region is estimated to continue its dominance during the forecast period also. Increase in favorable government initiatives for integrated pest management practices and rise in awareness about benefits of microencapsulated pesticides in the region are anticipated to drive the demand for these pesticides in Europe in the near future. In terms of consumption, North America and Asia Pacific follow Europe. China and India are expected to be highly lucrative markets for encapsulated pesticides between 2018 and 2026. In terms of demand, Latin America holds a significant share of the global microencapsulated pesticides market. The market in the region is projected to expand at a rapid pace during the forecast period. Middle East & Africa constituted a relatively low share of the global market in 2017.
The global microencapsulated pesticides market is dominated by large-sized players. Presence of several large-sized players makes the market highly competitive. Key players operating in the market are Syngenta, Bayer AG, BASF SE, ADAMA Agricultural Solutions Ltd., and FMC Corporation.
1. Preface
1.1. Market Definition and Scope
1.2. Market Segmentation
1.3. Key Research Objectives
1.4. Research Highlights
2. Assumptions and Research Methodology
3. Executive Summary: Global Microencapsulated Pesticides Market
4. Market Overview
4.1. Introduction
4.2. Key Market Indicators/Definitions
4.3. Market Dynamics
4.3.1. Drivers
4.3.2. Restraints
4.3.3. Opportunities
4.4. Global Microencapsulated Pesticides Market Analysis and Forecast, 2017–2026
4.4.1. Global Microencapsulated Pesticides Market Volume (Tons)
4.4.2. Global Microencapsulated Pesticides Market Value (US$ Mn)
4.5. Porters Five Forces Analysis
4.6. Regulatory Landscape
4.7. Value Chain Analysis
5. Global Microencapsulated Pesticides Market Analysis and Forecast, by Type
5.1. Introduction & Key Findings
5.2. Global Microencapsulated Pesticides Market Volume (Tons) and Value (US$ Mn) Forecast, by Type, 2017–2026
5.2.1. Insecticides
5.2.2. Herbicides
5.2.3. Fungicides
5.2.4. Rodenticides
5.3. Global Microencapsulated Pesticides Market Attractiveness, by Type, 2017
6. Global Microencapsulated Pesticides Market Analysis and Forecast, by Crop
6.1. Introduction & Key Findings
6.2. Global Microencapsulated Pesticides Market Volume (Tons) and Value (US$ Mn) Forecast, by Crop, 2017–2026
6.2.1. Cereals & Grains
6.2.2. Cereals & Grains
6.2.3. Fruits & Vegetables
6.2.4. Turf & Ornamental
6.3. Global Microencapsulated Pesticides Market Attractiveness, by Crop, 2017
7. Global Microencapsulated Pesticides Market Analysis and Forecast, by Application
7.1. Introduction
7.2. Global Microencapsulated Pesticides Market Volume (Tons) and Value (US$ Mn) Forecast, by Application, 2017–2026
7.2.1. Agricultural
7.2.2. Non-agricultural
7.3. Global Microencapsulated Pesticides Market Attractiveness, by Application, 2017
8. Global Microencapsulated Pesticides Market Analysis and Forecast, by Region
8.1. Key Findings
8.2. Global Microencapsulated Pesticides Market Volume (Tons) and Value (US$ Mn) Forecast, by Region, 2017–2026
8.2.1. North America
8.2.1.1. U.S.
8.2.1.2. Canada
8.2.2. Europe
8.2.2.1. Germany
8.2.2.2. U.K.
8.2.2.3. Italy
8.2.2.4. France
8.2.2.5. Spain
8.2.2.6. Turkey
8.2.2.7. Russia & CIS
8.2.2.8. Rest of Europe
8.2.3. Asia Pacific
8.2.3.1. China
8.2.3.2. India
8.2.3.3. Japan
8.2.3.4. ASEAN
8.2.3.5. Rest of Asia Pacific
8.2.4. Latin America
8.2.4.1. Brazil
8.2.4.2. Mexico
8.2.4.3. Rest of Latin America
8.2.5. Middle East & Africa
8.2.5.2. GCC
8.2.5.3. South Africa
8.2.5.4. Rest of Middle East & Africa
8.3. Global Microencapsulated Pesticides Market Attractiveness, by Region, 2017
9. North America Microencapsulated Pesticides Market Analysis and Forecast
9.1. Key Findings
9.2. North America Microencapsulated Pesticides Market Forecast, by Type, 2017–2026
9.3. North America Microencapsulated Pesticides Market Forecast, by Crop, 2017–2026
9.4. North America Microencapsulated Pesticides Market Forecast, by Application, 2017–2026
9.5. North America Microencapsulated Pesticides Market Forecast, by Country, 2017–2026
9.5.1. U.S. Microencapsulated Pesticides Market Volume (Tons) and Value (US$ Mn) Forecast, by Type, 2017–2026
9.5.2. U.S. Microencapsulated Pesticides Market Volume (Tons) and Value (US$ Mn) Forecast, by Crop, 2017–2026
9.5.3. U.S. Microencapsulated Pesticides Market Volume (Tons) and Value (US$ Mn) Forecast, by Application, 2017–2026
9.5.4. Canada Microencapsulated Pesticides Market Volume (Tons) and Value (US$ Mn) Forecast, by Type, 2017–2026
9.5.5. Canada Microencapsulated Pesticides Market Volume (Tons) and Value (US$ Mn) Forecast, by Crop, 2017–2026
9.5.6. Canada Microencapsulated Pesticides Market Volume (Tons) and Value (US$ Mn) Forecast, by Application, 2017–2026
9.6. North America Microencapsulated Pesticides Market Attractiveness Analysis, 2017
10. Europe Microencapsulated Pesticides Market Analysis and Forecast
10.1. Key Findings
10.2. Europe Microencapsulated Pesticides Market Forecast, by Type, 2017–2026
10.3. Europe Microencapsulated Pesticides Market Forecast, by Crop, 2017–2026
10.4. Europe Microencapsulated Pesticides Market Forecast, by Application, 2017–2026
10.5. Europe Microencapsulated Pesticides Market Forecast, by Country and Sub-region, 2017–2026
10.5.1. Germany Microencapsulated Pesticides Market Volume (Tons) and Value (US$ Mn) Forecast, by Type, 2017–2026
10.5.2. Germany Microencapsulated Pesticides Market Volume (Tons) and Value (US$ Mn) Forecast, by Crop, 2017–2026
10.5.3. Germany Microencapsulated Pesticides Market Volume (Tons) and Value (US$ Mn) Forecast, by Application, 2017–2026
10.5.5. U.K. Microencapsulated Pesticides Market Volume (Tons) and Value (US$ Mn) Forecast, by Type, 2017–2026
10.5.5. U.K. Microencapsulated Pesticides Market Volume (Tons) and Value (US$ Mn) Forecast, by Crop, 2017–2026
10.5.6. U.K. Microencapsulated Pesticides Market Volume (Tons) and Value (US$ Mn) Forecast, by Application, 2017–2026
10.5.7. France Microencapsulated Pesticides Market Volume (Tons) and Value (US$ Mn) Forecast, by Type, 2017–2026
10.5.8. France Microencapsulated Pesticides Market Volume (Tons) and Value (US$ Mn) Forecast, by Crop, 2017–2026
10.5.9. France Microencapsulated Pesticides Market Volume (Tons) and Value (US$ Mn) Forecast, by Application, 2017–2026
10.5.10. Italy Microencapsulated Pesticides Market Volume (Tons) and Value (US$ Mn) Forecast, by Type, 2017–2026
10.5.11. Italy Microencapsulated Pesticides Market Volume (Tons) and Value (US$ Mn) Forecast, by Crop, 2017–2026
10.5.12. Italy Microencapsulated Pesticides Market Volume (Tons) and Value (US$ Mn) Forecast, by Application, 2017–2026
10.5.13. Spain Microencapsulated Pesticides Market Volume (Tons) and Value (US$ Mn) Forecast, by Type, 2017–2026
10.5.14. Spain Microencapsulated Pesticides Market Volume (Tons) and Value (US$ Mn) Forecast, by Crop, 2017–2026
10.5.15. Spain Microencapsulated Pesticides Market Volume (Tons) and Value (US$ Mn) Forecast, by Application, 2017–2026
10.5.16. Russia & CIS Microencapsulated Pesticides Market Volume (Tons) and Value (US$ Mn) Forecast, by Type, 2017–2026
10.5.17. Russia & CIS Microencapsulated Pesticides Market Volume (Tons) and Value (US$ Mn) Forecast, by Crop, 2017–2026
10.5.18. Russia & CIS Microencapsulated Pesticides Market Volume (Tons) and Value (US$ Mn) Forecast, by Application, 2017–2026
10.5.19. Rest of Europe Microencapsulated Pesticides Market Volume (Tons) and Value (US$ Mn) Forecast, by Type, 2017–2026
10.5.20. Rest of Europe Microencapsulated Pesticides Market Volume (Tons) and Value (US$ Mn) Forecast, by Crop, 2017–2026
10.5.21. Rest of Europe Microencapsulated Pesticides Market Volume (Tons) and Value (US$ Mn) Forecast, by Application, 2017–2026
10.6. Europe Microencapsulated Pesticides Market Attractiveness Analysis, 2017
11. Asia Pacific Microencapsulated Pesticides Market Analysis and Forecast
11.1. Key Findings
11.2. Asia Pacific Microencapsulated Pesticides Market Forecast, by Type, 2017–2026
11.3. Asia Pacific Microencapsulated Pesticides Market Forecast, by Crop, 2017–2026
11.4. Asia Pacific Microencapsulated Pesticides Market Forecast, by Application, 2017–2026
11.5. Asia Pacific Microencapsulated Pesticides Market Forecast, by Country and Sub-region, 2017–2026
11.5.1. China Microencapsulated Pesticides Market Volume (Tons) and Value (US$ Mn) Forecast, by Type, 2017–2026
11.5.2. China Microencapsulated Pesticides Market Volume (Tons) and Value (US$ Mn) Forecast, by Crop, 2017–2026
11.5.3. China Microencapsulated Pesticides Market Volume (Tons) and Value (US$ Mn) Forecast, by Application, 2017–2026
11.5.4. Japan Microencapsulated Pesticides Market Volume (Tons) and Value (US$ Mn) Forecast, by Type, 2017–2026
11.5.5. Japan Microencapsulated Pesticides Market Volume (Tons) and Value (US$ Mn) Forecast, by Crop, 2017–2026
11.5.6. Japan Microencapsulated Pesticides Market Volume (Tons) and Value (US$ Mn) Forecast, by Application, 2017–2026
11.5.7. India Microencapsulated Pesticides Market Volume (Tons) and Value (US$ Mn) Forecast, by Type, 2017–2026
11.5.8. India Microencapsulated Pesticides Market Volume (Tons) and Value (US$ Mn) Forecast, by Crop, 2017–2026
11.5.9. India Microencapsulated Pesticides Market Volume (Tons) and Value (US$ Mn) Forecast, by Application, 2017–2026
11.5.10. ASEAN Microencapsulated Pesticides Market Volume (Tons) and Value (US$ Mn) Forecast, by Type, 2017–2026
11.5.11. ASEAN Microencapsulated Pesticides Market Volume (Tons) and Value (US$ Mn) Forecast, by Crop, 2017–2026
11.5.12. ASEAN Microencapsulated Pesticides Market Volume (Tons) and Value (US$ Mn) Forecast, by Application, 2017–2026
11.5.13. Rest of Asia Pacific Microencapsulated Pesticides Market Volume (Tons) and Value (US$ Mn) Forecast, by Type, 2017–2026
11.5.14. Rest of Asia Pacific Microencapsulated Pesticides Market Volume (Tons) and Value (US$ Mn) Forecast, by Crop, 2017–2026
11.5.15. Rest of Asia Pacific Microencapsulated Pesticides Market Volume (Tons) and Value (US$ Mn) Forecast, by Application, 2017–2026
11.6. Asia Pacific Microencapsulated Pesticides Market Attractiveness Analysis, 2017
12. Latin America Microencapsulated Pesticides Market Analysis and Forecast
12.1. Key Findings
12.2. Latin America Microencapsulated Pesticides Market Forecast, by Type, 2017–2026
12.3. Latin America Microencapsulated Pesticides Market Forecast, by Crop, 2017–2026
12.4. Latin America Microencapsulated Pesticides Market Forecast, by Application, 2017–2026
12.5. Latin America Microencapsulated Pesticides Market Forecast, by Country and Sub-region, 2017–2026
12.5.1. Brazil Microencapsulated Pesticides Market Volume (Tons) and Value (US$ Mn) Forecast, by Type, 2017–2026
12.5.2. Brazil Microencapsulated Pesticides Market Volume (Tons) and Value (US$ Mn) Forecast, by Crop, 2017–2026
12.5.3. Brazil Microencapsulated Pesticides Market Volume (Tons) and Value (US$ Mn) Forecast, by Application, 2017–2026
12.5.4. Mexico Microencapsulated Pesticides Market Volume (Tons) and Value (US$ Mn) Forecast, by Type, 2017–2026
12.5.5. Mexico Microencapsulated Pesticides Market Volume (Tons) and Value (US$ Mn) Forecast, by Crop, 2017–2026
12.5.6. Mexico Microencapsulated Pesticides Market Volume (Tons) and Value (US$ Mn) Forecast, by Application, 2017–2026
12.5.7. Rest of Latin America Microencapsulated Pesticides Market Volume (Tons) and Value (US$ Mn) Forecast, by Type, 2017–2026
12.5.8. Rest of Latin America Microencapsulated Pesticides Market Volume (Tons) and Value (US$ Mn) Forecast, by Crop, 2017–2026
12.5.9. Rest of Latin America Microencapsulated Pesticides Market Volume (Tons) and Value (US$ Mn) Forecast, by Application, 2017–2026
12.6. Latin America Microencapsulated Pesticides Market Attractiveness Analysis, 2017
13. Middle East & Africa Microencapsulated Pesticides Market Analysis and Forecast
13.1. Key Findings
13.2. Middle East & Africa Microencapsulated Pesticides Market Forecast, by Type, 2017–2026
13.3. Middle East & Africa Microencapsulated Pesticides Market Forecast, by Crop, 2017–2026
13.4. Middle East & Africa Microencapsulated Pesticides Market Forecast, by Application, 2017–2026
13.5. Middle East & Africa Microencapsulated Pesticides Market Forecast, by Country and Sub-region, 2017–2026
13.5.1. South Africa Microencapsulated Pesticides Market Volume (Tons) and Value (US$ Mn) Forecast, by Type, 2017–2026
13.5.2. South Africa Microencapsulated Pesticides Market Volume (Tons) and Value (US$ Mn) Forecast, by Crop, 2017–2026
13.5.3. South Africa Microencapsulated Pesticides Market Volume (Tons) and Value (US$ Mn) Forecast, by Application, 2017–2026
13.5.4. GCC Microencapsulated Pesticides Market Volume (Tons) and Value (US$ Mn) Forecast, by Type, 2017–2026
13.5.5. GCC Microencapsulated Pesticides Market Volume (Tons) and Value (US$ Mn) Forecast, by Crop, 2017–2026
13.5.6. GCC Microencapsulated Pesticides Market Volume (Tons) and Value (US$ Mn) Forecast, by Application, 2017–2026
13.5.7. Rest of Middle East & Africa Microencapsulated Pesticides Market Volume (Tons) and Value (US$ Mn) Forecast, by Type, 2017–2026
13.5.8. Rest of Middle East & Africa Microencapsulated Pesticides Market Volume (Tons) and Value (US$ Mn) Forecast, by Crop, 2017–2026
13.5.9. Rest of Middle East & Africa Microencapsulated Pesticides Market Volume (Tons) and Value (US$ Mn) Forecast, by Application, 2017–2026
13.6. Middle East & Africa Microencapsulated Pesticides Market Attractiveness Analysis, 2017
14. Competition Landscape
14.1. Global Microencapsulated Pesticides Market Share Analysis, by Company, 2017
14.2. Company Profiles
14.2.1. Syngenta
14.2.2. Bayer AG
14.2.3. BASF SE
14.2.4. FMC Corporation
14.2.5. ADAMA Agricultural Solutions Ltd.
14.2.6. McLaughlin Gormley King Company
14.2.7. Reed Pacific Pty
14.2.8. Aristo Biotech
List of Tables
Table 1: Global Microencapsulated Pesticides Market Volume (Tons) Forecast, by Type, 2017–2026
Table 2: Global Microencapsulated Pesticides Market Value (US$ Mn) Forecast, by Type, 2017–2026
Table 3: Global Microencapsulated Pesticides Market Volume (Tons) Forecast, by Crop, 2017–2026
Table 4: Global Microencapsulated Pesticides Market Value (US$ Mn) Forecast, by Crop, 2017–2026
Table 5: Global Microencapsulated Pesticides Market Volume (Tons) Forecast, by Application, 2017–2026
Table 6: Global Microencapsulated Pesticides Market Value (US$ Mn) Forecast, by Application, 2017–2026
Table 7: Global Microencapsulated Pesticides Market Volume (Tons) Forecast, by Region, 2017–2026
Table 8: Global Microencapsulated Pesticides Market Value (US$ Mn) Forecast, by Region, 2017–2026
Table 9: North America Microencapsulated Pesticides Market Volume (Tons) Forecast, by Type, 2017–2026
Table 10: North America Microencapsulated Pesticides Market Value (US$ Mn) Forecast, by Type, 2017–2026
Table 11: North America Microencapsulated Pesticides Market Volume (Tons) Forecast, by Crop, 2017–2026
Table 12: North America Microencapsulated Pesticides Market Value (US$ Mn) Forecast, by Crop, 2017–2026
Table 13: North America Microencapsulated Pesticides Market Volume (Tons) Forecast, by Application, 2017–2026
Table 14: North America Microencapsulated Pesticides Market Value (US$ Mn) Forecast, by Application, 2017–2026
Table 15: North America Microencapsulated Pesticides Market Volume (Tons) Forecast, by Country, 2017–2026
Table 16: North America Microencapsulated Pesticides Market Value (US$ Mn) Forecast, by Country, 2017–2026
Table 17: U.S. Microencapsulated Pesticides Market Volume (Tons) Forecast, by Type, 2017–2026
Table 18: U.S. Microencapsulated Pesticides Market Value (US$ Mn) Forecast, by Type, 2017–2026
Table 19: U.S. Microencapsulated Pesticides Market Volume (Tons) Forecast, by Crop, 2017–2026
Table 20: U.S. Microencapsulated Pesticides Market Value (US$ Mn) Forecast, by Crop, 2017–2026
Table 21: U.S. Microencapsulated Pesticides Market Volume (Tons) Forecast, by Application, 2017–2026
Table 22: U.S. Microencapsulated Pesticides Market Value (US$ Mn) Forecast, by Application, 2017–2026
Table 23: Canada Microencapsulated Pesticides Market Volume (Tons) Forecast, by Type, 2017–2026
Table 24: Canada Microencapsulated Pesticides Market Value (US$ Mn) Forecast, by Type, 2017–2026
Table 25: Canada Microencapsulated Pesticides Market Volume (Tons) Forecast, by Crop, 2017–2026
Table 26: Canada Microencapsulated Pesticides Market Value (US$ Mn) Forecast, by Crop, 2017–2026
Table 27: Canada Microencapsulated Pesticides Market Volume (Tons) Forecast, by Application, 2017–2026
Table 28: Canada Microencapsulated Pesticides Market Value (US$ Mn) Forecast, by Application, 2017–2026
Table 29: Europe Microencapsulated Pesticides Market Volume (Tons) Forecast, by Type, 2017–2026
Table 30: Europe Microencapsulated Pesticides Market Value (US$ Mn) Forecast, by Type, 2017–2026
Table 31: Europe Microencapsulated Pesticides Market Volume (Tons) Forecast, by Crop, 2017–2026
Table 32: Europe Microencapsulated Pesticides Market Value (US$ Mn) Forecast, by Crop, 2017–2026
Table 33: Europe Microencapsulated Pesticides Market Volume (Tons) Forecast, by Application, 2017–2026
Table 34: Europe Microencapsulated Pesticides Market Value (US$ Mn) Forecast, by Application, 2017–2026
Table 35: Europe Microencapsulated Pesticides Market Volume (Tons) Forecast, by Country and Sub-region, 2017–2026
Table 36: Europe Microencapsulated Pesticides Market Value (US$ Mn) Forecast, by Country and Sub-region, 2017–2026
Table 37: Germany Microencapsulated Pesticides Market volume (Tons) Forecast, by Type, 2017–2026
Table 38: Germany Microencapsulated Pesticides Market Value (US$ Mn) Forecast, by Type, 2017–2026
Table 39: Germany Microencapsulated Pesticides Market Volume (Tons) Forecast, by Crop, 2017–2026
Table 40: Germany Microencapsulated Pesticides Market Value (US$ Mn) Forecast, by Crop, 2017–2026
Table 41: Germany Microencapsulated Pesticides Market Volume (Tons) Forecast, by Application, 2017–2026
Table 42: Germany Microencapsulated Pesticides Market Value (US$ Mn) Forecast, by Application, 2017–2026
Table 43: U.K. Microencapsulated Pesticides Market Volume (Tons) Forecast, by Type, 2017–2026
Table 44: U.K. Microencapsulated Pesticides Market Value (US$ Mn) Forecast, by Type, 2017–2026
Table 45: U.K. Microencapsulated Pesticides Market Value (Tons) Forecast, by Crop, 2017–2026
Table 46: U.K. Microencapsulated Pesticides Market Value (US$ Mn) Forecast, by Crop, 2017–2026
Table 47: U.K. Microencapsulated Pesticides Market Volume (Tons) Forecast, by Application, 2017–2026
Table 48: U.K. Microencapsulated Pesticides Market Value (US$ Mn) Forecast, by Application, 2017–2026
Table 49: France Microencapsulated Pesticides Market Volume (Tons) Forecast, by Type, 2017–2026
Table 50: France Microencapsulated Pesticides Market Value (US$ Mn) Forecast, by Type, 2017–2026
Table 51: France Microencapsulated Pesticides Market Volume (Tons) Forecast, by Crop, 2017–2026
Table 52: France Microencapsulated Pesticides Market Value (US$ Mn) Forecast, by Crop, 2017–2026
Table 53: France Microencapsulated Pesticides Market Volume (Tons) Forecast, by Application, 2017–2026
Table 54: France Microencapsulated Pesticides Market Value (US$ Mn) Forecast, by Application, 2017–2026
Table 55: Spain Microencapsulated Pesticides Market Volume (Tons) Forecast, by Type, 2017–2026
Table 56: Spain Microencapsulated Pesticides Market Value (US$ Mn) Forecast, by Type, 2017–2026
Table 57: Spain Microencapsulated Pesticides Market Volume (Tons) Forecast, by Crop, 2017–2026
Table 58: Spain Microencapsulated Pesticides Market Value (US$ Mn) Forecast, by Crop, 2017–2026
Table 59: Spain Microencapsulated Pesticides Market Volume (Tons) Forecast, by Application, 2017–2026
Table 60: Spain Microencapsulated Pesticides Market Value (US$ Mn) Forecast, by Application, 2017–2026
Table 61: Italy Microencapsulated Pesticides Market Volume (Tons) Forecast, by Type, 2017–2026
Table 62: Italy Microencapsulated Pesticides Market Value (US$ Mn) Forecast, by Type, 2017–2026
Table 63: Italy Microencapsulated Pesticides Market Volume (Tons) Forecast, by Crop, 2017–2026
Table 64: Italy Microencapsulated Pesticides Market Value (US$ Mn) Forecast, by Crop, 2017–2026
Table 65: Italy Microencapsulated Pesticides Market Volume (Tons) Forecast, by Application, 2017–2026
Table 66: Italy Microencapsulated Pesticides Market Value (US$ Mn) Forecast, by Application, 2017–2026
Table 67: Russia & CIS Microencapsulated Pesticides Market Volume (Tons) Forecast, by Type, 2017–2026
Table 68: Russia & CIS Microencapsulated Pesticides Market Value (US$ Mn) Forecast, by Type, 2017–2026
Table 69: Russia & CIS Microencapsulated Pesticides Market Value (US$ Mn) Forecast, by Crop, 2017–2026
Table 70: Russia & CIS Microencapsulated Pesticides Market Value (US$ Mn) Forecast, by Crop, 2017–2026
Table 71: Russia & CIS Microencapsulated Pesticides Market Value (US$ Mn) Forecast, by Application, 2017–2026
Table 72: Russia & CIS Microencapsulated Pesticides Market Value (US$ Mn) Forecast, by Application, 2017–2026
Table 73: Rest of Europe Microencapsulated Pesticides Market Volume (Tons) Forecast, by Type, 2017–2026
Table 74: Rest of Europe Microencapsulated Pesticides Market Value (US$ Mn) Forecast, by Type, 2017–2026
Table 75: Rest of Europe Microencapsulated Pesticides Market Value (US$ Mn) Forecast, by Crop, 2017–2026
Table 76: Rest of Europe Microencapsulated Pesticides Market Value (US$ Mn) Forecast, by Crop, 2017–2026
Table 77: Rest of Europe Microencapsulated Pesticides Market Value (US$ Mn) Forecast, by Application, 2017–2026
Table 78: Rest of Europe Microencapsulated Pesticides Market Value (US$ Mn) Forecast, by Application, 2017–2026
Table 79: Asia Pacific Microencapsulated Pesticides Market Volume (Tons) Forecast, by Type, 2017–2026
Table 80: Asia Pacific Microencapsulated Pesticides Market Value (US$ Mn) Forecast, by Type, 2017–2026
Table 81: Asia Pacific Microencapsulated Pesticides Market Volume (Tons) Forecast, by Crop, 2017–2026
Table 82: Asia Pacific Microencapsulated Pesticides Market Value (US$ Mn) Forecast, by Crop, 2017–2026
Table 83: Asia Pacific Microencapsulated Pesticides Market Volume (Tons) Forecast, by Application, 2017–2026
Table 84: Asia Pacific Microencapsulated Pesticides Market Value (US$ Mn) Forecast, by Application, 2017–2026
Table 85: Asia Pacific Microencapsulated Pesticides Market Volume (Tons) Forecast, by Country and Sub-region, 2017–2026
Table 86: Asia Pacific Microencapsulated Pesticides Market Value (US$ Mn) Forecast, by Country and Sub-region, 2017–2026
Table 87: China Microencapsulated Pesticides Market volume (Tons) Forecast, by Type, 2017–2026
Table 88: China Microencapsulated Pesticides Market Value (US$ Mn) Forecast, by Type, 2017–2026
Table 89: China Microencapsulated Pesticides Market Volume (Tons) Forecast, by Crop, 2017–2026
Table 90: China Microencapsulated Pesticides Market Value (US$ Mn) Forecast, by Crop, 2017–2026
Table 91: China Microencapsulated Pesticides Market Volume (Tons) Forecast, by Application, 2017–2026
Table 92: China Microencapsulated Pesticides Market Value (US$ Mn) Forecast, by Application, 2017–2026
Table 93: Japan Microencapsulated Pesticides Market Volume (Tons) Forecast, by Type, 2017–2026
Table 94: Japan Microencapsulated Pesticides Market Value (US$ Mn) Forecast, by Type, 2017–2026
Table 95: Japan Microencapsulated Pesticides Market Value (Tons) Forecast, by Crop, 2017–2026
Table 96: Japan Microencapsulated Pesticides Market Value (US$ Mn) Forecast, by Crop, 2017–2026
Table 97: Japan Microencapsulated Pesticides Market Volume (Tons) Forecast, by Application, 2017–2026
Table 98: Japan Microencapsulated Pesticides Market Value (US$ Mn) Forecast, by Application, 2017–2026
Table 99: India Microencapsulated Pesticides Market Volume (Tons) Forecast, by Type, 2017–2026
Table 100: India Microencapsulated Pesticides Market Value (US$ Mn) Forecast, by Type, 2017–2026
Table 101: India Microencapsulated Pesticides Market Volume (Tons) Forecast, by Crop, 2017–2026
Table 102: India Microencapsulated Pesticides Market Value (US$ Mn) Forecast, by Crop, 2017–2026
Table 103: India Microencapsulated Pesticides Market Volume (Tons) Forecast, by Application, 2017–2026
Table 104: India Microencapsulated Pesticides Market Value (US$ Mn) Forecast, by Application, 2017–2026
Table 105: ASEAN Microencapsulated Pesticides Market Volume (Tons) Forecast, by Type, 2017–2026
Table 106: ASEAN Microencapsulated Pesticides Market Value (US$ Mn) Forecast, by Type, 2017–2026
Table 107: ASEAN Microencapsulated Pesticides Market Volume (Tons) Forecast, by Crop, 2017–2026
Table 108: ASEAN Microencapsulated Pesticides Market Value (US$ Mn) Forecast, by Crop, 2017–2026
Table 109: ASEAN Microencapsulated Pesticides Market Volume (Tons) Forecast, by Application, 2017–2026
Table 110: ASEAN Microencapsulated Pesticides Market Value (US$ Mn) Forecast, by Application, 2017–2026
Table 111: Rest of Asia Pacific Microencapsulated Pesticides Market Volume (Tons) Forecast, by Type, 2017–2026
Table 112: Rest of Asia Pacific Microencapsulated Pesticides Market Value (US$ Mn) Forecast, by Type, 2017–2026
Table 113: Rest of Asia Pacific Microencapsulated Pesticides Market Volume (Tons) Forecast, by Crop, 2017–2026
Table 114: Rest of Asia Pacific Microencapsulated Pesticides Market Value (US$ Mn) Forecast, by Crop, 2017–2026
Table 115: Rest of Asia Pacific Microencapsulated Pesticides Market Volume (Tons) Forecast, by Application, 2017–2026
Table 116: Rest of Asia Pacific Microencapsulated Pesticides Market Value (US$ Mn) Forecast, by Application, 2017–2026
Table 117: Latin America Microencapsulated Pesticides Market Volume (Tons) Forecast, by Type, 2017–2026
Table 118: Latin America Microencapsulated Pesticides Market Value (US$ Mn) Forecast, by Type, 2017–2026
Table 119: Latin America Microencapsulated Pesticides Market Volume (Tons) Forecast, by Crop, 2017–2026
Table 120: Latin America Microencapsulated Pesticides Market Value (US$ Mn) Forecast, by Crop, 2017–2026
Table 121: Latin America Microencapsulated Pesticides Market Volume (Tons) Forecast, by Application, 2017–2026
Table 122: Latin America Microencapsulated Pesticides Market Value (US$ Mn) Forecast, by Application, 2017–2026
Table 123: Latin America Microencapsulated Pesticides Market Volume (Tons) Forecast, by Country and Sub-region, 2017–2026
Table 124: Latin America Microencapsulated Pesticides Market Value (US$ Mn) Forecast, by Country and Sub-region, 2017–2026
Table 125: Brazil Microencapsulated Pesticides Market volume (Tons) Forecast, by Type, 2017–2026
Table 126: Brazil Microencapsulated Pesticides Market Value (US$ Mn) Forecast, by Type, 2017–2026
Table 127: Brazil Microencapsulated Pesticides Market Volume (Tons) Forecast, by Crop, 2017–2026
Table 128: Brazil Microencapsulated Pesticides Market Value (US$ Mn) Forecast, by Crop, 2017–2026
Table 129: Brazil Microencapsulated Pesticides Market Volume (Tons) Forecast, by Application, 2017–2026
Table 130: Brazil Microencapsulated Pesticides Market Value (US$ Mn) Forecast, by Application, 2017–2026
Table 131: Mexico Microencapsulated Pesticides Market Volume (Tons) Forecast, by Type, 2017–2026
Table 132: Mexico Microencapsulated Pesticides Market Value (US$ Mn) Forecast, by Type, 2017–2026
Table 133: Mexico Microencapsulated Pesticides Market Value (Tons) Forecast, by Crop, 2017–2026
Table 134: Mexico Microencapsulated Pesticides Market Value (US$ Mn) Forecast, by Crop, 2017–2026
Table 135: Mexico Microencapsulated Pesticides Market Volume (Tons) Forecast, by Application, 2017–2026
Table 136: Mexico Microencapsulated Pesticides Market Value (US$ Mn) Forecast, by Application, 2017–2026
Table 137: Rest of Latin America Microencapsulated Pesticides Market Volume (Tons) Forecast, by Type, 2017–2026
Table 138: Rest of Latin America Microencapsulated Pesticides Market Value (US$ Mn) Forecast, by Type, 2017–2026
Table 139: Rest of Latin America Microencapsulated Pesticides Market Volume (Tons) Forecast, by Crop, 2017–2026
Table 140: Rest of Latin America Microencapsulated Pesticides Market Value (US$ Mn) Forecast, by Crop, 2017–2026
Table 141: Rest of Latin America Microencapsulated Pesticides Market Volume (Tons) Forecast, by Application, 2017–2026
Table 142: Rest of Latin America Microencapsulated Pesticides Market Value (US$ Mn) Forecast, by Application, 2017–2026
Table 143: Middle East & Africa Microencapsulated Pesticides Market Volume (Tons) Forecast, by Type, 2017–2026
Table 144: Middle East & Africa Microencapsulated Pesticides Market Value (US$ Mn) Forecast, by Type, 2017–2026
Table 145: Middle East & Africa Microencapsulated Pesticides Market Volume (Tons) Forecast, by Crop, 2017–2026
Table 146: Middle East & Africa Microencapsulated Pesticides Market Value (US$ Mn) Forecast, by Crop, 2017–2026
Table 147: Middle East & Africa Microencapsulated Pesticides Market Volume (Tons) Forecast, by Application, 2017–2026
Table 148: Middle East & Africa Microencapsulated Pesticides Market Value (US$ Mn) Forecast, by Application, 2017–2026
Table 149: Middle East & Africa Microencapsulated Pesticides Market Volume (Tons) Forecast, by Country and Sub-region, 2017–2026
Table 150: Middle East & Africa Microencapsulated Pesticides Market Value (US$ Mn) Forecast, by Country and Sub-region, 2017–2026
Table 151: GCC Microencapsulated Pesticides Market Volume (Tons) Forecast, by Type, 2017–2026
Table 152: GCC Microencapsulated Pesticides Market Value (US$ Mn) Forecast, by Type, 2017–2026
Table 153: GCC Microencapsulated Pesticides Market Value (Tons) Forecast, by Crop, 2017–2026
Table 154: GCC Microencapsulated Pesticides Market Value (US$ Mn) Forecast, by Crop, 2017–2026
Table 155: GCC Microencapsulated Pesticides Market Volume (Tons) Forecast, by Application, 2017–2026
Table 156: GCC Microencapsulated Pesticides Market Value (US$ Mn) Forecast, by Application, 2017–2026
Table 157: South Africa Microencapsulated Pesticides Market Volume (Tons) Forecast, by Type, 2017–2026
Table 158: South Africa Microencapsulated Pesticides Market Value (US$ Mn) Forecast, by Type, 2017–2026
Table 159: South Africa Microencapsulated Pesticides Market Volume (Tons) Forecast, by Crop, 2017–2026
Table 160: South Africa Microencapsulated Pesticides Market Value (US$ Mn) Forecast, by Crop, 2017–2026
Table 161: South Africa Microencapsulated Pesticides Market Volume (Tons) Forecast, by Application, 2017–2026
Table 162: South Africa Microencapsulated Pesticides Market Value (US$ Mn) Forecast, by Application, 2017–2026
Table 163: Rest of Middle East & Africa Microencapsulated Pesticides Market Volume (Tons) Forecast, by Type, 2017–2026
Table 164: Rest of Middle East & Africa Microencapsulated Pesticides Market Value (US$ Mn) Forecast, by Type, 2017–2026
Table 165: Rest of Middle East & Africa Microencapsulated Pesticides Market Volume (Tons) Forecast, by Crop, 2017–2026
Table 166: Rest of Middle East & Africa Microencapsulated Pesticides Market Value (US$ Mn) Forecast, by Crop, 2017–2026
Table 167: Rest of Middle East & Africa Microencapsulated Pesticides Market Volume (Tons) Forecast, by Application, 2017–2026
Table 168: Rest of Middle East & Africa Microencapsulated Pesticides Market Value (US$ Mn) Forecast, by Application, 2017–2026
List of Figures
Figure 1: Global Microencapsulated Pesticides Market Volume (Tons) and Value (US$ Mn) Forecast, 2018–2026
Figure 2: Global Microencapsulated Pesticides Market Value Share Analysis, by Type, 2017 and 2026
Figure 3: Global Microencapsulated Pesticides Market Attractiveness Analysis, by Type, 2017
Figure 4: Global Microencapsulated Pesticides Market Value Share, by Crop, 2017 and 2026
Figure 5: Global Microencapsulated Pesticides Market Attractiveness, by Crop, 2017
Figure 6: Global Microencapsulated Pesticides Market Value Share, by Application, 2017 and 2026
Figure 7: Global Microencapsulated Pesticides Market Attractiveness, by Application, 2017
Figure 8: Global Microencapsulated Pesticides Market Value Share, by Region, 2017 and 2026
Figure 9: Global Microencapsulated Pesticides Market Attractiveness, by Region, 2017
Figure 10: North America Microencapsulated Pesticides Market Volume (Tons) and Value (US$ Mn) Forecast, 2017–2026
Figure 11: North America Microencapsulated Pesticides Market Attractiveness, by Country, 2017
Figure 12: North America Microencapsulated Pesticides Market Value Share, by Type, 2017 and 2026
Figure 13: North America Microencapsulated Pesticides Market Value Share, by Crop, 2017 and 2026
Figure 14: North America Microencapsulated Pesticides Market Value Share, by Application, 2017 and 2026
Figure 15: North America Microencapsulated Pesticides Market Value Share, by Country, 2017 and 2026
Figure 16: North America Microencapsulated Pesticides Market Attractiveness, by Type, 2017
Figure 17: North America Microencapsulated Pesticides Market Attractiveness, by Crop, 2017
Figure 18: North America Microencapsulated Pesticides Market Attractiveness, by Application, 2017
Figure 19: Europe Microencapsulated Pesticides Market Volume (Tons) and Value (US$ Mn) Forecast, 2017–2026
Figure 20: Europe Microencapsulated Pesticides Market Attractiveness, by Country and Sub-region, 2017
Figure 21: Europe Microencapsulated Pesticides Market Value Share, by Type, 2017 and 2026
Figure 22: Europe Microencapsulated Pesticides Market Value Share, by Crop, 2017 and 2026
Figure 23: Europe Microencapsulated Pesticides Market Value Share, by Application, 2017 and 2026
Figure 24: Europe Microencapsulated Pesticides Market Value Share, by Country and Sub-region, 2017 and 2026
Figure 25: Europe Microencapsulated Pesticides Market Attractiveness, by Type, 2017
Figure 26: Europe Microencapsulated Pesticides Market Attractiveness, by Crop, 2017
Figure 27: Europe Microencapsulated Pesticides Market Attractiveness, by Application, 2017
Figure 28: Asia Pacific Microencapsulated Pesticides Market Volume (Tons) and Value (US$ Mn) Forecast, 2017–2026
Figure 29: Asia Pacific Microencapsulated Pesticides Market Attractiveness, by Country and Sub-region, 2017
Figure 30: Asia Pacific Microencapsulated Pesticides Market Value Share, by Type, 2017 and 2026
Figure 31: Asia Pacific Microencapsulated Pesticides Market Value Share, by Crop, 2017 and 2026
Figure 32: Asia Pacific Microencapsulated Pesticides Market Value Share, by Application, 2017 and 2026
Figure 33: Asia Pacific Microencapsulated Pesticides Market Value Share, by Country and Sub-region, 2017 and 2026
Figure 34: Asia Pacific Microencapsulated Pesticides Market Attractiveness, by Type, 2017
Figure 35: Asia Pacific Microencapsulated Pesticides Market Attractiveness, by Crop, 2017
Figure 36: Asia Pacific Microencapsulated Pesticides Market Attractiveness, by Application, 2017
Figure 37: Latin America Microencapsulated Pesticides Market Volume (Tons) and Value (US$ Mn) Forecast, 2017–2026
Figure 38: Latin America Microencapsulated Pesticides Market Attractiveness, by Country and Sub-region, 2017
Figure 39: Latin America Microencapsulated Pesticides Market Value Share, by Type, 2017 and 2026
Figure 40: Latin America Microencapsulated Pesticides Market Value Share, by Crop, 2017 and 2026
Figure 41: Latin America Microencapsulated Pesticides Market Value Share, by Application, 2017 and 2026
Figure 42: Latin America Microencapsulated Pesticides Market Value Share, by Country and Sub-region, 2017 and 2026
Figure 43: Latin America Microencapsulated Pesticides Market Attractiveness, by Type, 2017
Figure 44: Latin America Microencapsulated Pesticides Market Attractiveness, by Crop, 2017
Figure 45: Latin America Microencapsulated Pesticides Market Attractiveness, by Application, 2017
Figure 46: Middle East & Africa Microencapsulated Pesticides Market Volume (Tons) and Value (US$ Mn) Forecast, 2017–2026
Figure 47: Middle East & Africa Microencapsulated Pesticides Market Attractiveness, by Country and Sub-region, 2017
Figure 48: Middle East & Africa Microencapsulated Pesticides Market Value Share, by Type, 2017 and 2026
Figure 49: Middle East & Africa Microencapsulated Pesticides Market Value Share, by Crop, 2017 and 2026
Figure 50: Middle East & Africa Microencapsulated Pesticides Market Value Share, by Application, 2017 and 2026
Figure 51: Middle East & Africa Microencapsulated Pesticides Market Value Share, by Country and Sub-region, 2017 and 2026
Figure 52: Middle East & Africa Microencapsulated Pesticides Market Attractiveness, by Type, 2017
Figure 53: Middle East & Africa Microencapsulated Pesticides Market Attractiveness, by Crop, 2017
Figure 54: Middle East & Africa Microencapsulated Pesticides Market Attractiveness, by Application, 2017
Copyright © Transparency Market Research, Inc. All Rights reserved
Trust Online

Microencapsulated Pesticides Market