
Reports
Reports
Analysts’ Viewpoint on Mice Model Technologies Market Scenario
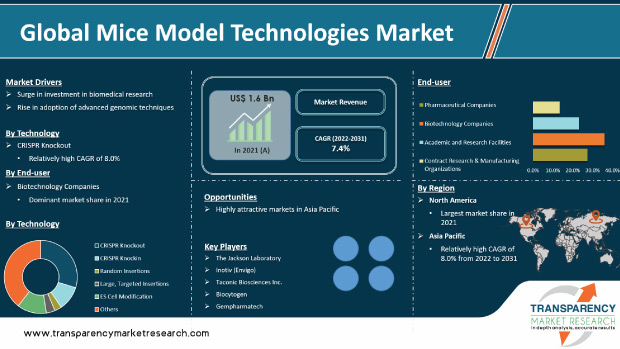
High incidence of genetic disorders worldwide has led to significant R&D investment in genetic testing and rise in adoption of the CRISPR technology in the healthcare industry. CRISPR/Cas9 gene editing, an emerging technology, is extensively used to make mutations in all kinds of organisms. There is also an eminent need for accurate and speedy treatment with the rise in cases of various contagious diseases. Such scenarios have led to an increase in focus on NOD SCID gamma mouse (NSG mice), the model of choice for humanized mice, cell biology, cancer xenograft modeling, and infectious disease research. The global mice model technologies market is expected to grow at a substantial pace, owing to R&D in vaccines and drugs to curb the spread of COVID-19. Furthermore, increase in demand for personalized medicines and rise in prevalence of chronic diseases are also expected to drive the global mice model technologies market size.
Animal model is a non-human species, which can mimic characteristics of a biological process or a disease found in humans. Animal models are used in biomedical research. Genetic engineering is used to develop different types of mice models to target specific human diseases. Mice model technologies are often adopted in biomedical research, as mice share mammalian features with humans and suffer from many similar diseases.
Investment in biomedical research is considered one of the most important indicators of any country’s research landscape. In the last decade, biomedical research expenditure has increased manifold across the globe, with developed countries such as the U.S. and the U.K. dominating the landscape. Majority of these investments are made for R&D of animal models.
The National Institutes of Health (NIH), the largest advocate of biomedical research in the world, had a budget of around US$ 31 Bn in 2019, followed by the Bill & Melinda Gates Foundation (BMGF) and the Wellcome Trust (each with approximately US$ 1.08 Bn; 3.1%). Overall, around 89.6% (approximately US$ 32 Bn) of all the grants awarded for biomedical research were allocated to recipient organizations in the U.S. More than 60% of NIH extramural funding involves animal-related research; most of this is allocated to mice-related studies. Thus, increase in biomedical research funding is expected to drive the global mice model technologies market during the forecast period.
Various techniques and methodologies have been developed in the past few years to create genetically modified mice models of human diseases. Homologous recombination in embryonic stem cells is the conventional way of gene targeting. The advent of new molecular genome-altering technologies such as CRISPR/Cas9 allows for genetic mutations to be introduced into the germ line of a mouse faster and cheaper than previous methods.
Development of mice models is significantly easier than before with the use of CRISPR-based techniques. These techniques can be employed to effectively and quickly (within two to three months) produce frequently used mice models (simple knockout mouse, CRISPR Knockin mouse, point mutation knock-in mouse, cKOs, and reporter/Cre knock-ins). One or two guide RNAs and Cas9 protein can be injected to generate knockout mice. Development of large knock-ins (approximately 5 to 10 kb long) is generally achieved using plasmid DNAs as donors. CRISPR editing or ESC-mediated gene targeting can be used to create humanized knock-in (KI) mice models; each technique has its advantages for model development.
Cyagen TurboKnockout gene targeting service combines benefits of each approach to enable sophisticated gene modeling in C57BL/6 or BALB/c mouse models on an accelerated timeframe, including LFKIs up to 300 kb. In as little as six months, TurboKnockout can provide research-ready mouse models for humanization.
In terms of technology, the global mice model technologies market has been segregated into CRISPR Knockout; CRISPR Knockin; random insertions, large, targeted insertions; ES cell modification (homologous recombination); and others. The CRISPR Knockout segment held dominant share of the market in 2021. It is expected to maintain its dominance during the forecast period. Growth of the segment can be ascribed to high efficiency of CRISPR gene editing technology and increase in adoption of CRISPR technology for the development of CRISPR Knockout mice.
Based on end-user, the global mice model technologies market has been classified into pharmaceutical companies, biotechnology companies, academic and research facilities, and contract research and manufacturing organizations.
The biotechnology companies segment is projected to account for dominant share of the global mice model technologies market during the forecast period. Increase in adoption of CRISPR technology in biotechnology companies and research laboratories is driving the segment. For instance, in October 2016, Caribou Biosciences granted The Jackson Laboratory non-exclusive worldwide rights to use its CRISPR-Cas9 intellectual property to create genetically-engineered mice for research purposes.
The academic and research facilities segment is expected to grow at a higher rate during the forecast period. Growth of the segment can be ascribed to the rise in funding for academic and research facilities for R&D in mice model technologies.
North America dominated the global mice model technologies market, with more than 40% share in 2021. According to the mice model technologies market research study, rise in research and development activities in CRISPR to provide modified products for prevention and treatment of various chronic and rare diseases, such as sickle cell anemia and Alzheimer’s diseases, is expected to fuel the market in North America in the near future.
Asia Pacific is also poised to witness significant growth during the forecast period, owing to the increase in adoption of mice models for R&D in COVID-19 prevention and treatment.
The global mice model technologies market is fragmented, with the presence of international as well as local players. Manufacturers in the market are striving to build a strong network of vendors to enable seamless distribution of products. Players are also focused on adopting strategies such as collaboration, partnership, joint venture, and merger and acquisition to enhance their mice model technologies market share.
Key players operating in the global mice model technologies market include Biocytogen, Charles River Laboratories, Cyagen Biosciences, Gempharmatech, GenOway, Ingenious Targeting Laboratory, Merck KGaA, Ozgene Pty Ltd., Taconic Biosciences, Inc., PolyGene AG, The Jackson Laboratory, Yale School of Medicine, University of North Carolina, University of Nebraska Medical Center, Monash University, UMass Chan Medical School, University of Bonn, Columbia University, and The University of Arizona.
Each of these players has been profiled in the mice model technologies market report based on parameters such as company overview, financial overview, business strategies, product portfolio, business segments, and recent developments.
|
Attribute |
Detail |
|
Market Size Value in 2021 |
US$ 1.6 Bn |
|
Market Forecast Value in 2031 |
US$ 3.2 Bn |
|
Growth Rate (CAGR) |
7.4% |
|
Forecast Period |
2022–2031 |
|
Historical Data Available for |
2017–2020 |
|
Quantitative Units |
US$ Bn for Value |
|
Market Analysis |
It includes cross segment analysis at global as well as regional level. Furthermore, qualitative analysis includes drivers, restraints, opportunities, and key trend analysis. |
|
Competition Landscape |
|
|
Format |
Example: Electronic (PDF) + Excel |
|
Market Segmentation |
|
|
Regions Covered |
|
|
Countries Covered |
|
|
Companies Profiled |
|
|
Customization Scope |
Available upon request |
|
Pricing |
Available upon request |
The global mice model technologies market was valued at US$ 1.6 Bn in 2021
The global mice model technologies market is projected to reach US$ 3.2 Bn by 2031
The global mice model technologies market grew at a CAGR of 6.7% from 2017 to 2021
The global mice model technologies market is anticipated to grow at a CAGR of 7.4% from 2022 to 2031
Increase in R&D in gene technology due to the need for accurate and speedy treatment of various diseases and rise in adoption of advanced genomic techniques
The CRISPR knockout segment accounted for more than 25% share of the global mice model technologies market in 2021
North America is expected to account for major share of the global market during the forecast period
Biocytogen, Charles River Laboratories, Cyagen Biosciences, Gempharmatech, GenOway, Ingenious Targeting Laboratory, Merck KGaA, Ozgene Pty Ltd., Taconic Biosciences, Inc., PolyGene AG, The Jackson Laboratory, Yale School of Medicine, University of North Carolina, University of Nebraska Medical Center, Monash University, UMass Chan Medical School, University of Bonn, Columbia University, and The University of Arizona
1. Preface
1.1. Market Definition and Scope
1.2. Market Segmentation
1.3. Key Research Objectives
1.4. Research Highlights
2. Assumptions and Research Methodology
3. Executive Summary: Global Mice Model Technologies Market
4. Market Overview
4.1. Introduction
4.1.1. Segment Definition
4.2. Overview
4.3. Market Dynamics
4.3.1. Drivers
4.3.2. Restraints
4.3.3. Opportunities
4.4. Global Mice Model Technologies Market Analysis and Forecasts, 2017–2031
4.4.1. Market Revenue Projections (US$ Mn)
5. Key Insights
5.1. Global Genetically Engineered Mouse Model Overview
5.2. Regulatory Scenario by Region/globally
5.3. Technological Advancements
5.4. Key Industry Events (Mergers, Acquisitions, Partnerships, Collaborations, etc.)
5.5. COVID-19 Pandemic Impact on Industry (Value Chain and Short / Mid / Long Term Impact)
6. Global Mice Model Technologies Market Analysis and Forecasts, By Technology
6.1. Introduction & Definition
6.2. Key Findings / Developments
6.3. Market Value Forecast By Technology, 2017–2031
6.3.1. CRISPR Knockout
6.3.2. CRISPR Knockin
6.3.3. Random Insertions
6.3.4. Large, Targeted Insertions
6.3.5. ES Cell Modification (Homologous Recombination)
6.3.6. Others
6.4. Market Attractiveness By Technology
7. Global Mice Model Technologies Market Analysis and Forecasts, By End-user
7.1. Introduction & Definition
7.2. Key Findings / Developments
7.3. Market Value Forecast By End-user, 2017–2031
7.3.1. Pharmaceutical Companies
7.3.2. Biotechnology Companies
7.3.3. Academic and Research Facilities
7.3.4. Contract Research and Manufacturing Organizations
7.4. Market Attractiveness By End-user
8. Global Mice Model Technologies Market Analysis and Forecasts, By Region
8.1. Key Findings
8.2. Market Value Forecast By Region
8.2.1. North America
8.2.2. Europe
8.2.3. Asia Pacific
8.2.4. Latin America
8.2.5. Middle East & Africa
8.3. Market Attractiveness By Country/Region
9. North America Mice Model Technologies Market Analysis and Forecast
9.1. Introduction
9.1.1. Key Findings
9.2. Market Value Forecast By Technology, 2017–2031
9.2.1. CRISPR Knockout
9.2.2. CRISPR Knockin
9.2.3. Random Insertions
9.2.4. Large, Targeted Insertions
9.2.5. ES Cell Modification (Homologous Recombination)
9.2.6. Others
9.3. Market Value Forecast By End-user, 2017–2031
9.3.1. Pharmaceutical Companies
9.3.2. Biotechnology Companies
9.3.3. Academic and Research Facilities
9.3.4. Contract Research and Manufacturing Organizations
9.4. Market Value Forecast By End-user by Technology, 2017–2031
9.4.1. Pharmaceutical Companies
9.4.1.1. CRISPR Knockout
9.4.1.2. CRISPR Knockin
9.4.1.3. Random Insertions
9.4.1.4. Large, Targeted Insertions
9.4.1.5. ES Cell Modification (Homologous Recombination)
9.4.1.6. Others
9.4.2. Biotechnology Companies
9.4.2.1. CRISPR Knockout
9.4.2.2. CRISPR Knockin
9.4.2.3. Random Insertions
9.4.2.4. Large, Targeted Insertions
9.4.2.5. ES Cell Modification (Homologous Recombination)
9.4.2.6. Others
9.4.3. Academic and Research Facilities
9.4.3.1. CRISPR Knockout
9.4.3.2. CRISPR Knockin
9.4.3.3. Random Insertions
9.4.3.4. Large, Targeted Insertions
9.4.3.5. ES Cell Modification (Homologous Recombination)
9.4.3.6. Others
9.4.4. Contract Research and Manufacturing Organizations
9.4.4.1. CRISPR Knockout
9.4.4.2. CRISPR Knockin
9.4.4.3. Random Insertions
9.4.4.4. Large, Targeted Insertions
9.4.4.5. ES Cell Modification (Homologous Recombination)
9.4.4.6. Others
9.5. Market Value Forecast By Country, 2017–2031
9.5.1. U.S.
9.5.2. Canada
9.6. Market Attractiveness Analysis
9.6.1. By Technology
9.6.2. By End-user
9.6.3. By End-user by Technology
9.6.4. By Country
10. Europe Mice Model Technologies Market Analysis and Forecast
10.1. Introduction
10.1.1. Key Findings
10.2. Market Value Forecast By Technology, 2017–2031
10.2.1. CRISPR Knockout
10.2.2. CRISPR Knockin
10.2.3. Random Insertions
10.2.4. Large, Targeted Insertions
10.2.5. ES Cell Modification (Homologous Recombination)
10.2.6. Others
10.3. Market Value Forecast By End-user, 2017–2031
10.3.1. Pharmaceutical Companies
10.3.2. Biotechnology Companies
10.3.3. Academic and Research Facilities
10.3.4. Contract Research and Manufacturing Organizations
10.4. Market Value Forecast By End-user by Technology, 2017–2031
10.4.1. Pharmaceutical Companies
10.4.1.1. CRISPR Knockout
10.4.1.2. CRISPR Knockin
10.4.1.3. Random Insertions
10.4.1.4. Large, Targeted Insertions
10.4.1.5. ES Cell Modification (Homologous Recombination)
10.4.1.6. Others
10.4.2. Biotechnology Companies
10.4.2.1. CRISPR Knockout
10.4.2.2. CRISPR Knockin
10.4.2.3. Random Insertions
10.4.2.4. Large, Targeted Insertions
10.4.2.5. ES Cell Modification (Homologous Recombination)
10.4.2.6. Others
10.4.3. Academic and Research Facilities
10.4.3.1. CRISPR Knockout
10.4.3.2. CRISPR Knockin
10.4.3.3. Random Insertions
10.4.3.4. Large, Targeted Insertions
10.4.3.5. ES Cell Modification (Homologous Recombination)
10.4.3.6. Others
10.4.4. Contract Research and Manufacturing Organizations
10.4.4.1. CRISPR Knockout
10.4.4.2. CRISPR Knockin
10.4.4.3. Random Insertions
10.4.4.4. Large, Targeted Insertions
10.4.4.5. ES Cell Modification (Homologous Recombination)
10.4.4.6. Others
10.5. Market Value Forecast By Country/Sub-Region, 2017–2031
10.5.1. Germany
10.5.2. U.K.
10.5.3. France
10.5.4. Spain
10.5.5. Italy
10.5.6. Rest of Europe
10.6. Market Attractiveness Analysis
10.6.1. By Technology
10.6.2. By End-user
10.6.3. By End-user by Technology
10.6.4. By Country/Sub-Region
11. Asia Pacific Mice Model Technologies Market Analysis and Forecast
11.1. Introduction
11.1.1. Key Findings
11.2. Market Value Forecast By Technology, 2017–2031
11.2.1. CRISPR Knockout
11.2.2. CRISPR Knockin
11.2.3. Random Insertions
11.2.4. Large, Targeted Insertions
11.2.5. ES Cell Modification (Homologous Recombination)
11.2.6. Others
11.3. Market Value Forecast By End-user, 2017–2031
11.3.1. Pharmaceutical Companies
11.3.2. Biotechnology Companies
11.3.3. Academic and Research Facilities
11.3.4. Contract Research and Manufacturing Organizations
11.4. Market Value Forecast By End-user by Technology, 2017–2031
11.4.1. Pharmaceutical Companies
11.4.1.1. CRISPR Knockout
11.4.1.2. CRISPR Knockin
11.4.1.3. Random Insertions
11.4.1.4. Large, Targeted Insertions
11.4.1.5. ES Cell Modification (Homologous Recombination)
11.4.1.6. Others
11.4.2. Biotechnology Companies
11.4.2.1. CRISPR Knockout
11.4.2.2. CRISPR Knockin
11.4.2.3. Random Insertions
11.4.2.4. Large, Targeted Insertions
11.4.2.5. ES Cell Modification (Homologous Recombination)
11.4.2.6. Others
11.4.3. Academic and Research Facilities
11.4.3.1. CRISPR Knockout
11.4.3.2. CRISPR Knockin
11.4.3.3. Random Insertions
11.4.3.4. Large, Targeted Insertions
11.4.3.5. ES Cell Modification (Homologous Recombination)
11.4.3.6. Others
11.4.4. Contract Research and Manufacturing Organizations
11.4.4.1. CRISPR Knockout
11.4.4.2. CRISPR Knockin
11.4.4.3. Random Insertions
11.4.4.4. Large, Targeted Insertions
11.4.4.5. ES Cell Modification (Homologous Recombination)
11.4.4.6. Others
11.5. Market Value Forecast By Country/Sub-Region, 2017–2031
11.5.1. China
11.5.2. Japan
11.5.3. India
11.5.4. Australia & New Zealand
11.5.5. Rest of Asia Pacific
11.6. Market Attractiveness Analysis
11.6.1. By Technology
11.6.2. By End-user
11.6.3. By End-user by Technology
11.6.4. By Country/Sub-Region
12. Latin America Mice Model Technologies Market Analysis and Forecast
12.1. Introduction
12.1.1. Key Findings
12.2. Market Value Forecast By Technology, 2017–2031
12.2.1. CRISPR Knockout
12.2.2. CRISPR Knockin
12.2.3. Random Insertions
12.2.4. Large, Targeted Insertions
12.2.5. ES Cell Modification (Homologous Recombination)
12.2.6. Others
12.3. Market Value Forecast By End-user, 2017–2031
12.3.1. Pharmaceutical Companies
12.3.2. Biotechnology Companies
12.3.3. Academic and Research Facilities
12.3.4. Contract Research and Manufacturing Organizations
12.4. Market Value Forecast By End-user by Technology, 2017–2031
12.4.1. Pharmaceutical Companies
12.4.1.1. CRISPR Knockout
12.4.1.2. CRISPR Knockin
12.4.1.3. Random Insertions
12.4.1.4. Large, Targeted Insertions
12.4.1.5. ES Cell Modification (Homologous Recombination)
12.4.1.6. Others
12.4.2. Biotechnology Companies
12.4.2.1. CRISPR Knockout
12.4.2.2. CRISPR Knockin
12.4.2.3. Random Insertions
12.4.2.4. Large, Targeted Insertions
12.4.2.5. ES Cell Modification (Homologous Recombination)
12.4.2.6. Others
12.4.3. Academic and Research Facilities
12.4.3.1. CRISPR Knockout
12.4.3.2. CRISPR Knockin
12.4.3.3. Random Insertions
12.4.3.4. Large, Targeted Insertions
12.4.3.5. ES Cell Modification (Homologous Recombination)
12.4.3.6. Others
12.4.4. Contract Research and Manufacturing Organizations
12.4.4.1. CRISPR Knockout
12.4.4.2. CRISPR Knockin
12.4.4.3. Random Insertions
12.4.4.4. Large, Targeted Insertions
12.4.4.5. ES Cell Modification (Homologous Recombination)
12.4.4.6. Others
12.5. Market Value Forecast By Country/Sub-Region, 2017–2031
12.5.1. Brazil
12.5.2. Mexico
12.5.3. Rest of Latin America
12.6. Market Attractiveness Analysis
12.6.1. By Technology
12.6.2. By End-user
12.6.3. By End-user by Technology
12.6.4. By Country/Sub-Region
13. Middle East & Africa Mice Model Technologies Market Analysis and Forecast
13.1. Introduction
13.1.1. Key Findings
13.2. Market Value Forecast By Technology, 2017–2031
13.2.1. CRISPR Knockout
13.2.2. CRISPR Knockin
13.2.3. Random Insertions
13.2.4. Large, Targeted Insertions
13.2.5. ES Cell Modification (Homologous Recombination)
13.2.6. Others
13.3. Market Value Forecast By End-user, 2017–2031
13.3.1. Pharmaceutical Companies
13.3.2. Biotechnology Companies
13.3.3. Academic and Research Facilities
13.3.4. Contract Research and Manufacturing Organizations
13.4. Market Value Forecast By End-user by Technology, 2017–2031
13.4.1. Pharmaceutical Companies
13.4.1.1. CRISPR Knockout
13.4.1.2. CRISPR Knockin
13.4.1.3. Random Insertions
13.4.1.4. Large, Targeted Insertions
13.4.1.5. ES Cell Modification (Homologous Recombination)
13.4.1.6. Others
13.4.2. Biotechnology Companies
13.4.2.1. CRISPR Knockout
13.4.2.2. CRISPR Knockin
13.4.2.3. Random Insertions
13.4.2.4. Large, Targeted Insertions
13.4.2.5. ES Cell Modification (Homologous Recombination)
13.4.2.6. Others
13.4.3. Academic and Research Facilities
13.4.3.1. CRISPR Knockout
13.4.3.2. CRISPR Knockin
13.4.3.3. Random Insertions
13.4.3.4. Large, Targeted Insertions
13.4.3.5. ES Cell Modification (Homologous Recombination)
13.4.3.6. Others
13.4.4. Contract Research and Manufacturing Organizations
13.4.4.1. CRISPR Knockout
13.4.4.2. CRISPR Knockin
13.4.4.3. Random Insertions
13.4.4.4. Large, Targeted Insertions
13.4.4.5. ES Cell Modification (Homologous Recombination)
13.4.4.6. Others
13.5. Market Value Forecast By Country/Sub-Region, 2017–2031
13.5.1. GCC Countries
13.5.2. South Africa
13.5.3. Rest of Middle East & Africa
13.6. Market Attractiveness Analysis
13.6.1. By Technology
13.6.2. By End-user
13.6.3. By End-user by Technology
13.6.4. By Country/Sub-Region
14. Competition Landscape
14.1. Market Player – Competition Matrix (By Tier and Size of companies)
14.2. Market Share Analysis By Company (2021)
14.2.1. Global
14.2.2. North America
14.2.3. Europe
14.2.4. By Asia-Pacific
14.2.5. By Latin America
14.2.6. By Middle East & Africa
14.3. Company Profiles
14.3.1. BIOCYTOGEN
14.3.1.1. Company Overview (HQ, Business Segments, Employee Strength)
14.3.1.2. Product Portfolio
14.3.1.3. SWOT Analysis
14.3.1.4. Strategic Overview
14.3.2. Charles River Laboratories
14.3.2.1. Company Overview (HQ, Business Segments, Employee Strength)
14.3.2.2. Product Portfolio
14.3.2.3. SWOT Analysis
14.3.2.4. Strategic Overview
14.3.3. Cyagen Biosciences
14.3.3.1. Company Overview (HQ, Business Segments, Employee Strength)
14.3.3.2. Product Portfolio
14.3.3.3. SWOT Analysis
14.3.3.4. Strategic Overview
14.3.4. Gempharmatech
14.3.4.1. Company Overview (HQ, Business Segments, Employee Strength)
14.3.4.2. Product Portfolio
14.3.4.3. SWOT Analysis
14.3.4.4. Strategic Overview
14.3.5. genOway
14.3.5.1. Company Overview (HQ, Business Segments, Employee Strength)
14.3.5.2. Product Portfolio
14.3.5.3. SWOT Analysis
14.3.5.4. Strategic Overview
14.3.6. ingenious targeting laboratory
14.3.6.1. Company Overview (HQ, Business Segments, Employee Strength)
14.3.6.2. Product Portfolio
14.3.6.3. SWOT Analysis
14.3.6.4. Strategic Overview
14.3.7. Merck KGaA
14.3.7.1. Company Overview (HQ, Business Segments, Employee Strength)
14.3.7.2. Product Portfolio
14.3.7.3. SWOT Analysis
14.3.7.4. Strategic Overview
14.3.8. Ozgene Pty Ltd.
14.3.8.1. Company Overview (HQ, Business Segments, Employee Strength)
14.3.8.2. Product Portfolio
14.3.8.3. SWOT Analysis
14.3.8.4. Strategic Overview
14.3.9. Taconic Biosciences, Inc.
14.3.9.1. Company Overview (HQ, Business Segments, Employee Strength)
14.3.9.2. Product Portfolio
14.3.9.3. SWOT Analysis
14.3.9.4. Strategic Overview
14.3.10. PolyGene AG
14.3.10.1. Company Overview (HQ, Business Segments, Employee Strength)
14.3.10.2. Product Portfolio
14.3.10.3. SWOT Analysis
14.3.10.4. Strategic Overview
14.3.11. THE JACKSON LABORATORY
14.3.11.1. Company Overview (HQ, Business Segments, Employee Strength)
14.3.11.2. Product Portfolio
14.3.11.3. SWOT Analysis
14.3.11.4. Strategic Overview
14.3.12. Yale School of Medicine
14.3.12.1. Company Overview (HQ, Business Segments, Employee Strength)
14.3.12.2. Product Portfolio
14.3.12.3. SWOT Analysis
14.3.12.4. Strategic Overview
14.3.13. University of North Carolina
14.3.13.1. Company Overview (HQ, Business Segments, Employee Strength)
14.3.13.2. Product Portfolio
14.3.13.3. SWOT Analysis
14.3.13.4. Strategic Overview
14.3.14. University of Nebraska Medical Center
14.3.14.1. Company Overview (HQ, Business Segments, Employee Strength)
14.3.14.2. Product Portfolio
14.3.14.3. SWOT Analysis
14.3.14.4. Strategic Overview
14.3.15. Monash University
14.3.15.1. Company Overview (HQ, Business Segments, Employee Strength)
14.3.15.2. Product Portfolio
14.3.15.3. SWOT Analysis
14.3.15.4. Strategic Overview
14.3.16. UMass Chan Medical School
14.3.16.1. Company Overview (HQ, Business Segments, Employee Strength)
14.3.16.2. Product Portfolio
14.3.16.3. SWOT Analysis
14.3.16.4. Strategic Overview
14.3.17. University of Bonn
14.3.17.1. Company Overview (HQ, Business Segments, Employee Strength)
14.3.17.2. Product Portfolio
14.3.17.3. SWOT Analysis
14.3.17.4. Strategic Overview
14.3.18. Columbia University
14.3.18.1. Company Overview (HQ, Business Segments, Employee Strength)
14.3.18.2. Product Portfolio
14.3.18.3. SWOT Analysis
14.3.18.4. Strategic Overview
14.3.19. The University of Arizona
14.3.19.1. Company Overview (HQ, Business Segments, Employee Strength)
14.3.19.2. Product Portfolio
14.3.19.3. SWOT Analysis
14.3.19.4. Strategic Overview
List of Tables
Table 01: Price/Cost Analysis of Mice Models, by Region
Table 02: Global Mice Model Technologies Market Value (US$ Mn) Forecast, by Technology, 2017‒2031
Table 03: Global Mice Model Technologies Market Value (US$ Mn) Forecast, by End-user, 2017‒2031
Table 04: Global Mice Model Technologies Market Value (US$ Mn) Forecast, Pharmaceutical Companies by Technology, 2017‒2031
Table 05: Global Mice Model Technologies Market Value (US$ Mn) Forecast, Biotechnology Companies by Technology, 2017‒2031
Table 06: Global Mice Model Technologies Market Value (US$ Mn) Forecast, Academic and Research Facilities by Technology, 2017‒2031
Table 07: Global Mice Model Technologies Market Value (US$ Mn) Forecast, Contract Research and Manufacturing Organizations by Technology, 2017‒2031
Table 08: Global Mice Model Technologies Market Value (US$ Mn) Forecast, by Region, 2017–2031
Table 09: North America Mice Model Technologies Market Value (US$ Mn) Forecast, by Country, 2017–2031
Table 10: North America Mice Model Technologies Market Value (US$ Mn) Forecast, by Technology, 2017‒2031
Table 11: North America Mice Model Technologies Market Value (US$ Mn) Forecast, by End-user, 2017‒2031
Table 12: North America Mice Model Technologies Market Value (US$ Mn) Forecast, Pharmaceutical Companies by Technology, 2017‒2031
Table 13: North America Mice Model Technologies Market Value (US$ Mn) Forecast, Biotechnology Companies by Technology, 2017‒2031
Table 14: North America Mice Model Technologies Market Value (US$ Mn) Forecast, Academic and Research Facilities by Technology, 2017‒2031
Table 15: North America Mice Model Technologies Market Value (US$ Mn) Forecast, Contract Research and Manufacturing Organizations by Technology, 2017‒2031
Table 16: Europe Mice Model Technologies Market Value (US$ Mn) Forecast, by Country/Sub-Region, 2017–2031
Table 17: Europe Mice Model Technologies Market Value (US$ Mn) Forecast, by Technology, 2017‒2031
Table 18: Europe Mice Model Technologies Market Value (US$ Mn) Forecast, by End-user, 2017‒2031
Table 19: Europe Mice Model Technologies Market Value (US$ Mn) Forecast, Pharmaceutical Companies by Technology, 2017‒2031
Table 20: Europe Mice Model Technologies Market Value (US$ Mn) Forecast, Biotechnology Companies by Technology, 2017‒2031
Table 21: Europe Mice Model Technologies Market Value (US$ Mn) Forecast, Academic and Research Facilities by Technology, 2017‒2031
Table 22: Europe Mice Model Technologies Market Value (US$ Mn) Forecast, Contract Research and Manufacturing Organizations by Technology, 2017‒2031
Table 23: Asia Pacific Mice Model Technologies Market Value (US$ Mn) Forecast, by Country/Sub-region, 2017–2031
Table 24: Asia Pacific Mice Model Technologies Market Value (US$ Mn) Forecast, by Technology, 2017‒2031
Table 25: Asia Pacific Mice Model Technologies Market Value (US$ Mn) Forecast, by End-user, 2017‒2031
Table 26: Asia Pacific Mice Model Technologies Market Value (US$ Mn) Forecast, Pharmaceutical Companies by Technology, 2017‒2031
Table 27: Asia Pacific Mice Model Technologies Market Value (US$ Mn) Forecast, Biotechnology Companies by Technology, 2017‒2031
Table 28: Asia Pacific Mice Model Technologies Market Value (US$ Mn) Forecast, Academic and Research Facilities by Technology, 2017‒2031
Table 29: Asia Pacific Mice Model Technologies Market Value (US$ Mn) Forecast, Contract Research and Manufacturing Organizations by Technology, 2017‒2031
Table 30: Latin America Mice Model Technologies Market Value (US$ Mn) Forecast, by Country/Sub-region, 2017-2031
Table 31: Latin America Mice Model Technologies Market Value (US$ Mn) Forecast, by Technology, 2017‒2031
Table 32: Latin America Mice Model Technologies Market Value (US$ Mn) Forecast, by End-user, 2017‒2031
Table 33: Latin America Mice Model Technologies Market Value (US$ Mn) Forecast, Pharmaceutical Companies by Technology, 2017‒2031
Table 34: Latin America Mice Model Technologies Market Value (US$ Mn) Forecast, Biotechnology Companies by Technology, 2017‒2031
Table 35: Latin America Mice Model Technologies Market Value (US$ Mn) Forecast, Academic & Research Facilities by Technology, 2017‒2031
Table 36: Latin America Mice Model Technologies Market Value (US$ Mn) Forecast, Contract Research and Manufacturing Organizations by Technology, 2017‒2031
Table 37: Middle East & Africa Mice Model Technologies Market Value (US$ Mn) Forecast, by Country/Sub-region, 2017-2031
Table 38: Middle East & Africa Mice Model Technologies Market Value (US$ Mn) Forecast, by Technology, 2017‒2031
Table 39: Middle East & Africa Mice Model Technologies Market Value (US$ Mn) Forecast, by End-user, 2017‒2031
Table 40: Middle East & Africa Mice Model Technologies Market Value (US$ Mn) Forecast, Pharmaceutical Companies by Technology, 2017‒2031
Table 41: Middle East & Africa Mice Model Technologies Market Value (US$ Mn) Forecast, Biotechnology Companies by Technology, 2017‒2031
Table 42: Middle East & Africa Mice Model Technologies Market Value (US$ Mn) Forecast, Academic and Research Facilities by Technology, 2017‒2031
Table 43: Middle East & Africa Mice Model Technologies Market Value (US$ Mn) Forecast, Contract Research and Manufacturing Organizations by Technology, 2017‒2031
List of Figures
Figure 01: Global Mice Model Technologies Market Value (US$ Mn) Forecast, 2017–2031
Figure 02: Mice Model Technologies Market Value Share, by Technology, 2021
Figure 03: Mice Model Technologies Market Value Share, by End-user, 2021
Figure 04: Mice Model Technologies Market Value Share, by Region, 2021
Figure 05: Global Mice Model Technologies Market Value Share Analysis, by Technology, 2021 and 2031
Figure 06: Global Mice Model Technologies Market Attractiveness Analysis, by Technology, 2022–2031
Figure 07: Global Mice Model Technologies Market Value (US$ Mn), by CRISPR Knockout, 2017‒2031
Figure 08: Global Mice Model Technologies Market Value (US$ Mn), by CRISPR Knockin Mice, 2017‒2031
Figure 09: Global Mice Model Technologies Market Value (US$ Mn), by Random Insertions, 2017‒2031
Figure 10: Global Mice Model Technologies Market Value (US$ Mn), by Large, Targeted Insertions, 2017‒2031
Figure 11: Global Mice Model Technologies Market Value (US$ Mn), by ES Cell Modification (Homologous Recombination), 2017‒2031
Figure 12: Global Mice Model Technologies Market Value (US$ Mn), by Others, 2017‒2031
Figure 13: Global Mice Model Technologies Market Value Share Analysis, by End-user, 2021 and 2031
Figure 14: Global Mice Model Technologies Market Attractiveness Analysis, by End-user, 2022–2031
Figure 15: Global Mice Model Technologies Market Value (US$ Mn), by Pharmaceutical Companies, 2017‒2031
Figure 16: Global Mice Model Technologies Market Value (US$ Mn), by Biotechnology Companies, 2017‒2031
Figure 17: Global Mice Model Technologies Market Value (US$ Mn), by Academic and Research Facilities, 2017‒2031
Figure 18: Global Mice Model Technologies Market Value (US$ Mn), by Contract Research and Manufacturing Organizations, 2017‒2031
Figure 19: Global Mice Model Technologies Market Value Share Analysis, by Region, 2021 and 2031
Figure 20: Global Mice Model Technologies Market Attractiveness Analysis, by Region, 2022–2031
Figure 21: North America Mice Model Technologies Market Value (US$ Mn) Forecast, 2017–2031
Figure 22: North America Mice Model Technologies Market Attractiveness Analysis, by Country, 2022–2031
Figure 23: North America Mice Model Technologies Market Value Share Analysis, by Country, 2021 and 2031
Figure 24: North America Mice Model Technologies Market Value Share Analysis, by Technology, 2021 and 2031
Figure 25: North America Mice Model Technologies Market Attractiveness Analysis, by Technology, 2022–2031
Figure 26: North America Mice Model Technologies Market Value Share Analysis, by End-user, 2021 and 2031
Figure 27: North America Mice Model Technologies Market Attractiveness Analysis, by End-user, 2022–2031
Figure 28: Europe Mice Model Technologies Market Value (US$ Mn) Forecast, 2017–2031
Figure 29: Europe Mice Model Technologies Market Attractiveness Analysis, by Country/Sub-region, 2022–2031
Figure 30: Europe Mice Model Technologies Market Value Share Analysis, by Country/Sub-region, 2021 and 2031
Figure 31: Europe Mice Model Technologies Market Value Share Analysis, by Technology, 2021 and 2031
Figure 32: Europe Mice Model Technologies Market Attractiveness Analysis, by Technology, 2022–2031
Figure 33: Europe Mice Model Technologies Market Value Share Analysis, by End-user, 2021 and 2031
Figure 34: Europe Mice Model Technologies Market Attractiveness Analysis, by End-user, 2022–2031
Figure 35: Asia Pacific Mice Model Technologies Market Value (US$ Mn) Forecast, 2017–2031
Figure 36: Asia Pacific Mice Model Technologies Market Attractiveness Analysis, by Country/Sub-region, 2022–2031
Figure 37: Asia Pacific Mice Model Technologies Market Value Share Analysis, by Country/Sub-region, 2021 and 2031
Figure 38: Asia Pacific Mice Model Technologies Market Value Share Analysis, by Technology, 2021 and 2031
Figure 39: Asia Pacific Mice Model Technologies Market Attractiveness Index, by Technology, 2022–2031
Figure 40: Asia Pacific Mice Model Technologies Market Value Share Analysis, by End-user, 2021 and 2031
Figure 41: Asia Pacific Mice Model Technologies Market Attractiveness Analysis, by End-user, 2022–2031
Figure 42: Latin America Mice Model Technologies Market Value (US$ Mn) Forecast, 2017–2031
Figure 43: Latin America Mice Model Technologies Market Attractiveness Analysis, by Country/Sub-Region, 2021-2031
Figure 44: Latin America Mice Model Technologies Market Value Share Analysis, by Country/Sub-Region, 2021 and 2031
Figure 45: Latin America Mice Model Technologies Market Value Share Analysis, by Technology, 2021 and 2031
Figure 46: Latin America Mice Model Technologies Market Attractiveness Analysis, by Technology, 2022–2031
Figure 47: Latin America Mice Model Technologies Market Value Share Analysis, by End-user, 2021 and 2031
Figure 48: Latin America Mice Model Technologies Market Attractiveness Analysis, by End-user, 2022–2031
Figure 49: Middle East & Africa Mice Model Technologies Market Value (US$ Mn) Forecast, 2017–2031
Figure 50: Middle East & Africa Mice Model Technologies Market Attractiveness Analysis, by Country/Sub-Region, 2021-2031
Figure 51: Middle East & Africa Mice Model Technologies Market Value Share Analysis, by Country/Sub-Region, 2021 and 2031
Figure 52: Middle East & Africa Mice Model Technologies Market Value Share Analysis, by Technology, 2021 and 2031
Figure 53: Middle East & Africa Mice Model Technologies Market Attractiveness Analysis, by Technology, 2022–2031
Figure 54: Middle East & Africa Mice Model Technologies Market Value Share Analysis, by End-user, 2021 and 2031
Figure 55: Middle East & Africa Mice Model Technologies Market Attractiveness Analysis, by End-user, 2022–2031
Copyright © Transparency Market Research, Inc. All Rights reserved
Trust Online

Mice Model Technologies Market