
Reports
Reports
Analysts’ Viewpoint
Surge in demand for bulk secure packaging is augmenting the global metal pails business. Metal pails are used to store and transport liquid and semi-liquid products by various end use industries such as food & beverage and chemicals, as they ensure contamination-free storage and transportation of products.
Increase in demand for rigid containers for bulk packaging is projected to create lucrative opportunities for the metal pails market. Growth in demand for industrial packaging is also anticipated to boost market statistics in the near future. Key players operating in the sector are introducing innovative products to meet the needs of end users and broaden their revenue streams.
Tinplate pail is the ideal rigid packaging solution for transporting dangerous products that are flammable and combustible. Strength & safety provided by tinplate pails assures protective transportation of products. It is challenging to find safe packaging solutions, especially for thinners and lubricants, in the chemicals industry. Demand for thinners and lubricants is rising in the automotive industry. Thinners and lubricants are also used in workshops and manufacturing industries. This is bolstering the metal pails market scenario.
Metal pails are widely used in the paint industry for packaging of various paints. The paint industry has been expanding significantly due to infrastructure development across the globe. Improvement in standard of living and increase in disposable income of the people are also fueling the industry.
The global building & construction sector is also expanding at a rapid pace owing to the constant growth in population. Adhesives are widely used in the building & construction sector for furniture, electrical, and other applications. The usage of adhesives has increased in furniture applications due to growth in demand for interior designing. Metal pails are used in packaging and transporting adhesives. Thus, the metal pails market outlook appears positive due to the rise in usage of adhesives in the construction industry.
The COVID-19 pandemic has had a negative impact on the global market. Major end use industries, except for food & beverage and pharmaceutical, closed their operations during the peak of the pandemic. This directly affected metal pails market sales analysis. Trade barriers, imbalance between demand and supply, government restrictions, insufficient supply of raw materials, and disturbance in logistics activities hampered market progress.
The situation returned to normalcy during the latter half of 2021. End use industries started to operate at full efficiency to cover the losses incurred during the pandemic-induced lockdowns. Manufacturers started to focus on expanding their production capacities to increase their sales, thus fueling market expansion. According to the metal pails market assessment, the demand for metal pails is likely to increase at a steady pace during the forecast period.
The food & beverage industry has been expanding significantly since the last few years. Metal pails coated with tin are FDA approved. This makes them safe for usage in food transportation. Metal pails made from steel can be safely used for transporting semisolid and liquid-based products in the food processing industry. Metal pails with lids can keep the food protected from external factors.
Metal pails also make the pouring process convenient. Therefore, they are used widely in the food and beverage industry. This is expected to create significant opportunities in metal pails industry.
Metal pails are being preferred by chemicals and other industries over plastic pails due to the rise in concerns about the environmental effects of plastics. Increase in usage and demand for recyclable or biodegradable materials, and decrease in plastic waste are prominent metal pails market drivers.
Metal pails can be reused and recycled multiple times. The recycling time required for metal pails is lesser compared to that for plastic recycling. Thus, metal pails are sustainable solutions for packaging.
The usage of metal pails does not lead to generation of plastic waste. According to the Organisation for Economic Co-operation and Development (OECD), the global manufacture of plastics increased twofold between 2000 and 2019 to reach 460 million tons. Additionally, polymers with less than five-year lifespan account for two-third of all plastic trash, with packaging constituting 40.0% of this trash. Thus, increase in environmental concerns about plastics is creating opportunities for manufacturers of metal pails.
Demand for rigid packaging is expected to increase consistently during the forecast period due to the expansion of pharmaceutical and chemical sectors. Demand for high-value reusable packaging solutions is estimated to boost the rigid packaging market outlook.
Rigid packaging is an ideal packaging solution for highly volatile chemicals in bulk quantities where other forms of packaging prove inefficient. Properties of rigid packaging such as recyclability, reusability, and durability contribute significantly to the expansion of the metal pails industry.
In recent years, there has been an increase in demand for safe packaging solutions, particularly those designed for the transportation of high-value goods. Industrial pail is an example of secure bulk packaging solution for dangerous chemicals.
Manufacturers and exporters use high-quality industrial packaging for their high-value items to ensure the safe transportation of large quantities of goods. Shipping and logistics partners prefer spill-proof packaging to reduce product waste. Additionally, end use industries are focusing on choosing secure and sustainable bulk packaging options to meet sustainability objectives. This is expected to boost market development in the near future.
Asia Pacific is expected to dominate the global market during the forecast period, led by the expansion of the chemicals industry and surge in demand for chemical products in the region. Demand for rigid industrial containers, including metal pails, is likely to be high in the region in the near future.
Availability of raw materials and labor at a cheaper rate is encouraging metal pails manufacturers to establish facilities in Asia Pacific. This is likely to create lucrative market opportunities.
Increase in production of chemicals in China is projected to create lucrative opportunities for manufacturers of metal pails. The metal pails business in China is anticipated to expand 1.7x times the current market value during 2022 to 2030 owing to the expansion of the chemicals sector in the country.
As per the data provided by the European Chemical Industry Council (CEFIC), China accounted for approximately 45.0% of global chemical sales in 2020. It is considered the largest producer of chemicals in the world. Thus, growth in the chemicals industry in the country is expected to boost the demand for industrial pails, including that for metal pails.
The report concludes with the company profiles section, which comprises vital information about prominent players operating in the global market. Mauser Packaging Solutions, CL Smith LLC, P. Wilkinson Containers Ltd., TANKS INTERNATIONAL SRL, Behrens Manufacturing, LLC, Industrial Packaging, ASA Group, Lancaster Container Inc., Aaron Packaging, Cleveland Steel Container, GREAT WESTERN CONTAINERS INC., and Japan Pail Corporation are key market participants.
The market report profiles these players in terms of company overview, financial overview, business segments, application portfolio, business strategies, and recent developments.
|
Attribute |
Detail |
|
Market Size Value in 2021 |
US$ 6.3 Bn |
|
Market Forecast Value in 2030 |
US$ 9.2 Bn |
|
Growth Rate (CAGR) |
4.3% from 2022 to 2030 |
|
Forecast Period |
2022–2030 |
|
Quantitative Units |
US$ Bn for Value and Units for Volume |
|
Market Analysis |
It includes cross-segment analysis at the global as well as regional levels. Moreover, the qualitative analysis includes drivers, restraints, opportunities, key trends, and a parent industry overview. |
|
Competition Landscape |
|
|
Format |
Electronic (PDF) + Excel |
|
Market Segmentation |
|
|
Regions Covered |
|
|
Countries Covered |
|
|
Companies Profiled |
|
|
Customization Scope |
Available upon request |
|
Pricing |
Available upon request |
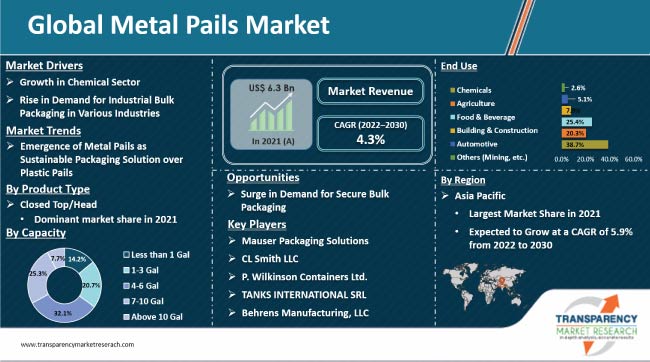
The industry was valued at US$ 6.3 Bn in 2021.
It is likely to expand at a CAGR of 4.3% from 2022-2030.
It is projected to reach US$ 9.2 Bn by 2030.
Growth in chemical sector and rise in demand for industrial bulk packaging in various industries.
The closed top/head segment is estimated to be the leading segment.
Asia Pacific is projected to showcase high demand for metal pails during the forecast period.
Mauser Packaging Solutions, CL Smith LLC, P. Wilkinson Containers Ltd., TANKS INTERNATIONAL SRL, Behrens Manufacturing, LLC, and Japan Pail Corporation.
The industry in China is anticipated to grow 1.7 times the current market value during the forecast period.
1. Executive Summary
1.1. Market Overview
1.2. Market Analysis
1.3. TMR Analysis and Recommendations
2. Market Viewpoint
2.1. Market Definition
2.2. Market Taxonomy
3. Metal Pails Market Overview
3.1. Introduction
3.2. Global Metal Pails Market Overview
3.3. Metal Pails Market (US$ Bn) and Forecast
3.4. Value Chain Analysis
3.4.1. Exhaustive List of Active Participants
3.4.1.1. Raw Material Suppliers
3.4.1.2. Metal Pails Manufacturers/Distributor
3.4.1.3. End Users/Customers
3.4.2. Profitability Margins
3.5. Macro-economic Factors – Correlation Analysis
3.6. Forecast Factors – Relevance & Impact
4. Impact of COVID-19
4.1. Current Statistics and Probable Future Impact
4.2. Impact of COVID-19 on Target Market
5. Metal Pails Market Analysis
5.1. Pricing Analysis
5.1.1. Pricing Assumption
5.1.2. Price Projections By Region
5.2. Market Size (US$ Bn) and Forecast
5.2.1. Market Size and Y-o-Y Growth
5.2.2. Absolute $ Opportunity
6. Metal Pails Market Dynamics
6.1. Drivers
6.2. Restraints
6.3. Opportunity Analysis
6.4. Trends
7. Global Metal Pails Market Analysis and Forecast, By Product Type
7.1. Introduction
7.1.1. Market share and Basis Points (BPS) Analysis, By Product Type
7.1.2. Y-o-Y Growth Projections, By Product Type
7.2. Historical Market Value (US$ Bn) and Volume (Units), 2017-2021, By Product Type
7.2.1. Open Top/Head
7.2.2. Closed Top/Head
7.3. Market Size (US$ Bn) and Volume (Units) Forecast Analysis 2022-2030, By Product Type
7.3.1. Open Top/Head
7.3.2. Closed Top/Head
7.4. Market Attractiveness Analysis, By Product Type
8. Global Metal Pails Market Analysis and Forecast, By Capacity
8.1. Introduction
8.1.1. Market share and Basis Points (BPS) Analysis, By Capacity
8.1.2. Y-o-Y Growth Projections, By Capacity
8.2. Historical Market Value (US$ Bn) and Volume (Units), 2017-2021, By Capacity
8.2.1. Less than 1 Gal
8.2.2. 1-3 Gal
8.2.3. 4-6 Gal
8.2.4. 7-10 Gal
8.2.5. Above 10 Gal
8.3. Market Size (US$ Bn) and Volume (Units) Forecast Analysis 2022-2030, By Capacity
8.3.1. Less than 1 Gal
8.3.2. 1-3 Gal
8.3.3. 4-6 Gal
8.3.4. 7-10 Gal
8.3.5. Above 10 Gal
8.4. Market Attractiveness Analysis, By Capacity
9. Global Metal Pails Market Analysis and Forecast, By End Use
9.1. Introduction
9.1.1. Market share and Basis Points (BPS) Analysis, By End Use
9.1.2. Y-o-Y Growth Projections, By End Use
9.2. Historical Market Value (US$ Bn) and Volume (Units), 2017-2021, By End Use
9.2.1. Chemicals
9.2.2. Agriculture
9.2.3. Food & Beverage
9.2.4. Building & Construction
9.2.5. Automotive
9.2.6. Others (Mining, etc.)
9.3. Market Size (US$ Bn) and Volume (Units) Forecast Analysis 2022-2030, By End Use
9.3.1. Chemicals
9.3.2. Agriculture
9.3.3. Food & Beverage
9.3.4. Building & Construction
9.3.5. Automotive
9.3.6. Others (Mining, etc.)
9.4. Market Attractiveness Analysis, By End Use
10. Global Metal Pails Market Analysis and Forecast, By Region
10.1. Introduction
10.1.1. Market share and Basis Points (BPS) Analysis By Region
10.1.2. Y-o-Y Growth Projections By Region
10.2. Historical Market Value (US$ Bn) and Volume (Units), 2017-2021, By Region
10.2.1. North America
10.2.2. Latin America
10.2.3. Europe
10.2.4. Asia Pacific
10.2.5. Middle East & Africa
10.3. Market Size (US$ Bn) and Volume (Units) Forecast Analysis 2022-2030 By Region
10.3.1. North America
10.3.2. Latin America
10.3.3. Europe
10.3.4. Asia Pacific
10.3.5. Middle East & Africa
10.4. Market Attractiveness Analysis By Region
11. North America Metal Pails Market Analysis and Forecast
11.1. Introduction
11.1.1. Market share and Basis Points (BPS) Analysis, By Country
11.1.2. Y-o-Y Growth Projections, By Country
11.2. Historical Market Value (US$ Bn) and Volume (Units), 2017-2021, By Country
11.3. Market Size (US$ Bn) and Volume (Units) Forecast Analysis 2022-2030, By Country
11.3.1. U.S.
11.3.2. Canada
11.4. Historical Market Value (US$ Bn) and Volume (Units), 2017-2021, By Product Type
11.5. Market Size (US$ Bn) and Volume (Units) Forecast Analysis 2022-2030 Analysis 2022-2030, By Product Type
11.5.1. Open Top/Head
11.5.2. Closed Top/Head
11.6. Historical Market Value (US$ Bn) and Volume (Units), 2017-2021, By Capacity
11.7. Market Size (US$ Bn) and Volume (Units) Forecast Analysis 2022-2030 Analysis 2022-2030, By Capacity
11.7.1. Less than 1 Gal
11.7.2. 1-3 Gal
11.7.3. 4-6 Gal
11.7.4. 7-10 Gal
11.7.5. Above 10 Gal
11.8. Historical Market Value (US$ Bn) and Volume (Units), 2017-2021, By End Use
11.9. Market Size (US$ Bn) and Volume (Units) Forecast Analysis 2022-2030 Analysis 2022-2030, By End Use
11.9.1. Chemicals
11.9.2. Agriculture
11.9.3. Food & Beverage
11.9.4. Building & Construction
11.9.5. Automotive
11.9.6. Others (Mining, etc.)
11.10. Market Attractiveness Analysis
11.10.1. By Country
11.10.2. By Product Type
11.10.3. By Capacity
11.10.4. By End Use
12. Latin America Metal Pails Market Analysis and Forecast
12.1. Introduction
12.1.1. Market share and Basis Points (BPS) Analysis, By Country
12.1.2. Y-o-Y Growth Projections, By Country
12.2. Historical Market Value (US$ Bn) and Volume (Units), 2017-2021, By Country
12.3. Market Size (US$ Bn) and Volume (Units) Forecast Analysis 2022-2030, By Country
12.3.1. Brazil
12.3.2. Mexico
12.3.3. Argentina
12.3.4. Rest of Latin America
12.4. Historical Market Value (US$ Bn) and Volume (Units), 2017-2021, By Product Type
12.5. Market Size (US$ Bn) and Volume (Units) Forecast Analysis 2022-2030 Analysis 2022-2030, By Product Type
12.5.1. Open Top/Head
12.5.2. Closed Top/Head
12.6. Historical Market Value (US$ Bn) and Volume (Units), 2017-2021, By Capacity
12.7. Market Size (US$ Bn) and Volume (Units) Forecast Analysis 2022-2030 Analysis 2022-2030, By Capacity
12.7.1. Less than 1 Gal
12.7.2. 1-3 Gal
12.7.3. 4-6 Gal
12.7.4. 7-10 Gal
12.7.5. Above 10 Gal
12.8. Historical Market Value (US$ Bn) and Volume (Units), 2017-2021, By End Use
12.9. Market Size (US$ Bn) and Volume (Units) Forecast Analysis 2022-2030 Analysis 2022-2030, By End Use
12.9.1. Chemicals
12.9.2. Agriculture
12.9.3. Food & Beverage
12.9.4. Building & Construction
12.9.5. Automotive
12.9.6. Others (Mining, etc.)
12.10. Market Attractiveness Analysis
12.10.1. By Country
12.10.2. By Product Type
12.10.3. By Capacity
12.10.4. By End Use
13. Europe Metal Pails Market Analysis and Forecast
13.1. Introduction
13.1.1. Market share and Basis Points (BPS) Analysis, By Country
13.1.2. Y-o-Y Growth Projections, By Country
13.2. Historical Market Value (US$ Bn) and Volume (Units), 2017-2021, By Country
13.3. Market Size (US$ Bn) and Volume (Units) Forecast Analysis 2022-2030, By Country
13.3.1. Germany
13.3.2. Italy
13.3.3. France
13.3.4. Spain
13.3.5. Nordics
13.3.6. U.K.
13.3.7. Benelux
13.3.8. Russia
13.3.9. Poland
13.3.10. Rest of Europe
13.4. Historical Market Value (US$ Bn) and Volume (Units), 2017-2021, By Product Type
13.5. Market Size (US$ Bn) and Volume (Units) Forecast Analysis 2022-2030 Analysis 2022-2030, By Product Type
13.5.1. Open Top/Head
13.5.2. Closed Top/Head
13.6. Historical Market Value (US$ Bn) and Volume (Units), 2017-2021, By Capacity
13.7. Market Size (US$ Bn) and Volume (Units) Forecast Analysis 2022-2030 Analysis 2022-2030, By Capacity
13.7.1. Less than 1 Gal
13.7.2. 1-3 Gal
13.7.3. 4-6 Gal
13.7.4. 7-10 Gal
13.7.5. Above 10 Gal
13.8. Historical Market Value (US$ Bn) and Volume (Units), 2017-2021, By End Use
13.9. Market Size (US$ Bn) and Volume (Units) Forecast Analysis 2022-2030 Analysis 2022-2030, By End Use
13.9.1. Chemicals
13.9.2. Agriculture
13.9.3. Food & Beverage
13.9.4. Building & Construction
13.9.5. Automotive
13.9.6. Others (Mining, etc.)
13.10. Market Attractiveness Analysis
13.10.1. By Country
13.10.2. By Product Type
13.10.3. By Capacity
13.10.4. By End Use
14. Asia Pacific Metal Pails Market Analysis and Forecast
14.1. Introduction
14.1.1. Market share and Basis Points (BPS) Analysis, By Country
14.1.2. Y-o-Y Growth Projections, By Country
14.2. Historical Market Value (US$ Bn) and Volume (Units), 2017-2021, By Country
14.3. Market Size (US$ Bn) and Volume (Units) Forecast Analysis 2022-2030, By Country
14.3.1. China
14.3.2. India
14.3.3. ASEAN
14.3.4. Australia & New Zealand
14.3.5. Japan
14.3.6. Rest of APAC
14.4. Historical Market Value (US$ Bn) and Volume (Units), 2017-2021, By Product Type
14.5. Market Size (US$ Bn) and Volume (Units) Forecast Analysis 2022-2030 Analysis 2022-2030, By Product Type
14.5.1. Open Top/Head
14.5.2. Closed Top/Head
14.6. Historical Market Value (US$ Bn) and Volume (Units), 2017-2021, By Capacity
14.7. Market Size (US$ Bn) and Volume (Units) Forecast Analysis 2022-2030 Analysis 2022-2030, By Capacity
14.7.1. Less than 1 Gal
14.7.2. 1-3 Gal
14.7.3. 4-6 Gal
14.7.4. 7-10 Gal
14.7.5. Above 10 Gal
14.8. Historical Market Value (US$ Bn) and Volume (Units), 2017-2021, By End Use
14.9. Market Size (US$ Bn) and Volume (Units) Forecast Analysis 2022-2030 Analysis 2022-2030, By End Use
14.9.1. Chemicals
14.9.2. Agriculture
14.9.3. Food & Beverage
14.9.4. Building & Construction
14.9.5. Automotive
14.9.6. Others (Mining, etc.)
14.10. Market Attractiveness Analysis
14.10.1. By Country
14.10.2. By Product Type
14.10.3. By Capacity
14.10.4. By End Use
15. Middle East & Africa Metal Pails Market Analysis and Forecast
15.1. Introduction
15.1.1. Market share and Basis Points (BPS) Analysis, By Country
15.1.2. Y-o-Y Growth Projections, By Country
15.2. Historical Market Value (US$ Bn) and Volume (Units), 2017-2021, By Country
15.3. Market Size (US$ Bn) and Volume (Units) Forecast Analysis 2022-2030, By Country
15.3.1. Northern Africa
15.3.2. GCC Countries
15.3.3. South Africa
15.3.4. Rest of MEA
15.4. Historical Market Value (US$ Bn) and Volume (Units), 2017-2021, By Product Type
15.5. Market Size (US$ Bn) and Volume (Units) Forecast Analysis 2022-2030 Analysis 2022-2030, By Product Type
15.5.1. Open Top/Head
15.5.2. Closed Top/Head
15.6. Historical Market Value (US$ Bn) and Volume (Units), 2017-2021, By Capacity
15.7. Market Size (US$ Bn) and Volume (Units) Forecast Analysis 2022-2030 Analysis 2022-2030, By Capacity
15.7.1. Less than 1 Gal
15.7.2. 1-3 Gal
15.7.3. 4-6 Gal
15.7.4. 7-10 Gal
15.7.5. Above 10 Gal
15.8. Historical Market Value (US$ Bn) and Volume (Units), 2017-2021, By End Use
15.9. Market Size (US$ Bn) and Volume (Units) Forecast Analysis 2022-2030 Analysis 2022-2030, By End Use
15.9.1. Chemicals
15.9.2. Agriculture
15.9.3. Food & Beverage
15.9.4. Building & Construction
15.9.5. Automotive
15.9.6. Others (Mining, etc.)
15.10. Market Attractiveness Analysis
15.10.1. By Country
15.10.2. By Product Type
15.10.3. By Capacity
15.10.4. By End Use
16. Country wise Metal Pails Market Analysis, 2022-2030
16.1. U.S. Metal Pails Market Analysis
16.1.1. By Product Type
16.1.2. By Capacity
16.1.3. By End Use
16.2. Canada Metal Pails Market Analysis
16.2.1. By Product Type
16.2.2. By Capacity
16.2.3. By End Use
16.3. Brazil Metal Pails Market Analysis
16.3.1. By Product Type
16.3.2. By Capacity
16.3.3. By End Use
16.4. Mexico Metal Pails Market Analysis
16.4.1. By Product Type
16.4.2. By Capacity
16.4.3. By End Use
16.5. Germany Metal Pails Market Analysis
16.5.1. By Product Type
16.5.2. By Capacity
16.5.3. By End Use
16.6. Spain Metal Pails Market Analysis
16.6.1. By Product Type
16.6.2. By Capacity
16.6.3. By End Use
16.7. France Metal Pails Market Analysis
16.7.1. By Product Type
16.7.2. By Capacity
16.7.3. By End Use
16.8. U.K. Metal Pails Market Analysis
16.8.1. By Product Type
16.8.2. By Capacity
16.8.3. By End Use
16.9. Italy Metal Pails Market Analysis
16.9.1. By Product Type
16.9.2. By Capacity
16.9.3. By End Use
16.10. Russia Metal Pails Market Analysis
16.10.1. By Product Type
16.10.2. By Capacity
16.10.3. By End Use
16.11. China Metal Pails Market Analysis
16.11.1. By Product Type
16.11.2. By Capacity
16.11.3. By End Use
16.12. India Metal Pails Market Analysis
16.12.1. By Product Type
16.12.2. By Capacity
16.12.3. By End Use
16.13. Japan Metal Pails Market Analysis
16.13.1. By Product Type
16.13.2. By Capacity
16.13.3. By End Use
16.14. GCC Countries Metal Pails Market Analysis
16.14.1. By Product Type
16.14.2. By Capacity
16.14.3. By End Use
16.15. South Africa Metal Pails Market Analysis
16.15.1. By Product Type
16.15.2. By Capacity
16.15.3. By End Use
17. Competitive Landscape
17.1. Market Structure
17.2. Competition Dashboard
17.3. Company Market Share Analysis
17.4. Company Profiles (Details – Overview, Financials, Strategy, Recent Developments, SWOT analysis)
17.5. Competition Deep Dive (Key Global Market Players)
17.5.1. Mausar Packaging Solutions
17.5.1.1. Overview
17.5.1.2. Financials
17.5.1.3. Strategy
17.5.1.4. Recent Developments
17.5.1.5. SWOT Analysis
17.5.2. CL Smith LLC
17.5.2.1. Overview
17.5.2.2. Financials
17.5.2.3. Strategy
17.5.2.4. Recent Developments
17.5.2.5. SWOT Analysis
17.5.3. P. Wilkinson Containers Ltd.
17.5.3.1. Overview
17.5.3.2. Financials
17.5.3.3. Strategy
17.5.3.4. Recent Developments
17.5.3.5. SWOT Analysis
17.5.4. TANKS INTERNATIONAL SRL
17.5.4.1. Overview
17.5.4.2. Financials
17.5.4.3. Strategy
17.5.4.4. Recent Developments
17.5.4.5. SWOT Analysis
17.5.5. Behrens Manufacturing, LLC
17.5.5.1. Overview
17.5.5.2. Financials
17.5.5.3. Strategy
17.5.5.4. Recent Developments
17.5.5.5. SWOT Analysis
17.5.6. Industrial Packaging
17.5.6.1. Overview
17.5.6.2. Financials
17.5.6.3. Strategy
17.5.6.4. Recent Developments
17.5.6.5. SWOT Analysis
17.5.7. ASA Group
17.5.7.1. Overview
17.5.7.2. Financials
17.5.7.3. Strategy
17.5.7.4. Recent Developments
17.5.7.5. SWOT Analysis
17.5.8. Lancaster Container Inc.
17.5.8.1. Overview
17.5.8.2. Financials
17.5.8.3. Strategy
17.5.8.4. Recent Developments
17.5.8.5. SWOT Analysis
17.5.9. Aaron Packaging
17.5.9.1. Overview
17.5.9.2. Financials
17.5.9.3. Strategy
17.5.9.4. Recent Developments
17.5.9.5. SWOT Analysis
17.5.10. Cleveland Steel Container
17.5.10.1. Overview
17.5.10.2. Financials
17.5.10.3. Strategy
17.5.10.4. Recent Developments
17.5.10.5. SWOT Analysis
17.5.11. MANUPAK
17.5.11.1. Overview
17.5.11.2. Financials
17.5.11.3. Strategy
17.5.11.4. Recent Developments
17.5.11.5. SWOT Analysis
17.5.12. Yixing Feihong Steel Packaging Co.,Ltd.
17.5.12.1. Overview
17.5.12.2. Financials
17.5.12.3. Strategy
17.5.12.4. Recent Developments
17.5.12.5. SWOT Analysis
17.5.13. Jiangyin YiDing Packaging Materials Co.,Ltd
17.5.13.1. Overview
17.5.13.2. Financials
17.5.13.3. Strategy
17.5.13.4. Recent Developments
17.5.13.5. SWOT Analysis
17.5.14. GREAT WESTERN CONTAINERS INC.
17.5.14.1. Overview
17.5.14.2. Financials
17.5.14.3. Strategy
17.5.14.4. Recent Developments
17.5.14.5. SWOT Analysis
17.5.15. Japan Pail Corporation
17.5.15.1. Overview
17.5.15.2. Financials
17.5.15.3. Strategy
17.5.15.4. Recent Developments
17.5.15.5. SWOT Analysis
18. Assumptions and Acronyms Used
19. Research Methodology
List of Tables
Table 01: Global Metal Pails Market Historic Value (US$ Bn), By Product Type 2017(H)-2021(A)
Table 02: Global Metal Pails Market Forecast Value (US$ Bn), By Product Type 2022(E)-2030(F)
Table 03: Global Metal Pails Market Historic Volume (Units), By Product Type 2017(H)-2021(A)
Table 04: Global Metal Pails Market Forecast Volume (Units), By Product Type 2022(E)-2030(F)
Table 05: Global Metal Pails Market Historic Value (US$ Bn), By Capacity 2017(H)-2021(A)
Table 06: Global Metal Pails Market Forecast Value (US$ Bn), By Capacity 2022(E)-2030(F)
Table 07: Global Metal Pails Market Historic Volume (Units), By Capacity 2017(H)-2021(A)
Table 08: Global Metal Pails Market Forecast Volume (Units), By Capacity 2022(E)-2030(F)
Table 09: Global Metal Pails Market Historic Value (US$ Bn), By End Use 2017(H)-2021(A)
Table 10: Global Metal Pails Market Forecast Value (US$ Bn), By End Use 2022(E)-2030(F)
Table 11: Global Metal Pails Market Historic Volume (Units), By End Use 2017(H)-2021(A)
Table 12: Global Metal Pails Market Forecast Volume (Units), By End Use 2022(E)-2030(F)
Table 13: Global Metal Pails Market Historic Value (US$ Bn), By Region 2017(H)-2021(A)
Table 14: Global Metal Pails Market Forecast Value (US$ Bn), By Region 2022(E)-2030(F)
Table 15: Global Metal Pails Market Historic Volume (Units), By Region 2017(H)-2021(A)
Table 16: Global Metal Pails Market Forecast Volume (Units), By Region 2022(E)-2030(F)
Table 17: North America Metal Pails Market Historic Value (US$ Bn), By Product Type2017(H)-2021(A)
Table 18: North America Metal Pails Market Forecast Value (US$ Bn), By Product Type2022(E)-2030(F)
Table 19: North America Metal Pails Market Historic Volume (Units), By Product Type2017(H)-2021(A)
Table 20: North America Metal Pails Market Forecast Volume (Units), By Product Type2022(E)-2030(F)
Table 21: North America Metal Pails Market Historic Value (US$ Bn), By Capacity2017(H)-2021(A)
Table 22: North America Metal Pails Market Forecast Value (US$ Bn), By Capacity2022(E)-2030(F)
Table 23: North America Metal Pails Market Historic Volume (Units), By Capacity2017(H)-2021(A)
Table 24: North America Metal Pails Market Forecast Volume (Units), By Capacity2022(E)-2030(F)
Table 25: North America Metal Pails Market Historic Value (US$ Bn), By End Use 2017(H)-2021(A)
Table 26: North America Metal Pails Market Forecast Value (US$ Bn), By End Use 2022(E)-2030(F)
Table 27: North America Metal Pails Market Historic Volume (Units), By End Use 2017(H)-2021(A)
Table 28: North America Metal Pails Market Forecast Volume (Units), By End Use 2022(E)-2030(F)
Table 29: North America Metal Pails Market Historic Value (US$ Bn), By Country 2017(H)-2021(A)
Table 30: North America Metal Pails Market Forecast Value (US$ Bn), By Country 2022(E)-2030(F)
Table 31: North America Metal Pails Market Historic Volume (Units), By Country 2017(H)-2021(A)
Table 32: North America Metal Pails Market Forecast Volume (Units), By Country 2022(E)-2030(F)
Table 33: Latin America Metal Pails Market Historic Value (US$ Bn), By Product Type2017(H)-2021(A)
Table 34: Latin America Metal Pails Market Forecast Value (US$ Bn), By Product Type2022(E)-2030(F)
Table 35: Latin America Metal Pails Market Historic Volume (Units), By Product Type2017(H)-2021(A)
Table 36: Latin America Metal Pails Market Forecast Volume (Units), By Product Type2022(E)-2030(F)
Table 37: Latin America Metal Pails Market Historic Value (US$ Bn), By Capacity2017(H)-2021(A)
Table 38: Latin America Metal Pails Market Forecast Value (US$ Bn), By Capacity2022(E)-2030(F)
Table 39: Latin America Metal Pails Market Historic Volume (Units), By Capacity2017(H)-2021(A)
Table 40: Latin America Metal Pails Market Forecast Volume (Units), By Capacity2022(E)-2030(F)
Table 41: Latin America Metal Pails Market Historic Value (US$ Bn), By End Use 2017(H)-2021(A)
Table 42: Latin America Metal Pails Market Forecast Value (US$ Bn), By End Use 2022(E)-2030(F)
Table 43: Latin America Metal Pails Market Historic Volume (Units), By End Use 2017(H)-2021(A)
Table 44: Latin America Metal Pails Market Forecast Volume (Units), By End Use 2022(E)-2030(F)
Table 45: Latin America Metal Pails Market Historic Value (US$ Bn), By Country 2017(H)-2021(A)
Table 46: Latin America Metal Pails Market Forecast Value (US$ Bn), By Country 2022(E)-2030(F)
Table 47: Latin America Metal Pails Market Historic Volume (Units), By Country 2017(H)-2021(A)
Table 48: Latin America Metal Pails Market Forecast Volume (Units), By Country 2022(E)-2030(F)
Table 49: Europe Metal Pails Market Historic Value (US$ Bn), By Product Type2017(H)-2021(A)
Table 50: Europe Metal Pails Market Forecast Value (US$ Bn), By Product Type2022(E)-2030(F)
Table 51: Europe Metal Pails Market Historic Volume (Units), By Product Type2017(H)-2021(A)
Table 52: Europe Metal Pails Market Forecast Volume (Units), By Product Type2022(E)-2030(F)
Table 53: Europe Metal Pails Market Historic Value (US$ Bn), By Capacity2017(H)-2021(A)
Table 54: Europe Metal Pails Market Forecast Value (US$ Bn), By Capacity2022(E)-2030(F)
Table 55: Europe Metal Pails Market Historic Volume (Units), By Capacity2017(H)-2021(A)
Table 56: Europe Metal Pails Market Forecast Volume (Units), By Capacity2022(E)-2030(F)
Table 57: Europe Metal Pails Market Historic Value (US$ Bn), By End Use 2017(H)-2021(A)
Table 58: Europe Metal Pails Market Forecast Value (US$ Bn), By End Use 2022(E)-2030(F)
Table 59: Europe Metal Pails Market Historic Volume (Units), By End Use 2017(H)-2021(A)
Table 60: Europe Metal Pails Market Forecast Volume (Units), By End Use 2022(E)-2030(F)
Table 61: Europe Metal Pails Market Historic Value (US$ Bn), By Country 2017(H)-2021(A)
Table 62: Europe Metal Pails Market Forecast Value (US$ Bn), By Country 2022(E)-2030(F)
Table 63: Europe Metal Pails Market Historic Volume (Units), By Country 2017(H)-2021(A)
Table 64: Europe Metal Pails Market Forecast Volume (Units), By Country 2022(E)-2030(F)
Table 65: Asia Pacific Metal Pails Market Historic Value (US$ Bn), By Product Type2017(H)-2021(A)
Table 66: Asia Pacific Metal Pails Market Forecast Value (US$ Bn), By Product Type2022(E)-2030(F)
Table 67: Asia Pacific Metal Pails Market Historic Volume (Units), By Product Type2017(H)-2021(A)
Table 68: Asia Pacific Metal Pails Market Forecast Volume (Units), By Product Type2022(E)-2030(F)
Table 69: Asia Pacific Metal Pails Market Historic Value (US$ Bn), By Capacity2017(H)-2021(A)
Table 70: Asia Pacific Metal Pails Market Forecast Value (US$ Bn), By Capacity2022(E)-2030(F)
Table 71: Asia Pacific Metal Pails Market Historic Volume (Units), By Capacity2017(H)-2021(A)
Table 72: Asia Pacific Metal Pails Market Forecast Volume (Units), By Capacity2022(E)-2030(F)
Table 73: Asia Pacific Metal Pails Market Historic Value (US$ Bn), By End Use 2017(H)-2021(A)
Table 74: Asia Pacific Metal Pails Market Forecast Value (US$ Bn), By End Use 2022(E)-2030(F)
Table 75: Asia Pacific Metal Pails Market Historic Volume (Units), By End Use 2017(H)-2021(A)
Table 76: Asia Pacific Metal Pails Market Forecast Volume (Units), By End Use 2022(E)-2030(F)
Table 77: Asia Pacific Metal Pails Market Historic Value (US$ Bn), By Country 2017(H)-2021(A)
Table 78: Asia Pacific Metal Pails Market Forecast Value (US$ Bn), By Country 2022(E)-2030(F)
Table 79: Asia Pacific Metal Pails Market Historic Volume (Units), By Country 2017(H)-2021(A)
Table 80: Asia Pacific Metal Pails Market Forecast Volume (Units), By Country 2022(E)-2030(F)
Table 81: MEA Metal Pails Market Historic Value (US$ Bn), By Product Type2017(H)-2021(A)
Table 82: MEA Metal Pails Market Forecast Value (US$ Bn), By Product Type2022(E)-2030(F)
Table 83: MEA Metal Pails Market Historic Volume (Units), By Product Type2017(H)-2021(A)
Table 84: MEA Metal Pails Market Forecast Volume (Units), By Product Type2022(E)-2030(F)
Table 85: MEA Metal Pails Market Historic Value (US$ Bn), By Capacity2017(H)-2021(A)
Table 86: MEA Metal Pails Market Forecast Value (US$ Bn), By Capacity2022(E)-2030(F)
Table 87: MEA Metal Pails Market Historic Volume (Units), By Capacity2017(H)-2021(A)
Table 88: MEA Metal Pails Market Forecast Volume (Units), By Capacity2022(E)-2030(F)
Table 89: MEA Metal Pails Market Historic Value (US$ Bn), By End Use 2017(H)-2021(A)
Table 90: MEA Metal Pails Market Forecast Value (US$ Bn), By End Use 2022(E)-2030(F)
Table 91: MEA Metal Pails Market Historic Volume (Units), By End Use 2017(H)-2021(A)
Table 92: MEA Metal Pails Market Forecast Volume (Units), By End Use 2022(E)-2030(F)
Table 93: MEA Metal Pails Market Historic Value (US$ Bn), By Country 2017(H)-2021(A)
Table 94: MEA Metal Pails Market Forecast Value (US$ Bn), By Country 2022(E)-2030(F)
Table 95: MEA Metal Pails Market Historic Volume (Units), By Country 2017(H)-2021(A)
Table 96: MEA Metal Pails Market Forecast Volume (Units), By Country 2022(E)-2030(F)
List of Figures
Figure 01: Global Metal Pails Market Share Analysis by Product Type, 2022E & 2030F
Figure 02: Global Metal Pails Market Attractiveness Analysis by Product Type, 2022E-2030F
Figure 03: Global Metal Pails Market Y-o-Y Analysis by Product Type, 2019H-2030F
Figure 04: Global Metal Pails Market Share Analysis by Capacity, 2022E & 2030F
Figure 05: Global Metal Pails Market Attractiveness Analysis by Capacity, 2022E-2030F
Figure 06: Global Metal Pails Market Y-o-Y Analysis by Capacity, 2019H-2030F
Figure 07: Global Metal Pails Market Share Analysis by End Use, 2022E & 2030F
Figure 08: Global Metal Pails Market Attractiveness Analysis by End Use, 2022E-2030F
Figure 09: Global Metal Pails Market Y-o-Y Analysis by End Use, 2019H-2030F
Figure 10: Global Metal Pails Market Share Analysis by Region, 2022E & 2030F
Figure 11: Global Metal Pails Market Attractiveness Analysis by Region, 2022E-2030F
Figure 12: Global Metal Pails Market Y-o-Y Analysis by Region, 2019H-2030F
Figure 13: North America Metal Pails Market Share Analysis by Product Type, 2022E & 2030F
Figure 14: North America Metal Pails Market Value Share Analysis by Capacity Type 2022(E)
Figure 15: North America Metal Pails Market Attractiveness Analysis by End Use, 2022E-2030F
Figure 16: North America Metal Pails Market Value Share Analysis by Country 2022(E)
Figure 17: Latin America Metal Pails Market Share Analysis by Product Type, 2022E & 2030F
Figure 18: Latin America Metal Pails Market Value Share Analysis by Capacity 2022(E)
Figure 19: Latin America Metal Pails Market Attractiveness Analysis by End Use, 2022E-2030F
Figure 20: Latin America Metal Pails Market Value Share Analysis by Country 2022(E)
Figure 21: Europe Metal Pails Market Share Analysis by Product Type, 2022E & 2030F
Figure 22: Europe Metal Pails Market Value Share Analysis by Capacity 2022(E)
Figure 23: Europe Metal Pails Market Attractiveness Analysis by End Use, 2022E-2030F
Figure 24: Europe Metal Pails Market Value Share Analysis by Country 2022(E)
Figure 25: Asia Pacific Metal Pails Market Share Analysis by Product Type, 2022E & 2030F
Figure 26: Asia Pacific Metal Pails Market Value Share Analysis by Capacity 2022(E)
Figure 27: Asia Pacific Metal Pails Market Attractiveness Analysis by End Use, 2022E-2030F
Figure 28: Asia Pacific Metal Pails Market Value Share Analysis by Country 2022(E)
Figure 29: MEA Metal Pails Market Share Analysis by Product Type, 2022E & 2030F
Figure 30: MEA Metal Pails Market Value Share Analysis by Capacity 2022(E)
Figure 31: MEA Metal Pails Market Attractiveness Analysis by End Use, 2022E-2030F
Figure 32: MEA Metal Pails Market Value Share Analysis by Country 2022(E)
Figure 33: U.S. Metal Pails Market Value Share Analysis, by Product Type, 2022E & 2030F
Figure 34: U.S. Metal Pails Market Value Share Analysis, by Capacity, 2022E
Figure 35: U.S. Metal Pails Market Value Share Analysis, by End Use, 2022E & 2030F
Figure 36: Canada Metal Pails Market Value Share Analysis, by Product Type, 2022E & 2030F
Figure 37: Canada Metal Pails Market Value Share Analysis, by Capacity, 2022E
Figure 38: Canada Metal Pails Market Value Share Analysis, by End Use, 2022E & 2030F
Figure 39: Brazil Metal Pails Market Value Share Analysis, by Product Type, 2022E & 2030F
Figure 40: Brazil Metal Pails Market Value Share Analysis, by Capacity, 2022E
Figure 41: Brazil Metal Pails Market Value Share Analysis, by End Use, 2022E & 2030F
Figure 42: Mexico Metal Pails Market Value Share Analysis, by Product Type, 2022E & 2030F
Figure 43: Mexico Metal Pails Market Value Share Analysis, by Capacity, 2022E
Figure 44: Mexico Metal Pails Market Value Share Analysis, by End Use, 2022E & 2030F
Figure 45: Germany Metal Pails Market Value Share Analysis, by Product Type, 2022E & 2030F
Figure 46: Germany Metal Pails Market Value Share Analysis, by Capacity, 2022E
Figure 47: Germany Specialty Paper Market Value Share Analysis, by End Use, 2022E & 2030F
Figure 48: Spain Metal Pails Market Value Share Analysis, by Product Type, 2022E & 2030F
Figure 49: Spain Metal Pails Market Value Share Analysis, by Capacity, 2022E
Figure 50: Spain Metal Pails Market Value Share Analysis, by End Use, 2022E & 2030F
Figure 51: France Metal Pails Market Value Share Analysis, by Product Type, 2022E & 2030F
Figure 52: France Metal Pails Market Value Share Analysis, by Capacity, 2022E
Figure 53: France Metal Pails Market Value Share Analysis, by End Use, 2022E & 2030F
Figure 54: U.K. Metal Pails Market Value Share Analysis, by Product Type, 2022E & 2030F
Figure 55: U.K. Metal Pails Market Value Share Analysis, by Capacity, 2022E
Figure 56: U.K. Metal Pails Market Value Share Analysis, by End Use, 2022E & 2030F
Figure 57: Italy Metal Pails Market Value Share Analysis, by Product Type, 2022E & 2030F
Figure 58: Italy Metal Pails Market Value Share Analysis, by Capacity, 2022E
Figure 59: Italy Metal Pails Market Value Share Analysis, by End Use, 2022E & 2030F
Figure 60: Russia Metal Pails Market Value Share Analysis, by Product Type, 2022E & 2030F
Figure 61: Russia Metal Pails Market Value Share Analysis, by Capacity, 2022E
Figure 62: Russia Metal Pails Market Value Share Analysis, by End Use, 2022E & 2030F
Figure 63: China Metal Pails Market Value Share Analysis, by Product Type, 2022E & 2030F
Figure 64: China Metal Pails Market Value Share Analysis, by Capacity, 2022E
Figure 65: China Metal Pails Market Value Share Analysis, by End Use, 2022E & 2030F
Figure 66: India Metal Pails Market Value Share Analysis, by Product Type, 2022E & 2030F
Figure 67: India Metal Pails Market Value Share Analysis, by Capacity, 2022E
Figure 68: India Metal Pails Market Value Share Analysis, by End Use, 2022E & 2030F
Figure 69: Japan Metal Pails Market Value Share Analysis, by Product Type, 2022E & 2030F
Figure 70: Japan Metal Pails Market Value Share Analysis, by Capacity, 2022E
Figure 71: Japan Metal Pails Market Value Share Analysis, by End Use, 2022E & 2030F
Figure 72: GCC Countries Metal Pails Market Value Share Analysis, by Product Type, 2022E & 2030F
Figure 73: GCC Countries Metal Pails Market Value Share Analysis, by Capacity, 2022E
Figure 74: GCC Countries Metal Pails Market Value Share Analysis, by End Use, 2022E & 2030F
Figure 75: South Africa Metal Pails Market Value Share Analysis, by Product Type, 2022E & 2030F
Figure 76: South Africa Metal Pails Market Value Share Analysis, by Capacity, 2022E
Figure 77: South Africa Metal Pails Market Value Share Analysis, by End Use, 2022E & 2030F
Copyright © Transparency Market Research, Inc. All Rights reserved
Trust Online

Metal Pails Market