
Reports
Reports
As old health rules are overturned, a physiological approach that starts from health in place of disease is gaining high emphasis. Hippocrates quote, ‘Let food be thy medicine and medicine be thy food’ has been put into practice, as individuals are considering medical nutrition and food for enhancing health and treating disease, despite the developments procured in the field of medical science.
The idea of disease prevention to avoid or simplify complicated therapeutics is supported by the convergence of the pharmaceutical and food industry. In the past years, literatures have stated that the gap between nutrition science and pharmacology has been narrowing, a progress stirred by both disciplines. The only substances considered pharmacologically active in the past were drugs. Progressing on these terms, medical nutrition, the new treatment pattern entails on the fact that nutrients can have an intense effect on metabolic, immunological and other pathophysiological processes of unhealthy patients.
TMR, in its new research study, reveals compelling insights into the medical nutrition space, to assist readers with data-driven decision making. According to the TMR study, revenues from the medical nutrition market closed in on a valuation of over US$ 13,000 Mn in 2018. This growth is attributed to the growing awareness of chronic diseases among consumers coupled with the various initiatives and programs commenced for the effective prevention and control of these diseases. This has led to the growing inclination towards medical nutrition supplements.
Developments in biotechnology has further resulted in the revolution of the medical nutrition market as key manufacturers are concentrating on research and development of improved and personalized medical nutrition offerings. Moreover, the development of disease-specific specialized solution for the medical nutrition markets is also observed, particularly in the developed economies.
From industry giants to first-movers, enterprises have long been in mercy of revolutionizing industry trends. Key trends shaping the medical nutrition landscape are discussed below.
The digestive wellness trend embodies the increasing awareness around new ingredients, nutritional products which are based on the public health recommendations and science. This is led to the reduction of sugar content of foods. According to reports, a large part of the consumer base prefers the consumption of health-improving ingredients through food, as consumers care about nutrition with which they gain a control over their health and lifestyle. Foods that help reduce the gastrointestinal symptoms including the ‘free-from’ foods, ‘added-benefits’ ingredients, fermented foods, prebiotics, and probiotics are gaining focus with this trend.
Driven by key developments in technology along with the continual progress attained by the field of science, the personalized medical nutrition has become much more than just a concept. Medical nutrition solutions providers are incorporating multidisciplinary approach to set up centers that focus on development of nutritional products that cater to specific needs. The future of personalized medical nutrition is cited to be fully individualized backed with constant monitoring of personalized information including gut bacteria, biomarkers or genes.
There is a major demand witnessed for the foods perceived to be free-from, clean, and natural allied to the growth in healthy eating. Studies have found that the label claims are likely to influence the buying decisions of consumers on a large scale as the need for authenticity and transparency in foods and beverages has witnessed a significant growth. In addition, key regulations pertaining to food product labelling are further necessitating medical nutrition product manufacturers to concentrate on this progressive trend.
The medical nutrition market players continue to progress in the medical nutrition landscape with a key focus on investments. Major investments are carried out in areas of research and development, acquisition of local medical nutrition providers and expansion in promising regions. A number of partnerships and collaborations are also likely to foster the growth of businesses.
North America reflects key growth opportunities for the medical nutrition market players and is expected to remain the leading region for medical nutrition market through 2026. Europe is also one of the attractive regional markets for the medical nutrition. Companies are witnessing various growth opportunities in both North America and Europe owing to the healthy demand for preventive medical nutrition supplements from these regions which are attributed to the high prevalence of malnutrition in older adults in geriatric care facilities and hospitals. Asia Pacific excluding Japan is estimated to a high growth market, opening key opportunities for the companies.
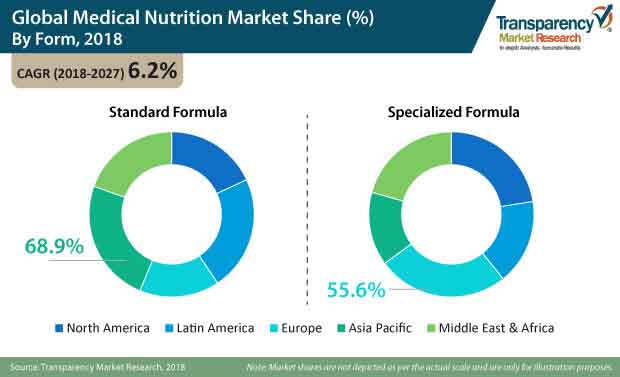
Formula type and mode of delivery have emerged as lucrative segments in the medical nutrition market. In formula type, the specialized formula has been in demand over the years. However, the growth of standard formula is high on account of the rising consumption of medical nutrition products for consumer’s general well-being. The enteral medical nutrition is the most preferred mode of delivery by consumers. However, people suffering from digestive problems and GI tract infections are advised to consume medical nutrition by parenteral mode of delivery in which the supplements are given to the patients intravenously. As a result of this, although the demand for parenteral medical nutrition will not grow at a high rate, it is expected to remain a very attractive segment. Various medical nutrition companies are cashing on the attractiveness of the parenteral formula, incorporating newer strategies to gain profits.
Key developments carried out by leading players in the medical nutrition market:
The medical nutrition market is consolidated market as a significant market share captured by leading players in the medical nutrition market. The medical nutrition product manufacturers are focusing on innovating products by developing R&D facilities that help scrutinize the specific consumer requirements, resulting in new product launches in a short time span. Merger and acquisition strategy has emerged key strategy for medical nutrition market players. Expansion of capacity with the collaboration of R&D departments, implementation of developments programs, and more are emerging as a key focus areas of the medical nutrition market players.
Analysts’ Viewpoint on the Medical Nutrition Market
The medical nutrition products primarily witness high demand from the geriatric population. However, the utilization of medical nutrition by adults for the purpose of general well-being is creating wealthy opportunities for companies. Companies operating in the medical nutrition market can expect progressive growth with investments in the specialization of the products by launching medical nutrition offering that target specific conditions. As consumers are ready to pay premium prices, the medical nutrition business will sustain progress in the near future. Moreover, the increasing illness among consumers globally could lead to higher sales.
Differentiation strategy is laying the foundation of a significant market foothold for various medical nutrition market players. While established medical nutrition market players can invest in R&D activities to manufacture innovative products, similar approach can be implemented by new entrants. Premix ingredients are in high demand owing to urbanization, resulting in a demand for less time consuming alternatives that match the fast-paced lives. Medical nutrition companies can direct their efforts towards these transforming consumer requirements to further benefit from these profit gaining opportunities. Companies providing medical nutrition offerings are recommended to increase their global presence and capture emerging markets such as the APEJ and the MEA, that exhibit growth potential for the medical nutrition business.
In 2018, Medical Nutrition Market was valued at US$ 13,000 Mn
Medical Nutrition Market is estimated to rise at a CAGR of 6.2% during forecast period
Major demand witnessed for the foods perceived to be free-from, clean, and natural allied is expected to drive the Medical Nutrition Market
North America is more attractive for vendors in the Medical Nutrition Market
Key players of Medical Nutrition Market are NUTRICIÓN MÉDICA SL, Meiji Holdings Co., Ltd., Medtrition Inc., Baxter International Inc., B. Braun Melsungen AG., Fresenius Kabi AG, Danone Nutricia, Nestlé S.A., LLC, Otsuka Holdings Co., Ltd. (Parent of Otsuka Pharmaceutical) Europe Ltd. and Abbott Laboratories amongst others
1. Global Medical Nutrition Market - Executive Summary
1.1. Global Medical Nutrition Market Country Analysis
1.2. Vertical Specific Market Penetration
1.3. Application – Product Mapping
1.4. Competition Blueprint
1.5. TMR Analysis and Recommendations
2. Market Overview
2.1. Market Introduction
2.2. Market Definition
2.3. Market Taxonomy
3. Market Dynamics
3.1. Macro-economic Factors
3.1.1. Global Healthcare Expenditure
3.1.2. Population of Key Countries
3.1.3. Healthcare Industry Overview
3.1.4. Business Environment Outlook
3.1.5. Global Trade Scenario
3.1.6. Economic Outlook
3.1.7. Political Outlook
3.2. Drivers
3.2.1. Increasing Malnutrition Cases Associated with Chronic Diseases
3.2.2. Increasing Geriatric Population in Developed Countries
3.2.3. Approvals of Novel Parenteral Nutrition Combinations
3.3. Market Restraints
3.3.1. Side-effects or Complications Related to Parenteral Nutrition Products
3.3.2. Higher Adoption of Alternatives to Nutrition Intake
3.3.3. Higher HAI in Preterm Infants to Restrict the Use of Parenteral Nutrition
3.4. Market Trends
3.4.1. Increasing Shortage of Components of Parenteral Nutrition in the U.S.
3.4.2. Use of Hypo caloric over Traditional Parenteral Nutrition
3.4.3. Technology Advancements
3.5. Trend Analysis- Impact on Time Line (2018-2027)
3.6. Forecast Factors – Relevance and Impact
3.7. Regulatory Scenario
3.8. Procurement Process in Europe : HealthTrust Europe
3.9. Cost Structure Analysis
3.10. List of Market Participants
3.11. Overview of Hospital Cases
4. Associated Industry and Key Indicator Assessment
4.1. Parent Industry Overview
4.1.1. Market Size and Forecast
4.1.2. Market Size and Y-o-Y Growth
4.1.3. Absolute $ Opportunity
5. Supply Chain Analysis
5.1. Profitability and Gross Margin Analysis By Competition
5.2. List of Active Participants- By Region
5.2.1. Raw Material Suppliers
5.2.2. Key Manufacturers
5.2.3. Key Distributor/Retailers
5.2.4. Operating Margins
6. Global Medical Nutrition Market Pricing Analysis
6.1. Price Point Assessment by Product Type
6.2. Regional Average Pricing Analysis
6.2.1. North America
6.2.2. Latin America
6.2.3. Europe
6.2.4. Asia Pacific Ex. Japan (APEJ)
6.2.5. Japan
6.2.6. Oceania
6.2.7. Middle East and Africa
6.3. Price Forecast till 2027
6.4. Factors Influencing Pricing
7. Global Medical Nutrition Market Analysis and Forecast
7.1. Market Size Analysis (2013-2017) and Forecast (2018-2027)
7.1.1. Market Value (US$ Mn) and Volume (Tons) and Y-o-Y Growth
7.1.2. Absolute $ Opportunity
7.2. Global Medical Nutrition Market Scenario Forecast (Optimistic, Likely and Conservative Market Conditions)
7.2.1. Forecast Factors and Relevance of Impact
7.2.2. Regional Medical Nutrition Market Business Performance Summary
8. Global Medical Nutrition Market Analysis By Product Type
8.1. Introduction
8.1.1. Y-o-Y Growth Comparison By Product Type
8.1.2. Basis Point Share (BPS) Analysis By Product Type
8.2. Medical Nutrition Market Size (US$ Mn) and Volume (MT) Analysis (2013-2017) & Forecast (2018-2027) By Product Type
8.2.1. Standardized Formula
8.2.2. Specialized Formula
8.3. Market Attractiveness Analysis By Product Type
9. Global Medical Nutrition Market Analysis By Indication
9.1. Introduction
9.1.1. Y-o-Y Growth Comparison By Indication
9.1.2. Basis Point Share (BPS) Analysis By Indication
9.2. Medical Nutrition Market Size (US$ Mn) and Volume (MT) Analysis (2013-2017) & Forecast (2018-2027) By Indication
9.2.1. General Well-being
9.2.1.1. Enteral Nutrition
9.2.1.2. Parental Nutrition
9.2.2. Renal Disorders
9.2.2.1. Enteral Nutrition
9.2.2.2. Parental Nutrition
9.2.3. Hepatic Disorders
9.2.3.1. Enteral Nutrition
9.2.3.2. Parental Nutrition
9.2.4. Oncology Nutrition
9.2.4.1. Enteral Nutrition
9.2.4.2. Parental Nutrition
9.2.5. Diabetes
9.2.5.1. Enteral Nutrition
9.2.5.2. Parental Nutrition
9.2.6. Dysphagia
9.2.6.1. Enteral Nutrition
9.2.6.2. Parental Nutrition
9.2.7. Respiratory Disorders
9.2.7.1. Enteral Nutrition
9.2.7.2. Parental Nutrition
9.2.8. IBD & GI
9.2.8.1. Enteral Nutrition
9.2.8.2. Parental Nutrition
9.2.9. Neurological Disorders
9.2.9.1. Enteral Nutrition
9.2.9.2. Parental Nutrition
9.2.10. Respiratory Disorders
9.2.10.1. Enteral Nutrition
9.2.10.2. Parental Nutrition
9.2.11. Others
9.2.11.1. Enteral Nutrition
9.2.11.2. Parental Nutrition
9.3. Market Attractiveness Analysis By Indication
10. Global Medical Nutrition Market Analysis By End User
10.1. Introduction
10.1.1. Y-o-Y Growth Comparison By End User
10.1.2. Basis Point Share (BPS) Analysis By End User
10.2. Medical Nutrition Market Size (US$ Mn) and Volume (MT) Analysis (2013-2017) & Forecast (2018-2027) By End User
10.2.1. Adult
10.2.2. Geriatric
10.2.3. Paediatric
10.3. Market Attractiveness Analysis By End User
11. Global Medical Nutrition Market Analysis By Flavor
11.1. Introduction
11.1.1. Y-o-Y Growth Comparison By Flavor
11.1.2. Basis Point Share (BPS) Analysis By Flavor
11.2. Medical Nutrition Market Size (US$ Mn) and Volume (MT) Analysis (2013-2017) & Forecast (2018-2027) By Flavor
11.2.1. Regular
11.2.2. Flavored
11.2.2.1. Chocolate
11.2.2.2. Vanilla
11.2.2.3. Strawberry
11.2.2.4. Apple
11.2.2.5. Mixed Berries
11.2.2.6. Orange
11.2.2.7. Nut Flavor
11.2.2.8. Others
11.3. Market Attractiveness Analysis By Flavor
12. Global Medical Nutrition Market Analysis By Distribution Channel
12.1. Introduction
12.1.1. Y-o-Y Growth Comparison By Distribution Channel
12.1.2. Basis Point Share (BPS) Analysis By Distribution Channel
12.2. Medical Nutrition Market Size (US$ Mn) and Volume (MT) Analysis (2013-2017) & Forecast (2018-2027) By Distribution Channel
12.2.1. Regular
12.2.2. Flavored
12.2.2.1. Chocolate
12.2.2.2. Vanilla
12.2.2.3. Strawberry
12.2.2.4. Apple
12.2.2.5. Mixed Berries
12.2.2.6. Orange
12.2.2.7. Nut Flavor
12.2.2.8. Others
12.3. Market Attractiveness Analysis By Distribution Channel
13. Global Medical Nutrition Market Analysis and Forecast, By Region
13.1. Introduction
13.1.1. Basis Point Share (BPS) Analysis By Region
13.1.2. Y-o-Y Growth Projections By Region
13.2. Medical Nutrition Market Size (US$ Mn) and Volume (MT) & Forecast (2018-2027) Analysis By Region
13.2.1. North America
13.2.2. Europe
13.2.3. APEJ
13.2.4. Japan
13.2.5. Oceania
13.2.6. Latin America
13.2.7. Middle East and Africa
13.3. Market Attractiveness Analysis By Region
14. North America Medical Nutrition Market Analysis and Forecast
14.1. Introduction
14.1.1. Basis Point Share (BPS) Analysis By Country
14.1.2. Y-o-Y Growth Projections By Country
14.2. Medical Nutrition Market Size (Value (US$) and Volume (MT) Analysis (2013-2018) and Forecast (2018-2027)
14.2.1. Market Attractiveness By Country
14.2.1.1. U.S.
14.2.1.2. Canada
14.2.2. By Product Type
14.2.3. By Indication
14.2.4. By End User
14.2.5. By Flavor
14.2.6. By Distribution Channel
14.3. Market Attractiveness Analysis
14.3.1. By Country
14.3.2. By Product Type
14.3.3. By Indication
14.3.4. By End User
14.3.5. By Flavor
14.3.6. By Distribution Channel
14.4. Drivers and Restraints: Impact Analysis
15. Latin America Medical Nutrition Market Analysis and Forecast
15.1. Introduction
15.1.1. Basis Point Share (BPS) Analysis By Country
15.1.2. Y-o-Y Growth Projections By Country
15.1.3. Key Regulations
15.2. Medical Nutrition Market Size (Value (US$) and Volume (MT) Analysis (2013-2018) and Forecast (2018-2027)
15.2.1. By Country
15.2.1.1. Brazil
15.2.1.2. Mexico
15.2.1.3. Chile
15.2.1.4. Peru
15.2.1.5. Argentina
15.2.1.6. Rest of Latin America
15.2.2. By Product Type
15.2.3. By Indication
15.2.4. By End User
15.2.5. By Flavor
15.2.6. By Distribution Channel
15.3. Market Attractiveness Analysis
15.3.1. By Country
15.3.2. By Product Type
15.3.3. By Indication
15.3.4. By End User
15.3.5. By Flavor
15.3.6. By Distribution Channel
15.4. Drivers and Restraints: Impact Analysis
16. Europe Medical Nutrition Market Analysis and Forecast
16.1. Introduction
16.1.1. Basis Point Share (BPS) Analysis By Country
16.1.2. Y-o-Y Growth Projections By Country
16.1.3. Key Regulations
16.2. Medical Nutrition Market Size (Value (US$) and Volume (MT) Analysis (2013-2018) and Forecast (2018-2027)
16.2.1. By Country
16.2.1.1. EU-4 (Germany, France, Italy, Spain)
16.2.1.2. U.K.
16.2.1.3. BENELUX
16.2.1.4. Nordic
16.2.1.5. Russia
16.2.1.6. Poland
16.2.1.7. Rest of Europe
16.2.2. By Product Type
16.2.3. By Indication
16.2.4. By End User
16.2.5. By Flavor
16.2.6. By Distribution Channel
16.3. Market Attractiveness Analysis
16.3.1. By Country
16.3.2. By Product Type
16.3.3. By Indication
16.3.4. By End User
16.3.5. By Flavor
16.3.6. By Distribution Channel
16.4. Drivers and Restraints: Impact Analysis
17. APEJ Medical Nutrition Market Analysis and Forecast
17.1. Introduction
17.1.1. Basis Point Share (BPS) Analysis By Country
17.1.2. Y-o-Y Growth Projections By Country
17.1.3. Key Regulations
17.2. Medical Nutrition Market Size (Value (US$) and Volume (MT) Analysis (2013-2018) and Forecast (2018-2027)
17.2.1. By Country
17.2.1.1. China
17.2.1.2. India
17.2.1.3. South Korea
17.2.1.4. ASEAN
17.2.2. By Product Type
17.2.3. By Indication
17.2.4. By End User
17.2.5. By Flavor
17.2.6. By Distribution Channel
17.3. Market Attractiveness Analysis
17.3.1. By Country
17.3.2. By Product Type
17.3.3. By Indication
17.3.4. By End User
17.3.5. By Flavor
17.3.6. By Distribution Channel
17.4. Drivers and Restraints: Impact Analysis
18. Japan Medical Nutrition Market Analysis and Forecast
18.1. Introduction
18.1.1. Basis Point Share (BPS) Analysis By Country
18.1.2. Y-o-Y Growth Projections By Country
18.1.3. Key Regulations
18.2. Medical Nutrition Market Size (Value (US$) and Volume (MT) Analysis (2013-2018) and Forecast (2018-2027)
18.2.1. By Product Type
18.2.2. By Indication
18.2.3. By End User
18.2.4. By Flavor
18.2.5. By Distribution Channel
18.3. Market Attractiveness Analysis
18.3.1. By Product Type
18.3.2. By Indication
18.3.3. By End User
18.3.4. By Flavor
18.3.5. By Distribution Channel
18.4. Drivers and Restraints: Impact Analysis
19. Oceania Medical Nutrition Market Analysis and Forecast
19.1. Introduction
19.1.1. Basis Point Share (BPS) Analysis By Country
19.1.2. Y-o-Y Growth Projections By Country
19.1.3. Key Regulations
19.2. Medical Nutrition Market Size (Value (US$) and Volume (MT) Analysis (2013-2018) and Forecast (2018-2027)
19.2.1. By Product Type
19.2.2. By Indication
19.2.3. By End User
19.2.4. By Flavor
19.2.5. By Distribution Channel
19.3. Market Attractiveness Analysis
19.3.1. By Product Type
19.3.2. By Indication
19.3.3. By End User
19.3.4. By Flavor
19.3.5. By Distribution Channel
19.4. Drivers and Restraints: Impact Analysis
20. Middle East and Africa (MEA) Medical Nutrition Market Analysis and Forecast
20.1. Introduction
20.1.1. Basis Point Share (BPS) Analysis By Country
20.1.2. Y-o-Y Growth Projections By Country
20.1.3. Key Regulations
20.2. Medical Nutrition Market Size (Value (US$) and Volume (MT) Analysis (2013-2018) and Forecast (2018-2027)
20.2.1. By Country
20.2.1.1. GCC Countries
20.2.1.2. South Africa
20.2.1.3. North Africa
20.2.1.4. Rest of MEA
20.2.2. By Product Type
20.2.3. By Indication
20.2.4. By End User
20.2.5. By Flavor
20.2.6. By Distribution Channel
20.3. Market Attractiveness Analysis
20.3.1. By Country
20.3.2. By Product Type
20.3.3. By Indication
20.3.4. By End User
20.3.5. By Flavor
20.3.6. By Distribution Channel
20.4. Drivers and Restraints: Impact Analysis
21. Competition Assessment
21.1. Global Medical Nutrition Market Competition - a Dashboard View
21.2. Global Medical Nutrition Market Structure Analysis
21.3. Global Medical Nutrition Market Company Share Analysis
21.3.1. For Tier 1 Market Players, 2017
21.3.2. Company Market Share Analysis of Top 20 Players
21.4. Key Participants Market Presence (Intensity Mapping) by Region
22. Brand Assessment
22.1. Brand Identity (Brand as Product, Brand as Organization, Brand as Person, Brand as Symbol)
22.2. Medical Nutrition Audience and Positioning (Demographic Segmentation, Geographic Segmentation, Psychographic Segmentation, Situational Segmentation)
22.3. Brand Strategy
23. Competition Deep-dive (Manufacturers/Suppliers)
23.1. NUTRICIÓN MÉDICA SL.
23.1.1. Overview
23.1.2. Product Portfolio
23.1.3. Sales Footprint
23.1.4. Channel Footprint
23.1.4.1. Distributors List
23.1.4.2. Sales Channel (Clients)
23.1.5. Strategy Overview
23.1.5.1. Marketing Strategy
23.1.5.2. Culture Strategy
23.1.5.3. Channel Strategy
23.1.6. SWOT Analysis
23.1.7. Financial Analysis
23.1.8. Revenue Share
23.1.8.1. By Product Type
23.1.8.2. By Region
23.1.9. Key Clients
23.1.10. Analyst Comments
23.2. Meiji Holdings Co., Ltd.
23.3. Medtrition Inc.
23.4. Baxter International Inc.
23.5. B. Braun Melsungen AG.
23.6. Fresenius Kabi AG
23.7. Mead Johnson & Company, LLC
23.8. Otsuka Holdings Co., Ltd. (Parent of Otsuka Pharmaceutical) Europe Ltd.
23.9. Abbott Laboratories
23.10. Danone Nutricia
23.11. Victus, Inc.
23.12. Adriaan Goede BV
23.13. Cambrooke Therapeutics, Inc.
23.14. GlaxoSmithKline plc
23.15. Nestlé S.A.
23.16. Kate Farms, Inc.
23.17. Perrigo Company plc
23.18. Sichuan Kelun Pharmaceutical Co., Ltd.
23.19. AYMES International Ltd.
23.20. Others (On Request)
24. Recommendation- Critical Success Factors
25. Research Methodology
26. Assumptions & Acronyms Used
List of Tables
Table 01: Global Medical Nutrition Market Value (US$ Mn) Analysis and Forecast by Region, 2018-2027
Table 02: Global Medical Nutrition Market Volume (MT) Analysis and Forecast by Region, 2018-2027
Table 03: Global Medical Nutrition Market Value (US$ Mn) Analysis and Forecast by Product Type, 2018-2027
Table 04: Global Medical Nutrition Market Volume (MT) Analysis and Forecast by Product Type, 2018-2027
Table 05: Global Medical Nutrition Market Value (US$ Mn) Analysis and Forecast by Indication, 2018-2027
Table 06: Global Medical Nutrition Market Value (US$ Mn) Analysis and Forecast by Indication, 2018-2027
Table 07: Global Medical Nutrition Market Volume (MT) Analysis and Forecast by Indication, 2018-2027
Table 08: Global Medical Nutrition Market Volume (MT) Analysis and Forecast by Indication, 2018-2027
Table 09: Global Medical Nutrition Market Value (US$ Mn) Analysis and Forecast by End User, 2018-2027
Table 10: Global Medical Nutrition Market Volume (MT) Analysis and Forecast by End User, 2018-2027
Table 11: Global Medical Nutrition Market Value (US$) Analysis and Forecast by Flavored Segment, 2018-2027
Table 12: Global Medical Nutrition Market Value (US$) Analysis and Forecast by Flavor, 2018-2027
Table 13: Global Medical Nutrition Market Volume (MT) Analysis and Forecast by Flavored Segment, 2018-2027
Table 14: Global Medical Nutrition Market Volume (MT) Analysis and Forecast by Flavor, 2018-2027
Table 15: Global Medical Nutrition Market Value (US$) Analysis and Forecast by Indirect Segment, 2018-2027
Table 16: Global Medical Nutrition Market Value (US$) Analysis and Forecast by Distribution Channel, 2018-2027
Table 17: Global Medical Nutrition Market Volume (MT) Analysis and Forecast by Indirect Segment, 2018-2027
Table 18: Global Medical Nutrition Market Volume (MT) Analysis and Forecast by Distribution Channel, 2018-2027
Table 19: North America Medical Nutrition Market Value (US$ Mn) Analysis and Forecast by Country, 2018-2027
Table 20: North America Medical Nutrition Market Volume (MT) Analysis and Forecast by Country, 2018-2027
Table 21: North America Medical Nutrition Market Value (US$ Mn) Analysis and Forecast by Product Type, 2018-2027
Table 22: North America Medical Nutrition Market Volume (MT) Analysis and Forecast by Product Type, 2018-2027
Table 23: North America Medical Nutrition Market Value (US$ Mn) Analysis and Forecast by Indication, 2018-2027
Table 24: North America Medical Nutrition Market Value (US$ Mn) Analysis and Forecast by Indication, 2018-2027
Table 25: North America Medical Nutrition Market Volume (MT) Analysis and Forecast by Indication, 2018-2027
Table 26: North America Medical Nutrition Market Volume (MT) Analysis and Forecast by Indication, 2018-2027
Table 27: North America Medical Nutrition Market Value (US$ Mn) Analysis and Forecast by End User, 2018-2027
Table 28: North America Medical Nutrition Market Volume (MT) Analysis and Forecast by End User, 2018-2027
Table 29: North America Medical Nutrition Market Value (US$) Analysis and Forecast by Flavored Segment, 2018-2027
Table 30: North America Medical Nutrition Market Value (US$) Analysis and Forecast by Flavor, 2018-2027
Table 31: North America Medical Nutrition Market Volume (MT) Analysis and Forecast by Flavored Segment, 2018-2027
Table 32: North America Medical Nutrition Market Volume (MT) Analysis and Forecast by Flavor, 2018-2027
Table 33: North America Medical Nutrition Market Value (US$) Analysis and Forecast by Indirect Segment, 2018-2027
Table 34: North America Medical Nutrition Market Value (US$) Analysis and Forecast by Distribution Channel, 2018-2027
Table 35: North America Medical Nutrition Market Volume (MT) Analysis and Forecast by Indirect Segment, 2018-2027
Table 36: North America Medical Nutrition Market Volume (MT) Analysis and Forecast by Distribution Channel, 2018-2027
Table 37: Latin America Medical Nutrition Market Value (US$ Mn) Analysis and Forecast by Country, 2018-2027
Table 38: Latin America Medical Nutrition Market Volume (MT) Analysis and Forecast by Country, 2018-2027
Table 39: Latin America Medical Nutrition Market Value (US$ Mn) Analysis and Forecast by Product Type, 2018-2027
Table 40: Latin America Medical Nutrition Market Volume (MT) Analysis and Forecast by Product Type, 2018-2027
Table 41: Latin America Medical Nutrition Market Value (US$ Mn) Analysis and Forecast by Indication, 2018-2027
Table 42: Latin America Medical Nutrition Market Value (US$ Mn) Analysis and Forecast by Indication, 2018-2027
Table 43: Latin America Medical Nutrition Market Volume (MT) Analysis and Forecast by Indication, 2018-2027
Table 44: Latin America Medical Nutrition Market Volume (MT) Analysis and Forecast by Indication, 2018-2027
Table 45: Latin America Medical Nutrition Market Value (US$ Mn) Analysis and Forecast by End User, 2018-2027
Table 46: Latin America Medical Nutrition Market Volume (MT) Analysis and Forecast by End User, 2018-2027
Table 47: Latin America Medical Nutrition Market Value (US$) Analysis and Forecast by Flavored Segment, 2018-2027
Table 48: Latin America Medical Nutrition Market Value (US$) Analysis and Forecast by Flavor, 2018-2027
Table 49: Latin America Medical Nutrition Market Volume (MT) Analysis and Forecast by Flavored Segment, 2018-2027
Table 50: Latin America Medical Nutrition Market Volume (MT) Analysis and Forecast by Flavor, 2018-2027
Table 51: Latin America Medical Nutrition Market Value (US$) Analysis and Forecast by Indirect Segment, 2018-2027
Table 52: Latin America Medical Nutrition Market Value (US$) Analysis and Forecast by Distribution Channel, 2018-2027
Table 53: Latin America Medical Nutrition Market Volume (MT) Analysis and Forecast by Indirect Segment, 2018-2027
Table 54: Latin America Medical Nutrition Market Volume (MT) Analysis and Forecast by Distribution Channel, 2018-2027
Table 55: Europe Medical Nutrition Market Value (US$ Mn) Analysis and Forecast by Country, 2018-2027
Table 56: Europe Medical Nutrition Market Volume (MT) Analysis and Forecast by Country, 2018-2027
Table 57: Europe Medical Nutrition Market Value (US$ Mn) Analysis and Forecast by Product Type, 2018-2027
Table 58: Europe Medical Nutrition Market Volume (MT) Analysis and Forecast by Product Type, 2018-2027
Table 59: Europe Medical Nutrition Market Value (US$ Mn) Analysis and Forecast by Indication, 2018-2027
Table 60: Europe Medical Nutrition Market Value (US$ Mn) Analysis and Forecast by Indication, 2018-2027
Table 61: Europe Medical Nutrition Market Volume (MT) Analysis and Forecast by Indication, 2018-2027
Table 62: Europe Medical Nutrition Market Volume (MT) Analysis and Forecast by Indication, 2018-2027
Table 63: Europe Medical Nutrition Market Value (US$ Mn) Analysis and Forecast by End User, 2018-2027
Table 64: Europe Medical Nutrition Market Volume (MT) Analysis and Forecast by End User, 2018-2027
Table 65: Europe Medical Nutrition Market Value (US$) Analysis and Forecast by Flavored Segment, 2018-2027
Table 66: Europe Medical Nutrition Market Value (US$) Analysis and Forecast by Flavor, 2018-2027
Table 67: Europe Medical Nutrition Market Volume (MT) Analysis and Forecast by Flavored Segment, 2018-2027
Table 68: Europe Medical Nutrition Market Volume (MT) Analysis and Forecast by Flavor, 2018-2027
Table 69: Europe Medical Nutrition Market Value (US$) Analysis and Forecast by Indirect Segment, 2018-2027
Table 70: Europe Medical Nutrition Market Value (US$) Analysis and Forecast by Distribution Channel, 2018-2027
Table 71: Europe Medical Nutrition Market Volume (MT) Analysis and Forecast by Indirect Segment, 2018-2027
Table 72: Europe Medical Nutrition Market Volume (MT) Analysis and Forecast by Distribution Channel, 2018-2027
Table 73: APAC Medical Nutrition Market Value (US$ Mn) Analysis and Forecast by Country, 2018-2027
Table 74: APAC Medical Nutrition Market Volume (MT) Analysis and Forecast by Country, 2018-2027
Table 75: APAC Medical Nutrition Market Value (US$ Mn) Analysis and Forecast by Product Type, 2018-2027
Table 76: APAC Medical Nutrition Market Volume (MT) Analysis and Forecast by Product Type, 2018-2027
Table 77: APAC Medical Nutrition Market Value (US$ Mn) Analysis and Forecast by Indication, 2018-2027
Table 78: APAC Medical Nutrition Market Value (US$ Mn) Analysis and Forecast by Indication, 2018-2027
Table 79: APAC Medical Nutrition Market Volume (MT) Analysis and Forecast by Indication, 2018-2027
Table 80: APAC Medical Nutrition Market Volume (MT) Analysis and Forecast by Indication, 2018-2027
Table 81: APAC Medical Nutrition Market Value (US$ Mn) Analysis and Forecast by End User, 2018-2027
Table 82: APAC Medical Nutrition Market Volume (MT) Analysis and Forecast by End User, 2018-2027
Table 83: APAC Medical Nutrition Market Value (US$) Analysis and Forecast by Flavored Segment, 2018-2027
Table 84: APAC Medical Nutrition Market Value (US$) Analysis and Forecast by Flavor, 2018-2027
Table 85: APAC Medical Nutrition Market Volume (MT) Analysis and Forecast by Flavored Segment, 2018-2027
Table 86: APAC Medical Nutrition Market Volume (MT) Analysis and Forecast by Flavor, 2018-2027
Table 87: APAC Medical Nutrition Market Value (US$) Analysis and Forecast by Indirect Segment, 2018-2027
Table 88: APAC Medical Nutrition Market Value (US$) Analysis and Forecast by Distribution Channel, 2018-2027
Table 89: APAC Medical Nutrition Market Volume (MT) Analysis and Forecast by Indirect Segment, 2018-2027
Table 90: APAC Medical Nutrition Market Volume (MT) Analysis and Forecast by Distribution Channel, 2018-2027
Table 91: MEA Medical Nutrition Market Value (US$ Mn) Analysis and Forecast by Country, 2018-2027
Table 92: MEA Medical Nutrition Market Volume (MT) Analysis and Forecast by Country, 2018-2027
Table 93: MEA Medical Nutrition Market Value (US$ Mn) Analysis and Forecast by Product Type, 2018-2027
Table 94: MEA Medical Nutrition Market Volume (MT) Analysis and Forecast by Product Type, 2018-2027
Table 95: MEA Medical Nutrition Market Value (US$ Mn) Analysis and Forecast by Indication, 2018-2027
Table 96: MEA Medical Nutrition Market Value (US$ Mn) Analysis and Forecast by Indication, 2018-2027
Table 97: MEA Medical Nutrition Market Volume (MT) Analysis and Forecast by Indication, 2018-2027
Table 98: MEA Medical Nutrition Market Volume (MT) Analysis and Forecast by Indication, 2018-2027
Table 99: MEA Medical Nutrition Market Value (US$ Mn) Analysis and Forecast by End User, 2018-2027
Table 100: MEA Medical Nutrition Market Volume (MT) Analysis and Forecast by End User, 2018-2027
Table 101: MEA Medical Nutrition Market Value (US$) Analysis and Forecast by Flavored Segment, 2018-2027
Table 102: MEA Medical Nutrition Market Value (US$) Analysis and Forecast by Flavor, 2018-2027
Table 103: MEA Medical Nutrition Market Volume (MT) Analysis and Forecast by Flavored Segment, 2018-2027
Table 104: MEA Medical Nutrition Market Volume (MT) Analysis and Forecast by Flavor, 2018-2027
Table 105: MEA Medical Nutrition Market Value (US$) Analysis and Forecast by Indirect Segment, 2018-2027
Table 106: MEA Medical Nutrition Market Value (US$) Analysis and Forecast by Distribution Channel, 2018-2027
Table 107: MEA Medical Nutrition Market Volume (MT) Analysis and Forecast by Indirect Segment, 2018-2027
Table 108: MEA Medical Nutrition Market Volume (MT) Analysis and Forecast by Distribution Channel, 2018-2027
List of Figures
Figure 01: Global Medical Nutrition Market Value (US$ Mn) by Indication, 2018 & 2027
Figure 02: Global Medical Nutrition Market Value (US$ Mn) by Product Type, 2018 & 2027
Figure 03: Global Medical Nutrition Market Value (US$ Mn) by Flavor, 2018 & 2027
Figure 04: Global Medical Nutrition Market Value (US$ Mn) by End User, 2018 & 2027
Figure 05: Global Medical Nutrition Market Value (US$ Mn) by Distribution Channel, 2018 & 2027
Figure 06: Global Medical Nutrition Market Value (US$ Mn) by Region, 2018 & 2027
Figure 07: Global Medical Nutrition Market Share (%) & BPS Analysis by Region, 2018 & 2027
Figure 08: Global Medical Nutrition Market Y-o-Y Growth Rate (%) by Region, 2018–2027
Figure 09: Global Medical Nutrition Market Value (US$ Mn) Analysis & Forecast by Region, 2018–2027
Figure 10: Global Medical Nutrition Market Volume (MT) Analysis & Forecast by Region, 2018–2027
Figure 11: Global Medical Nutrition Market Share (%) & BPS Analysis by Product Type, 2018 & 2027
Figure 12: Global Medical Nutrition Market Y-o-Y Growth Rate (%) by Product Type, 2018–2027
Figure 13: Global Medical Nutrition Market Value (US$ Mn) Analysis & Forecast by Product Type, 2018–2027
Figure 14: Global Medical Nutrition Market Volume (MT) Analysis & Forecast by Product Type, 2018–2027
Figure 15: Global Medical Nutrition Market Share (%) & BPS Analysis by Indication, 2018 & 2027
Figure 16: Global Medical Nutrition Market Y-o-Y Growth Rate (%) by Indication, 2018–2027
Figure 17: Global Medical Nutrition Market Share (%) & BPS Analysis by End User, 2018 & 2027
Figure 18: Global Medical Nutrition Market Y-o-Y Growth Rate (%) by End User, 2018–2027
Figure 19: Global Medical Nutrition Market Value (US$ Mn) Analysis & Forecast by End User, 2018–2027
Figure 20: Global Medical Nutrition Market Volume (MT) Analysis & Forecast by End User, 2018–2027
Figure 21: Global Medical Nutrition Market Share (%) & BPS Analysis by Flavor, 2018 & 2027
Figure 22: Global Medical Nutrition Market Y-o-Y Growth Rate (%) by Flavor, 2018–2027
Figure 23: Global Medical Nutrition Market Value (US$ Mn) Analysis & Forecast by Flavor, 2018–2027
Figure 24: Global Medical Nutrition Market Volume (MT) Analysis & Forecast by Flavor, 2018–2027
Figure 25: Global Medical Nutrition Market Share (%) & BPS Analysis by Distribution Channel, 2018 & 2027
Figure 26: Global Medical Nutrition Market Y-o-Y Growth Rate (%) by Distribution Channel, 2018–2027
Figure 27: Global Medical Nutrition Market Value (US$ Mn) Analysis & Forecast by Distribution Channel, 2018–2027
Figure 28: Global Medical Nutrition Market Volume (MT) Analysis & Forecast by Distribution Channel, 2018–2027
Figure 29: Global Medical Nutrition Market Attractiveness Index by Product Type, 2018–2027
Figure 30: Global Medical Nutrition Market Attractiveness Index by Flavor, 2018–2027
Figure 31: Global Medical Nutrition Market Attractiveness Index by Indication, 2018–2027
Figure 32: Global Medical Nutrition Market Attractiveness Index by End User, 2018–2027
Figure 33: Global Medical Nutrition Market Attractiveness Index by Distribution Channel, 2018–2027
Figure 34: Global Medical Nutrition Market Attractiveness Index by Region, 2018–2027
Figure 35: North America Medical Nutrition Market Value (US$ Mn) by Indication, 2018 & 2027
Figure 36: North America Medical Nutrition Market Value (US$ Mn) by Product Type, 2018 & 2027
Figure 37: North America Medical Nutrition Market Value (US$ Mn) by Flavor, 2018 & 2027
Figure 38: North America Medical Nutrition Market Value (US$ Mn) by End User, 2018 & 2027
Figure 39: North America Medical Nutrition Market Value (US$ Mn) by Distribution Channel, 2018 & 2027
Figure 40: North America Medical Nutrition Market Value (US$ Mn) by Country, 2018 & 2027
Figure 41: North America Medical Nutrition Market Share (%) & BPS Analysis by Country, 2018 & 2027
Figure 42: North America Medical Nutrition Market Y-o-Y Growth Rate (%) by Country, 2018–2027
Figure 43: North America Medical Nutrition Market Value (US$ Mn) Analysis & Forecast by Country, 2018–2027
Figure 44: North America Medical Nutrition Market Volume (MT) Analysis & Forecast by Country, 2018–2027
Figure 45: North America Medical Nutrition Market Share (%) & BPS Analysis by Product Type, 2018 & 2027
Figure 46: North America Medical Nutrition Market Y-o-Y Growth Rate (%) by Product Type, 2018–2027
Figure 47: North America Medical Nutrition Market Share (%) & BPS Analysis by Indication, 2018 & 2027
Figure 48: North America Medical Nutrition Market Y-o-Y Growth Rate (%) by Indication, 2018–2027
Figure 49: North America Medical Nutrition Market Share (%) & BPS Analysis by End User, 2018 & 2027
Figure 50: North America Medical Nutrition Market Y-o-Y Growth Rate (%) by End User, 2018–2027
Figure 51: North America Medical Nutrition Market Share (%) & BPS Analysis by Flavor, 2018 & 2027
Figure 52: North America Medical Nutrition Market Y-o-Y Growth Rate (%) by Flavor, 2018–2027
Figure 53: North America Medical Nutrition Market Share (%) & BPS Analysis by Distribution Channel, 2018 & 2027
Figure 54: North America Medical Nutrition Market Y-o-Y Growth Rate (%) by Distribution Channel, 2018–2027
Figure 55: North America Medical Nutrition Market Attractiveness Index by Product Type, 2018–2027
Figure 56: North America Medical Nutrition Market Attractiveness Index by Flavor, 2018–2027
Figure 57: North America Medical Nutrition Market Attractiveness Index by Indication, 2018–2027
Figure 58: North America Medical Nutrition Market Attractiveness Index by End User, 2018–2027
Figure 59: North America Medical Nutrition Market Attractiveness Index by Distribution Channel, 2018–2027
Figure 60: North America Medical Nutrition Market Attractiveness Index by Region, 2018–2027
Figure 61: Latin America Medical Nutrition Market Value (US$ Mn) by Indication, 2018 & 2027
Figure 62: Latin America Medical Nutrition Market Value (US$ Mn) by Product Type, 2018 & 2027
Figure 63: Latin America Medical Nutrition Market Value (US$ Mn) by Flavor, 2018 & 2027
Figure 64: Latin America Medical Nutrition Market Value (US$ Mn) by End User, 2018 & 2027
Figure 65: Latin America Medical Nutrition Market Value (US$ Mn) by Distribution Channel, 2018 & 2027
Figure 66: Latin America Medical Nutrition Market Value (US$ Mn) by Country, 2018 & 2027
Figure 67: Latin America Medical Nutrition Market Share (%) & BPS Analysis by Country, 2018 & 2027
Figure 68: Latin America Medical Nutrition Market Y-o-Y Growth Rate (%) by Country, 2018–2027
Figure 69: Latin America Medical Nutrition Market Value (US$ Mn) Analysis & Forecast by Country, 2018–2027
Figure 70: Latin America Medical Nutrition Market Volume (MT) Analysis & Forecast by Country, 2018–2027
Figure 71: Latin America Medical Nutrition Market Share (%) & BPS Analysis by Product Type, 2018 & 2027
Figure 72: Latin America Medical Nutrition Market Y-o-Y Growth Rate (%) by Product Type, 2018–2027
Figure 73: Latin America Medical Nutrition Market Share (%) & BPS Analysis by Indication, 2018 & 2027
Figure 74: Latin America Medical Nutrition Market Y-o-Y Growth Rate (%) by Indication, 2018–2027
Figure 75: Latin America Medical Nutrition Market Share (%) & BPS Analysis by End User, 2018 & 2027
Figure 76: Latin America Medical Nutrition Market Y-o-Y Growth Rate (%) by End User, 2018–2027
Figure 77: Latin America Medical Nutrition Market Share (%) & BPS Analysis by Flavor, 2018 & 2027
Figure 78: Latin America Medical Nutrition Market Y-o-Y Growth Rate (%) by Flavor, 2018–2027
Figure 79: Latin America Medical Nutrition Market Share (%) & BPS Analysis by Distribution Channel, 2018 & 2027
Figure 80: Latin America Medical Nutrition Market Y-o-Y Growth Rate (%) by Distribution Channel, 2018–2027
Figure 81: Latin America Medical Nutrition Market Attractiveness Index by Product Type, 2018–2027
Figure 82: Latin America Medical Nutrition Market Attractiveness Index by Flavor, 2018–2027
Figure 83: Latin America Medical Nutrition Market Attractiveness Index by Indication, 2018–2027
Figure 84: Latin America Medical Nutrition Market Attractiveness Index by End User, 2018–2027
Figure 85: Latin America Medical Nutrition Market Attractiveness Index by Distribution Channel, 2018–2027
Figure 86: Latin America Medical Nutrition Market Attractiveness Index by Region, 2018–2027
Figure 87: Europe Medical Nutrition Market Value (US$ Mn) by Indication, 2018 & 2027
Figure 88: Europe Medical Nutrition Market Value (US$ Mn) by Product Type, 2018 & 2027
Figure 89: Europe Medical Nutrition Market Value (US$ Mn) by Flavor, 2018 & 2027
Figure 90: Europe Medical Nutrition Market Value (US$ Mn) by End User, 2018 & 2027
Figure 91: Europe Medical Nutrition Market Value (US$ Mn) by Distribution Channel, 2018 & 2027
Figure 92: Europe America Medical Nutrition Market Value (US$ Mn) by Country, 2018 & 2027
Figure 93: Europe Medical Nutrition Market Share (%) & BPS Analysis by Country, 2018 & 2027
Figure 94: Europe Medical Nutrition Market Y-o-Y Growth Rate (%) by Country, 2018–2027
Figure 95: Europe Medical Nutrition Market Value (US$ Mn) Analysis & Forecast by Country, 2018–2027
Figure 96: Europe Medical Nutrition Market Volume (MT) Analysis & Forecast by Country, 2018–2027
Figure 97: Europe Medical Nutrition Market Share (%) & BPS Analysis by Product Type, 2018 & 2027
Figure 98: Europe Medical Nutrition Market Y-o-Y Growth Rate (%) by Product Type, 2018–2027
Figure 99: Europe Medical Nutrition Market Share (%) & BPS Analysis by Indication, 2018 & 2027
Figure 100: Europe Medical Nutrition Market Y-o-Y Growth Rate (%) by Indication, 2018–2027
Figure 101: Europe Medical Nutrition Market Share (%) & BPS Analysis by End User, 2018 & 2027
Figure 102: Europe Medical Nutrition Market Y-o-Y Growth Rate (%) by End User, 2018–2027
Figure 103: Europe Medical Nutrition Market Share (%) & BPS Analysis by Flavor, 2018 & 2027
Figure 104: Europe Medical Nutrition Market Y-o-Y Growth Rate (%) by Flavor, 2018–2027
Figure 105: Europe Medical Nutrition Market Share (%) & BPS Analysis by Distribution Channel, 2018 & 2027
Figure 106: Europe Medical Nutrition Market Y-o-Y Growth Rate (%) by Distribution Channel, 2018–2027
Figure 107: Europe Medical Nutrition Market Attractiveness Index by Product Type, 2018–2027
Figure 108: Europe Medical Nutrition Market Attractiveness Index by Flavor, 2018–2027
Figure 109: Europe Medical Nutrition Market Attractiveness Index by Indication, 2018–2027
Figure 110: Europe Medical Nutrition Market Attractiveness Index by End User, 2018–2027
Figure 111: Europe Medical Nutrition Market Attractiveness Index by Distribution Channel, 2018–2027
Figure 112: Europe Medical Nutrition Market Attractiveness Index by Region, 2018–2027
Figure 113: Asia Pacific Medical Nutrition Market Value (US$ Mn) by Indication, 2018 & 2027
Figure 114: Asia Pacific Medical Nutrition Market Value (US$ Mn) by Product Type, 2018 & 2027
Figure 115: Asia Pacific Medical Nutrition Market Value (US$ Mn) by Flavor, 2018 & 2027
Figure 116: Asia Pacific Medical Nutrition Market Value (US$ Mn) by End User, 2018 & 2027
Figure 117: Asia Pacific Medical Nutrition Market Value (US$ Mn) by Distribution Channel, 2018 & 2027
Figure 118: Asia Pacific Medical Nutrition Market Value (US$ Mn) by Country, 2018 & 2027
Figure 119: APAC Medical Nutrition Market Share (%) & BPS Analysis by Country, 2018 & 2027
Figure 120: APAC Medical Nutrition Market Y-o-Y Growth Rate (%) by Country, 2018–2027
Figure 121: APAC Medical Nutrition Market Value (US$ Mn) Analysis & Forecast by Country, 2018–2027
Figure 122: APAC Medical Nutrition Market Volume (MT) Analysis & Forecast by Country, 2018–2027
Figure 123: APAC Medical Nutrition Market Share (%) & BPS Analysis by Product Type, 2018 & 2027
Figure 124: APAC Medical Nutrition Market Y-o-Y Growth Rate (%) by Product Type, 2018–2027
Figure 125: APAC Medical Nutrition Market Share (%) & BPS Analysis by Indication, 2018 & 2027
Figure 126: APAC Medical Nutrition Market Y-o-Y Growth Rate (%) by Indication, 2018–2027
Figure 127: APAC Medical Nutrition Market Share (%) & BPS Analysis by End User, 2018 & 2027
Figure 128: APAC Medical Nutrition Market Y-o-Y Growth Rate (%) by End User, 2018–2027
Figure 129: APAC Medical Nutrition Market Share (%) & BPS Analysis by Flavor, 2018 & 2027
Figure 130: APAC Medical Nutrition Market Y-o-Y Growth Rate (%) by Flavor, 2018–2027
Figure 131: APAC Medical Nutrition Market Share (%) & BPS Analysis by Distribution Channel, 2018 & 2027
Figure 132: APAC Medical Nutrition Market Y-o-Y Growth Rate (%) by Distribution Channel, 2018–2027
Figure 133: APAC Medical Nutrition Market Attractiveness Index by Product Type, 2018–2027
Figure 134: APAC Medical Nutrition Market Attractiveness Index by Flavor, 2018–2027
Figure 135: APAC Medical Nutrition Market Attractiveness Index by Indication, 2018–2027
Figure 136: APAC Medical Nutrition Market Attractiveness Index by End User, 2018–2027
Figure 137: APAC Medical Nutrition Market Attractiveness Index by Distribution Channel, 2018–2027
Figure 138: APAC Medical Nutrition Market Attractiveness Index by Region, 2018–2027
Figure 139: Middle East & Africa Medical Nutrition Market Value (US$ Mn) by Indication, 2018 & 2027
Figure 140: Middle East & Africa Medical Nutrition Market Value (US$ Mn) by Product Type, 2018 & 2027
Figure 141: Middle East & Africa Medical Nutrition Market Value (US$ Mn) by Flavor, 2018 & 2027
Figure 142: Middle East & Africa Medical Nutrition Market Value (US$ Mn) by End User, 2018 & 2027
Figure 143: Middle East & Africa Medical Nutrition Market Value (US$ Mn) by Distribution Channel, 2018 & 2027
Figure 144: Middle East & Africa Medical Nutrition Market Value (US$ Mn) by Country, 2018 & 2027
Figure 145: MEA Medical Nutrition Market Share (%) & BPS Analysis by Country, 2018 & 2027
Figure 146: MEA Medical Nutrition Market Y-o-Y Growth Rate (%) by Country, 2018–2027
Figure 147: MEA Medical Nutrition Market Value (US$ Mn) Analysis & Forecast by Country, 2018–2027
Figure 148: MEA Medical Nutrition Market Volume (MT) Analysis & Forecast by Country, 2018–2027
Figure 149: MEA Medical Nutrition Market Share (%) & BPS Analysis by Product Type, 2018 & 2027
Figure 150: MEA Medical Nutrition Market Y-o-Y Growth Rate (%) by Product Type, 2018–2027
Figure 151: MEA Medical Nutrition Market Share (%) & BPS Analysis by Indication, 2018 & 2027
Figure 152: MEA Medical Nutrition Market Y-o-Y Growth Rate (%) by Indication, 2018–2027
Figure 153: MEA Medical Nutrition Market Share (%) & BPS Analysis by End User, 2018 & 2027
Figure 154: MEA Medical Nutrition Market Y-o-Y Growth Rate (%) by End User, 2018–2027
Figure 155: MEA Medical Nutrition Market Share (%) & BPS Analysis by Flavor, 2018 & 2027
Figure 156: MEA Medical Nutrition Market Y-o-Y Growth Rate (%) by Flavor, 2018–2027
Figure 157: MEA Medical Nutrition Market Share (%) & BPS Analysis by Distribution Channel, 2018 & 2027
Figure 158: MEA Medical Nutrition Market Y-o-Y Growth Rate (%) by Distribution Channel, 2018–2027
Figure 159: MEA Medical Nutrition Market Attractiveness Index by Product Type, 2018–2027
Figure 160: MEA Medical Nutrition Market Attractiveness Index by Flavor, 2018–2027
Figure 161: MEA Medical Nutrition Market Attractiveness Index by Indication, 2018–2027
Figure 162: MEA Medical Nutrition Market Attractiveness Index by End User, 2018–2027
Figure 163: MEA Medical Nutrition Market Attractiveness Index by Distribution Channel, 2018–2027
Figure 164: MEA Medical Nutrition Market Attractiveness Index by Region, 2018–2027
Copyright © Transparency Market Research, Inc. All Rights reserved
Trust Online

Medical Nutrition Market Outlook, 2018-2027