
Reports
Reports
The increase in the prevalence of road accidents, sports injuries, and osteoporosis may prove as gaining factors for the medical dynamometer market across the forecast period of 2018-2026. The growing use of medical dynamometers in rehabilitation centers for musculoskeletal injuries and disorders is also proving to be beneficial for the medical dynamometer market. Medical dynamometers assist in pain management and moment restoration, thus, increasing the recovery speed from disorders by acute and chronic pain. Based on product, the medical dynamometer market can be classified into chest dynamometer, pinch gauge, push-pull dynamometer, squeeze dynamometer, and others.
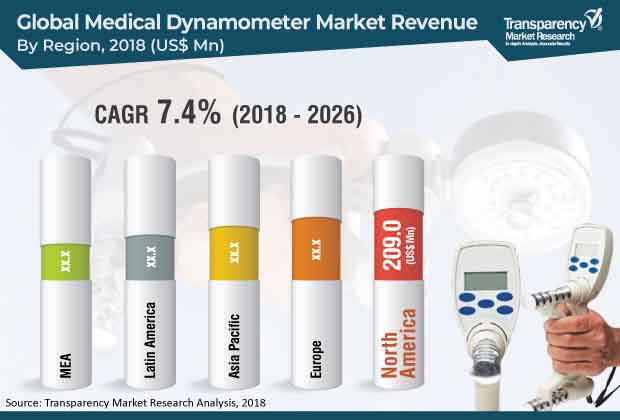
The global medical dynamometer market is driven by increase in the number of surgeries and rise in prevalence of bone injuries. The global market was valued at US$ 522.3 Mn in 2017 and is projected to reach US$ 984.6 Mn by 2026 at a CAGR of 7.4% from 2018 to 2026 owing to increase in the geriatric population.
Medical dynamometers are devices that measure the strength of different muscle groups along with bones and neurons. These also provide resistance that matches a patient's requirement such as treatment for weakness, pain, or fatigue at specific points. These devices are utilized for clinical decision making and outcome evaluation of pathologies such as tendon injury of the hand, carpal tunnel syndrome, neuromuscular disorder, and nerve injury. These provide an accurate and objective data which is required for reimbursable rehabilitation services.
High prevalence of orthopedic surgeries, arthritic patients, rise in ergonomic health approaches, increase in research and development initiatives, and surge in demand for diagnostic devices fuel the growth of the global medical dynamometer market.
The global medical dynamometer market has been segmented based on product, operation, application, end-user, and region. In terms of product, the market has been classified into squeeze dynamometer, pinch gauge, hand dynamometer, chest dynamometer, push-pull dynamometer, and others. The hand dynamometer segment accounted for major share of the global market in terms of revenue in 2017. The segment is projected to expand at a high CAGR during the forecast period. The segment is anticipated to gain significant market share by 2026.
Based on operation, the global medical dynamometer market has been bifurcated into electronic and mechanical. The electronic segment is expected to expand at a higher CAGR from 2018 to 2026. Availability of new and innovative devices in the market and increase in preference for digital electronic devices are likely to drive the segment during the forecast period.
In terms of application, the global medical dynamometer market has been categorized into orthopedic, neurology, cardiology, medical trauma, and others. The orthopedic segment is projected to expand at a high CAGR from 2018 to 2026 owing to rise in incidence of rupture tendons such as Achilles tendon rupture globally. Increase in sports injuries is also anticipated to propel the orthopedic segment during the forecast period.
In terms of end-user, the global medical dynamometer market has been divided into hospitals, rehabilitation centers, physiotherapy clinics, and others. The hospitals segment accounted for a leading share of the market in 2017. Adoption of new generation dynamometers such as System 4 Pro is likely to augment the segment.
In terms of region, the global medical dynamometer market has been segmented into North America, Latin America, Europe, Asia Pacific, and Middle East & Africa. North America dominated the global market in 2017. It is projected to lose market share by 2026. The region’s dominance is attributed to increase in sports activity and rise in number of accidents. Early-phase diagnosis of arthritis and treatment of tendon surgeries or therapy drive the medical biotechnology market, which in turn is expected to propel the medical dynamometer market in North America.
Europe has favorable government policies regarding health care infrastructure and awareness programs for arthritis population. The market in Asia Pacific is expected to grow at a rapid pace due to rise in population, change in lifestyle, increase in number of accidents, and surge in per capita expenditure. Additionally, economic growth and rise in distribution channels support health care infrastructure improvement in developing countries such as India and China. These factors collectively support the growth of the market in Asia Pacific.
Companies such as JTECH Medical Industries, Inc., Hausmann Industries, 3B Scientific, Fabrication Enterprises, Inc., KERN & SOHN GmbH, Charder Electronic Co, Ltd., Marsden Weighing Group, North Coast Medical Inc., and JLW Instruments accounted for major share of the global medical dynamometer market in 2017. North Coast Medical, Inc. is a manufacturer, supplier, and distributor of rehabilitation medical care products. The company has over 40 years of experience in manufacturing and distribution. It offers a broad product portfolio of rehabilitation medical care.
Companies are adopting the strategy of acquisition and collaboration with parallel companies in order to improve and strengthen geographic presence in the global market. In March 2014, North Coast Medical, Inc. acquired ActivaTek, Inc. to expand business in the pain management segment. In May 2016, Charder Electronic Co, Ltd. announced a new distributor (Charder North America) in North America. Charder North America will help to increase Charder Electronic’s revenue from North America and bring more accessibility to the current customers and serve many new customers.
1. Preface
1.1. Market Definition and Scope
1.2. Market Segmentation
1.3. Key Research Objectives
1.4. Research Highlights
2. Assumptions and Research Methodology
3. Executive Summary: Global Medical Dynamometer Market
4. Market Overview
4.1. Introduction
4.1.1. Definition
4.1.2. Industry Evolution/Developments
4.2. Overview
4.3. Market Dynamics
4.3.1. Drivers
4.3.2. Restraints
4.3.3. Opportunities
4.4. Global Medical Dynamometer Market Analysis and Forecasts, 2016–2026
4.4.1. Market Revenue Projections (US$ Mn)
4.5. Porter’s Five Force Analysis
5. Market Outlook
5.1.1. Premium Insights
5.1.1.1. Product Mapping
5.1.1.2. Price Comparison Analysis (2018)
5.1.1.3.Technological Advancements
5.1.1.4. Key product/brand Analysis
6. Global Medical Dynamometer Market Analysis and Forecasts, by Product
6.1. Introduction & Definition
6.2. Key Trends
6.3. Market Value Forecast, by Product, 2016–2026
6.3.1. Squeeze Dynamometer
6.3.2. Pinch Gauge
6.3.3. Hand Dynamometer
6.3.4. Chest Dynamometer
6.3.5. Push-pull Dynamometer
6.3.6. Others
6.4. Market Attractiveness By Product
7. Global Medical Dynamometer Market Analysis and Forecasts, by Operation
7.1. Introduction & Definition
7.2. Key Trends
7.3. Market Value Forecast, by Operation, 2016–2026
7.3.1. Electronic
7.3.2. Mechanical
7.4. Market Attractiveness, by Operation
8. Global Medical Dynamometer Market Analysis and Forecasts, by Application
8.1. Introduction & Definition
8.2. Key Trends
8.3. Market Value Forecast, by Application, 2016–2026
8.3.1. Orthopedic
8.3.2. Neurology
8.3.3. Cardiology
8.3.4. Medical Trauma
8.3.5. Others
8.4. Market Attractiveness, by Application
9. Global Medical Dynamometer Market Analysis and Forecasts, by End-user
9.1. Introduction & Definition
9.2. Key Trends
9.3. Market Value Forecast, by End-user, 2016–2026
9.3.1. Hospitals
9.3.2. Rehabilitation Centers
9.3.3. Physiotherapy Clinics
9.3.4. Others
9.4. Market Attractiveness, by End-user
10. Global Medical Dynamometer Market Analysis and Forecasts, by Region
10.1. Key Trends
10.2. Market Value Forecast, by Region
10.2.1. North America
10.2.2. Europe
10.2.3. Asia Pacific
10.2.4. Latin America
10.2.5. Middle East & Africa
10.3. Market Attractiveness, by Country/Region
11. North America Medical Dynamometer Market Analysis and Forecast
11.1.Introduction
11.1.1. Key Trends
11.2.Market Value Forecast, by Product, 2016–2026
11.2.1. Squeeze Dynamometer
11.2.2. Pinch Gauge
11.2.3. Hand Dynamometer
11.2.4. Chest Dynamometer
11.2.5. Push-pull Dynamometer
11.2.6. Others
11.3.Market Value Forecast, by Operation, 2016–2026
11.3.1. Electronic
11.3.2. Mechanical
11.4.Market Value Forecast, by Application, 2016–2026
11.4.1. Orthopedic
11.4.2. Neurology
11.4.3. Cardiology
11.4.4. Medical Trauma
11.4.5. Others
11.5.Market Value Forecast, by End-user, 2016–2026
11.5.1. Hospitals
11.5.2. Rehabilitation Centers
11.5.3. Physiotherapy Clinics
11.5.4. Others
11.6.Market Value Forecast, by Country, 2016–2026
11.6.1. U.S.
11.6.2. Canada
11.7.Market Attractiveness Analysis
11.7.1. By Product
11.7.2. By Operation
11.7.3. By Application
11.7.4. By End-user
11.7.5. By Country
12. Europe Medical Dynamometer Market Analysis and Forecast
12.1.Introduction
12.1.1. Key Trends
12.2.Market Value Forecast, by Product, 2016–2026
12.2.1. Squeeze Dynamometer
12.2.2. Pinch Gauge
12.2.3. Hand Dynamometer
12.2.4. Chest Dynamometer
12.2.5. Push-pull Dynamometer
12.2.6. Others
12.3.Market Value Forecast, by Operation, 2016–2026
12.3.1. Electronic
12.3.2. Mechanical
12.4.Market Value Forecast, by Application, 2016–2026
12.4.1. Orthopedic
12.4.2. Neurology
12.4.3. Cardiology
12.4.4. Medical Trauma
12.4.5. Others
12.5.Market Value Forecast, by End-user, 2016–2026
12.5.1. Hospitals
12.5.2. Rehabilitation Centers
12.5.3. Physiotherapy Clinics
12.5.4. Others
12.6.Market Value Forecast, by Country/Sub-region, 2016–2026
12.6.1. U.K.
12.6.2. Germany
12.6.3. France
12.6.4. Italy
12.6.5. Spain
12.6.6. Rest of Europe
12.7.Market Attractiveness Analysis
12.7.1. By Product
12.7.2. By Operation
12.7.3. By Application
12.7.4. By End-user
12.7.5. By Country/Sub-region
13. Asia Pacific Medical Dynamometer Market Analysis and Forecast
13.1.Introduction
13.2.Market Value Forecast, by Product, 2016–2026
13.2.1. Squeeze Dynamometer
13.2.2. Pinch Gauge
13.2.3. Hand Dynamometer
13.2.4. Chest Dynamometer
13.2.5. Push-pull Dynamometer
13.2.6. Others
13.3.Market Value Forecast, by Operation, 2016–2026
13.3.1. Electronic
13.3.2. Mechanical
13.4.Market Value Forecast, by Application, 2016–2026
13.4.1. Orthopedic
13.4.2. Neurology
13.4.3. Cardiology
13.4.4. Medical Trauma
13.4.5. Others
13.5.Market Value Forecast, by End-user, 2016–2026
13.5.1. Hospitals
13.5.2. Rehabilitation Centers
13.5.3. Physiotherapy Clinics
13.5.4. Others
13.6.Market Value Forecast, by Country/Sub-region, 2016–2026
13.6.1. China
13.6.2. Japan
13.6.3. India
13.6.4. Australia & New Zealand
13.6.5. Rest of Asia Pacific
13.7.Market Attractiveness Analysis
13.7.1. By Product
13.7.2. By Operation
13.7.3. By Application
13.7.4. By End-user
13.7.5. By Country/Sub-region
14. Latin America Medical Dynamometer Market Analysis and Forecast
14.1.Introduction
14.2.Market Value Forecast, by Product, 2016–2026
14.2.1. Squeeze Dynamometer
14.2.2. Pinch Gauge
14.2.3. Hand Dynamometer
14.2.4. Chest Dynamometer
14.2.5. Push-pull Dynamometer
14.2.6. Others
14.3.Market Value Forecast, by Operation, 2016–2026
14.3.1. Electronic
14.3.2. Mechanical
14.4.Market Value Forecast, by Application, 2016–2026
14.4.1. Orthopedic
14.4.2. Neurology
14.4.3. Cardiology
14.4.4. Medical Trauma
14.4.5. Others
14.5.Market Value Forecast, by End-user, 2016–2026
14.5.1. Hospitals
14.5.2. Rehabilitation Centers
14.5.3. Physiotherapy Clinics
14.5.4. Others
14.6.Market Value Forecast, by Country/Sub-region, 2016–2026
14.6.1. Brazil
14.6.2. Mexico
14.6.3. Rest of Latin America
14.7.Market Attractiveness Analysis
14.7.1. By Product
14.7.2. By Operation
14.7.3. By Application
14.7.4. By End-user
14.7.5. By Country/Sub-region
15. Middle East & Africa Medical Dynamometer Market Analysis and Forecast
15.1.Introduction
15.2.Market Value Forecast, by Product, 2016–2026
15.2.1. Squeeze Dynamometer
15.2.2. Pinch Gauge
15.2.3. Hand Dynamometer
15.2.4. Chest Dynamometer
15.2.5. Push-pull Dynamometer
15.2.6. Others
15.3.Market Value Forecast, by Operation, 2016–2026
15.3.1. Electronic
15.3.2. Mechanical
15.4.Market Value Forecast, by Application, 2016–2026
15.4.1. Orthopedic
15.4.2. Neurology
15.4.3. Cardiology
15.4.4. Medical Trauma
15.4.5. Others
15.5.Market Value Forecast, by End-user, 2016–2026
15.5.1. Hospitals
15.5.2. Rehabilitation Centers
15.5.3. Physiotherapy Clinics
15.5.4. Others
15.6.Market Value Forecast, by Country/Sub-region, 2016–2026
15.6.1. GCC Countries
15.6.2. South Africa
15.6.3. Rest of Middle East & Africa
15.7.Market Attractiveness Analysis
15.7.1. By Product
15.7.2. By Operation
15.7.3. By Application
15.7.4. By End-user
15.7.5. By Country/Sub-region
16. Competition Landscape
16.1.Market Performance in Physiotherapy Field, by Company, 2017
16.2. Company Profiles
16.2.1. JTECH Medical Industries, Inc.
16.2.2. Hausmann Industries
16.2.3. 3B Scientific
16.2.4. Fabrication Enterprises, Inc.
16.2.5. KERN & SOHN GmbH
16.2.6. Charder Electronic Co, Ltd.
16.2.7. Marsden Weighing Group
16.2.8. North Coast Medical Inc.
16.2.9. JLW Instruments
List of Tables
Table 01: Global Medical Dynamometer Market Value (US$ Mn) Forecast, by Product, 2016–2026
Table 02: Global Medical Dynamometer Market Value (US$ Mn) Forecast, by Operation, 2016–2026
Table 03: Global Medical Dynamometer Market Value (US$ Mn) Forecast, by Application, 2016–2026
Table 04: Global Medical Dynamometer Market Value (US$ Mn) Forecast, by End-user, 2016–2026
Table 05: Global Medical Dynamometer Market Value (US$ Mn) Forecast, by Region, 2016–2026
Table 06: North America Medical Dynamometer Market Value (US$ Mn) Forecast, by Country, 2016–2026
Table 07: North America Medical Dynamometer Market Value (US$ Mn) Forecast, by Product, 2016–2026
Table 08: North America Medical Dynamometer Market Value (US$ Mn) Forecast, by Operation, 2016–2026
Table 09: North America Medical Dynamometer Market Value (US$ Mn) Forecast, by Application, 2016–2026
Table 10: North America Medical Dynamometer Market Value (US$ Mn) Forecast, by End-user, 2016–2026
Table 11: Europe Medical Dynamometer Market Value (US$ Mn) Forecast, by Country/Sub-region, 2016–2026
Table 12: Europe Medical Dynamometer Market Value (US$ Mn) Forecast, by Product, 2016–2026
Table 13: Europe Medical Dynamometer Market Value (US$ Mn) Forecast, by Operation, 2016–2026
Table 14: Europe Medical Dynamometer Market Value (US$ Mn) Forecast, by Application, 2016–2026
Table 15: Europe Medical Dynamometer Market Value (US$ Mn) Forecast, by End-user, 2016–2026
Table 16: Asia Pacific Medical Dynamometer Market Value (US$ Mn) Forecast, by Country/Sub-region, 2016–2026
Table 17: Asia Pacific Medical Dynamometer Market Value (US$ Mn) Forecast, by Product, 2016–2026
Table 18: Asia Pacific Medical Dynamometer Market Value (US$ Mn) Forecast, by Operation, 2016–2026
Table 19: Asia Pacific Medical Dynamometer Market Value (US$ Mn) Forecast, by Application, 2016–2026
Table 20: Asia Pacific Medical Dynamometer Market Value (US$ Mn) Forecast, by Distribution Channel, 2016–2026
Table 21: Latin America Medical Dynamometer Market Value (US$ Mn) Forecast, by Country/Sub-region, 2016–2026
Table 22: Latin America Medical Dynamometer Market Value (US$ Mn) Forecast, by Product, 2016–2026
Table 23: Latin America Medical Dynamometer Market Value (US$ Mn) Forecast, by Operation, 2016–2026
Table 24: Latin America Medical Dynamometer Market Value (US$ Mn) Forecast, by Application, 2016–2026
Table 25: Latin America Medical Dynamometer Market Value (US$ Mn) Forecast, by End-user, 2016–2026
Table 26: Middle East & Africa Medical Dynamometer Market Value (US$ Mn) Forecast, by Country/Sub-region, 2016–2026
Table 27: Middle East & Africa Medical Dynamometer Market Value (US$ Mn) Forecast, by Product, 2016–2026
Table 28: Middle East & Africa Medical Dynamometer Market Value (US$ Mn) Forecast, by Operation, 2016–2026
Table 29: Middle East & Africa Medical Dynamometer Market Value (US$ Mn) Forecast, by Application, 2016–2026
Table 30: Middle East & Africa Medical Dynamometer Market Value (US$ Mn) Forecast, by End-user, 2016–2026
List of Figures
Figure 01: Global Medical Dynamometer Market Size (US$ Mn) Forecast and Y-o-Y Growth (%) Projection, 2016–2026
Figure 02: Global Market Value Share, by Product, 2017
Figure 03: Global Market Value Share, by Application, 2017
Figure 04: Global Market Value Share, by End-user, 2017
Figure 05: Global Market Value Share, by Region, 2017
Figure 06: Global Medical Dynamometer Market Value Share, by Product, 2018 and 2026
Figure 07: Global Medical Dynamometer Market Revenue (US$ Mn) and Y-o-Y Growth (%) Forecast, by Squeeze Dynamometer, 2016–2026
Figure 08: Global Medical Dynamometer Market Revenue (US$ Mn) and Y-o-Y Growth (%) Forecast, by Pinch Gauge, 2016–2026
Figure 09: Global Medical Dynamometer Market Revenue (US$ Mn) and Y-o-Y Growth (%) Forecast, by Hand Dynamometer, 2016–2026
Figure 10: Global Medical Dynamometer Market Revenue (US$ Mn) and Y-o-Y Growth (%) Forecast, by Chest Dynamometer, 2016–2026
Figure 11: Global Medical Dynamometer Market Revenue (US$ Mn) and Y-o-Y Growth (%) Forecast, by Push-pull Dynamometer, 2016–2026
Figure 12: Global Medical Dynamometer Market Revenue (US$ Mn) and Y-o-Y Growth (%) Forecast, by Others, 2016–2026
Figure 13: Global Medical Dynamometer Market Attractiveness, by Product, 2018–2026
Figure 14: Global Medical Dynamometer Market Value Share, by Operation, 2018 and 2026
Figure 15: Global Medical Dynamometer Market Attractiveness, by Operation, 2018–2026
Figure 16: Global Medical Dynamometer Market Revenue (US$ Mn) and Y-o-Y Growth (%) Forecast, by Electronic, 2016–2026
Figure 17: Global Medical Dynamometer Market Revenue (US$ Mn) and Y-o-Y Growth (%) Forecast, by Mechanical, 2016–2026
Figure 18: Global Medical Dynamometer Market Value Share, by Application, 2018 and 2026
Figure 19: Global Medical Dynamometer Market Revenue (US$ Mn) and Y-o-Y Growth (%) Forecast, by Orthopedic, 2016–2026
Figure 20: Global Medical Dynamometer Market Revenue (US$ Mn) and Y-o-Y Growth (%) Forecast, by Neurology, 2016–2026
Figure 21: Global Medical Dynamometer Market Revenue (US$ Mn) and Y-o-Y Growth (%) Forecast, by Cardiology, 2016–2026
Figure 22: Global Medical Dynamometer Market Revenue (US$ Mn) and Y-o-Y Growth (%) Forecast, by Medical Trauma, 2016–2026
Figure 23: Global Medical Dynamometer Market Revenue (US$ Mn) and Y-o-Y Growth (%) Forecast, by Others, 2016–2026
Figure 24: Global Medical Dynamometer Market Attractiveness, by Application, 2018–2026
Figure 25: Global Medical Dynamometer Market Value Share, by End-user, 2018 and 2026
Figure 26: Global Medical Dynamometer Market Attractiveness, by End-user, 2018–2026
Figure 27: Global Medical Dynamometer Market Revenue (US$ Mn) and Y-o-Y Growth (%) Forecast, by Hospitals, 2016–2026
Figure 28: Global Medical Dynamometer Market Revenue (US$ Mn) and Y-o-Y Growth (%) Forecast, by Rehabilitation Centers, 2016–2026
Figure 29: Global Medical Dynamometer Market Revenue (US$ Mn) and Y-o-Y Growth (%) Forecast, by Physiotherapy Clinics, 2016–2026
Figure 30: Global Medical Dynamometer Market Revenue (US$ Mn) and Y-o-Y Growth (%) Forecast, by Others, 2016–2026
Figure 31: Global Medical Dynamometer Market Value Share, by Region, 2018 and 2026
Figure 32: Global Medical Dynamometer Market Attractiveness, by Region, 2018–2026
Figure 33: North America Medical Dynamometer Market Value (US$ Mn) Forecast and Y-o-Y Growth Projection (%), 2016–2026
Figure 34: North America Medical Dynamometer Market Value Share, by Country, 2018–2026
Figure 35: North America Medical Dynamometer Market Attractiveness, by Country, 2018–2026
Figure 36: North America Medical Dynamometer Market Value Share, by Product, 2018 and 2026
Figure 37: North America Medical Dynamometer Market Attractiveness, by Product, 2018–2026
Figure 38: North America Medical Dynamometer Market Value Share, by Operation, 2018 and 2026
Figure 39: North America Medical Dynamometer Market Attractiveness, by Operation, 2018–2026
Figure 40: North America Medical Dynamometer Market Value Share, by Application, 2018 and 2026
Figure 41: North America Medical Dynamometer Market Attractiveness, by Application, 2018–2026
Figure 42: North America Medical Dynamometer Market Value Share, by End-user, 2018 and 2026
Figure 43: North America Medical Dynamometer Market Attractiveness, by End-user, 2018–2026
Figure 44: Europe Medical Dynamometer Market Value (US$ Mn) Forecast and Y-o-Y Growth Projection (%), 2016–2026
Figure 45: Europe Medical Dynamometer Market Value Share, by Country/Sub-Region, 2018–2026
Figure 46: Europe Medical Dynamometer Market Attractiveness, by Country/Sub-Region, 2018–2026
Figure 47: Europe Medical Dynamometer Market Value Share, by Product, 2018 and 2026
Figure 48: Europe Medical Dynamometer Market Attractiveness, by Product, 2018–2026
Figure 49: Europe Medical Dynamometer Market Value Share, by Operation, 2018 and 2026
Figure 50: Europe Medical Dynamometer Market Attractiveness, by Operation, 2018–2026
Figure 51: Europe Medical Dynamometer Market Value Share, by Application, 2018 and 2026
Figure 52: Europe Medical Dynamometer Market Attractiveness, by Application, 2018–2026
Figure 53: Europe Medical Dynamometer Market Value Share, by End-user, 2018 and 2026
Figure 54: Europe Medical Dynamometer Market Attractiveness, by End-user, 2018–2026
Figure 55: Asia Pacific Medical Dynamometer Market Value (US$ Mn) Forecast and Y-o-Y Growth Projection (%), 2016–2026
Figure 56: Asia Pacific Medical Dynamometer Market Value Share, by Country/Sub-Region, 2018–2026
Figure 57: Asia Pacific Medical Dynamometer Market Attractiveness, by Country/Sub-region, 2018–2026
Figure 58: Asia Pacific Medical Dynamometer Market Value Share, by Product, 2018 and 2026
Figure 59: Asia Pacific Medical Dynamometer Market Attractiveness, by Product, 2018–2026
Figure 60: Asia Pacific Medical Dynamometer Market Value Share, by Operation, 2018 and 2026
Figure 61: Asia Pacific Medical Dynamometer Market Attractiveness, by Operation, 2018–2026
Figure 62: Asia Pacific Medical Dynamometer Market Value Share, by Application, 2018 and 2026
Figure 63: Asia Pacific Medical Dynamometer Market Attractiveness, by Application, 2018–2026
Figure 64: Asia Pacific Medical Dynamometer Market Value Share, by End-user, 2018 and 2026
Figure 65: Asia Pacific Medical Dynamometer Market Attractiveness, by End-user, 2018–2026
Figure 66: Latin America Medical Dynamometer Market Value (US$ Mn) Forecast and Y-o-Y Growth Projection (%), 2016–2026
Figure 67: Latin America Medical Dynamometer Market Value Share, by Country/Sub-Region, 2018–2026
Figure 68: Latin America Medical Dynamometer Market Attractiveness, by Country/Sub-region, 2018–2026
Figure 69: Latin America Medical Dynamometer Market Value Share, by Product, 2018 and 2026
Figure 70: Latin America Medical Dynamometer Market Attractiveness, by Product, 2018–2026
Figure 71: Latin America Medical Dynamometer Market Value Share, by Operation, 2018 and 2026
Figure 72: Latin America Medical Dynamometer Market Attractiveness, by Operation, 2018–2026
Figure 73: Latin America Medical Dynamometer Market Value Share, by Application, 2018 and 2026
Figure 74: Latin America Medical Dynamometer Market Attractiveness, by Application, 2018–2026
Figure 75: Latin America Medical Dynamometer Market Value Share, by End-user, 2018 and 2026
Figure 76: Latin America Medical Dynamometer Market Attractiveness, by End-user, 2018–2026
Figure 77: Middle East & Africa Medical Dynamometer Market Value (US$ Mn) Forecast and Y-o-Y Growth Projection (%), 2016–2026
Figure 78: Middle East & Africa Medical Dynamometer Market Value Share, by Country/Sub-region, 2018 and 2026
Figure 79: Middle East & Africa Medical Dynamometer Market Attractiveness, by Country/Sub-region, 2018–2026
Figure 80: Middle East & Africa Medical Dynamometer Market Value Share, by Product, 2018 and 2026
Figure 81: Middle East & Africa Medical Dynamometer Market Attractiveness, by Product, 2018–2026
Figure 82: Middle East & Africa Medical Dynamometer Market Value Share, by Operation, 2018 and 2026
Figure 83: Middle East & Africa Medical Dynamometer Market Attractiveness, by Operation, 2018–2026
Figure 84: Middle East & Africa Medical Dynamometer Market Value Share, by Application, 2018 and 2026
Figure 85: Middle East & Africa Medical Dynamometer Market Attractiveness, by Application, 2018–2026
Figure 86: Middle East & Africa Medical Dynamometer Market Value Share, by End-user, 2018 and 2026
Figure 87: Middle East & Africa Medical Dynamometer Market Attractiveness, by End-user, 2018–2026
Figure 88: Global Medical Dynamometer Market Performance in Physiotherapy Field, by Company, 2017
Copyright © Transparency Market Research, Inc. All Rights reserved
Trust Online

Medical Dynamometer Market Forecast Report, 2018-2026