
Reports
Reports
Extensive research and development in the healthcare industry is leading to the development of new devices and medical equipment. These devices and equipment are being connected to several other equipment and devices, thereby driving the need for better medical connectors. Manufacturers are focusing on designing medical connectors that are cost-effective and able to tolerate various sterilization protocols. High reliability, eliminating the potential for failure due to various environmental factors as well as poor handling is also being focused on while developing medical connectors.
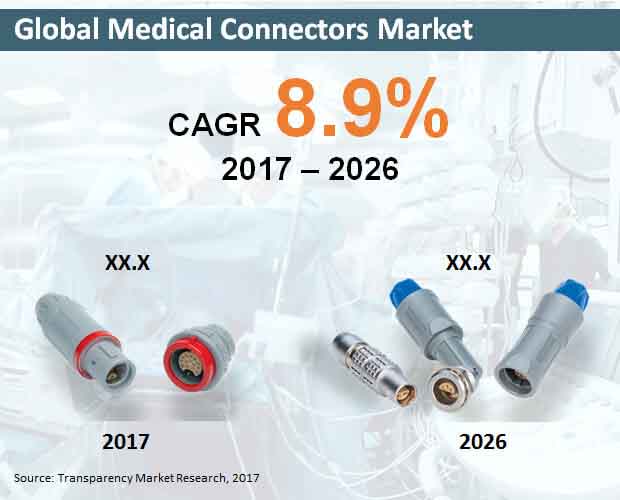
The latest report by Transparency Market Research (TMR) anticipates the global market for medical connectors to experience strong growth. During 2017-2026, the market is projected to increase to 8.9% CAGR. The global market for medical connectors is also likely to reach US$ 3,690.4 million revenue between 2017 and 2026.
Flat Silicone Surgical Cables- Top-Selling Product in Medical Connectors Market Globally
Compared to the various medical connector products, flat silicone surgical cables are likely to emerge as the top-selling product during 2017-2026. Flat silicone surgical cables are projected to reach close to US$ 900 million revenue towards the end of 2026. Increasing adoption of medical devices is one of the major factors in the growth of flat silicone surgical cables. Flat silicone surgical cables offer flexibility in automated diagnostic medical equipment. Moreover, flat silicone surgical cables also offer high resistance to different chemical substances. Silicone is being widely used in applications medical robotics, handheld devices, feeding tubes, catheters, etc.
Hospitals & Clinics to Account for the Robust Growth during 2017-2026
Among various end users of medical connectors, hospitals & clinics are likely to experience robust growth. Hospitals & clinics are projected to exceed US$ 1,400 million revenue by 2026 end. Owing to the increasing demand for minimally invasive procedures, and increasing investment by government and the private sector in the development of healthcare infrastructure is leading to the increasing use of advanced medical devices and machines. This is driving the use of various medical connectors in hospitals and clinics.
Medical Connectors to find Largest Application in Diagnostic Devices
Medical connectors are likely to find the largest application in diagnostic devices. By the end of 2026, diagnostic devices are projected to exceed US$ 1,800 million revenue. The rise in chronic diseases such as cancer, diabetes, cardiovascular diseases, etc., is leading to the increasing use of diagnostic devices. This, in turn, is expected to drive demand for medical connectors, especially for various diagnostic devices. Manufacturers of medical connectors are also producing connectors used for the specific device.
North America to Dominate the Global Market for Medical Connectors
North America is likely to dominate the market during 2017-2026. Advancement in medical technology, availability of better reimbursement policies are the major factors responsible for the increasing demand for medical connectors in North America. The U.S. and Canada are anticipated to remain dominant countries in the medical connectors market. Medical connectors market also have a huge opportunity for growth in the emerging markets of APEJ and Japan. Owing to the increasing awareness among medical providers on the use of advanced devices, countries such as India, China and Japan are increasingly using technically advanced medical devices, thereby resulting in the increase in the use of medical connectors.
Countries in Europe including France, Germany, U.K., and Spain are also receiving funding from the government and private companies for development of advanced healthcare system.
Competition Tracking
AVX Corporation, LEMO S.A., Samtec, Inc., Esterline Technologies Corporation, Fischer Connectors SA, Molex, LLC, TE Connectivity Ltd, ITT Inc., Amphenol Corporation, and Smiths Group Plc, are some of the major market players in the global market for medical connectors.
Medical Connectors Market to Thrive on the Back of Technological Progress and Innovations
Connections in medical devices comprise a wide variety of styles, comprising those that create electrical connections within medical systems and machines and also with those that are utilized for the purpose of unlatching and latching tubing in various medical gadgets. Connectors are utilized for the purpose of transferring media or data, signal, and power. These connectors are made for just one such operation or in the form of hybrid system. Irrespective of its type, these connectors need to be hygienic and safe. These connectors find extensive use in many places, such as clinics, ambulatory surgical centers, diagnostic laboratories and imaging centers, and hospitals. Such extensive use of the product is foreseen to bolster growth of the global medical connectors market in the years to come.
Increased Prevalence of Chronic Diseases and its Complications to Boost Market Growth
The business of ambulatory surgery centers and clinics is flourishing, which has led to increased use of different medical devices utilizing connectors. Growth in the medical device industry is likely to pave way for rapid growth of the global medical connectors market in the near future.
Expanding base of geriatric population, augmented demand for miniaturized connectors, increasing surgeries, and growing incidences of chronic diseases are expected to widen scope of growth of the global medical connectors market in the near future.
Makers of medical devices are coming up with new, technologically advanced devices to cater to the need of treating chronic diseases, which are getting increasingly complicated. Development of new devices is likely to support development of the global medical connectors market in the near future.
The ongoing pandemic situation is likely to spell growth for the global medical connectors market. The Covid-19 and its new variant B.1.1.7 wreaks havoc worldwide, more people are getting infected with the virus and are getting hospitalized. With augmented hospitalization, the demand for medical devices is expected to rise. With the increased demand for medical devices, the global medical connectors market is likely to observe considerable growth in the timeframe of analysis.
1. Global Outlook
2. Global Medical Connectors Market - Executive Summary
3. Global Medical Connectors Market Overview
3.1. Introduction
3.1.1. Global Medical Connectors Market Taxonomy
3.1.2. Global Medical Connectors Market Definition
3.2. Global Medical Connectors Market Size (US$ Mn) and Forecast, 2012-2026
3.2.1. Global Medical Connectors Market Y-o-Y Growth
3.3. Global Medical Connectors Market Dynamics
3.4. Supply Chain
3.5. Cost Structure
3.6. Pricing Analysis
3.7. PEST Analysis
3.8. Product Life Cycle Analysis
3.9. PATENT
3.10. List of Distributors
3.11. Key Participants Market Presence (Intensity Map) By Region
4. Global Medical Connectors Market Analysis and Forecast 2012-2026
4.1. Global Medical Connectors Market Size and Forecast By Product Type, 2012-2026
4.1.1. Flat Silicone Surgical Cables Market Size and Forecast, 2012-2026
4.1.1.1. Revenue (US$ Mn) Comparison, By Region
4.1.1.2. Market Share Comparison, By Region
4.1.1.3. Y-o-Y growth Comparison, By Region
4.1.2. Embedded Electronics Connectors Market Size and Forecast, 2012-2026
4.1.2.1. Revenue (US$ Mn) Comparison, By Region
4.1.2.2. Market Share Comparison, By Region
4.1.2.3. Y-o-Y growth Comparison, By Region
4.1.3. Radio-Frequency Connectors Market Size and Forecast, 2012-2026
4.1.3.1. Revenue (US$ Mn) Comparison, By Region
4.1.3.2. Market Share Comparison, By Region
4.1.3.3. Y-o-Y growth Comparison, By Region
4.1.4. Disposable Plastic Connectors Market Size and Forecast, 2012-2026
4.1.4.1. Revenue (US$ Mn) Comparison, By Region
4.1.4.2. Market Share Comparison, By Region
4.1.4.3. Y-o-Y growth Comparison, By Region
4.1.5. Hybrid Circular Connector and Receptacle Systems Market Size and Forecast, 2012-2026
4.1.5.1. Revenue (US$ Mn) Comparison, By Region
4.1.5.2. Market Share Comparison, By Region
4.1.5.3. Y-o-Y growth Comparison, By Region
4.1.6. Power Cords With Retention Systems Market Size and Forecast, 2012-2026
4.1.6.1. Revenue (US$ Mn) Comparison, By Region
4.1.6.2. Market Share Comparison, By Region
4.1.6.3. Y-o-Y growth Comparison, By Region
4.1.7. Lighted Hospital-Grade Cords Market Size and Forecast, 2012-2026
4.1.7.1. Revenue (US$ Mn) Comparison, By Region
4.1.7.2. Market Share Comparison, By Region
4.1.7.3. Y-o-Y growth Comparison, By Region
4.1.8. Magnetic Medical Connectors Market Size and Forecast, 2012-2026
4.1.8.1. Revenue (US$ Mn) Comparison, By Region
4.1.8.2. Market Share Comparison, By Region
4.1.8.3. Y-o-Y growth Comparison, By Region
4.1.9. Push-Pull Connectors Market Size and Forecast, 2012-2026
4.1.9.1. Revenue (US$ Mn) Comparison, By Region
4.1.9.2. Market Share Comparison, By Region
4.1.9.3. Y-o-Y growth Comparison, By Region
4.1.10. Others Market Size and Forecast, 2012-2026
4.1.10.1.Revenue (US$ Mn) Comparison, By Region
4.1.10.2.Market Share Comparison, By Region
4.1.10.3.Y-o-Y growth Comparison, By Region
4.2. Global Medical Connectors Market Size and Forecast By End User, 2012-2026
4.2.1. Hospitals & Clinics Market Size and Forecast, 2012-2026
4.2.1.1. Revenue (US$ Mn) Comparison, By Region
4.2.1.2. Market Share Comparison, By Region
4.2.1.3. Y-o-Y growth Comparison, By Region
4.2.2. Diagnostic Laboratories & Imaging Centers Market Size and Forecast, 2012-2026
4.2.2.1. Revenue (US$ Mn) Comparison, By Region
4.2.2.2. Market Share Comparison, By Region
4.2.2.3. Y-o-Y growth Comparison, By Region
4.2.3. Ambulatory Surgical Centers Market Size and Forecast, 2012-2026
4.2.3.1. Revenue (US$ Mn) Comparison, By Region
4.2.3.2. Market Share Comparison, By Region
4.2.3.3. Y-o-Y growth Comparison, By Region
4.2.4. Other End Users Market Size and Forecast, 2012-2026
4.2.4.1. Revenue (US$ Mn) Comparison, By Region
4.2.4.2. Market Share Comparison, By Region
4.2.4.3. Y-o-Y growth Comparison, By Region
4.3. Global Medical Connectors Market Size and Forecast By Application, 2012-2026
4.3.1. Monitoring Devices Market Size and Forecast, 2012-2026
4.3.1.1. Revenue (US$ Mn) Comparison, By Region
4.3.1.2. Market Share Comparison, By Region
4.3.1.3. Y-o-Y growth Comparison, By Region
4.3.2. Therapeutic Devices Market Size and Forecast, 2012-2026
4.3.2.1. Revenue (US$ Mn) Comparison, By Region
4.3.2.2. Market Share Comparison, By Region
4.3.2.3. Y-o-Y growth Comparison, By Region
4.3.3. Diagnostic Devices Market Size and Forecast, 2012-2026
4.3.3.1. Revenue (US$ Mn) Comparison, By Region
4.3.3.2. Market Share Comparison, By Region
4.3.3.3. Y-o-Y growth Comparison, By Region
5. North America Medical Connectors Market Size and Forecast, 2012-2026
5.1. North America Outlook
5.2. North America Parent Market Outlook
5.3. North America Target Market Outlook
5.4. Revenue (US$ Mn) Comparison, By Country
5.4.1. US Market Size and Forecast (US$ Mn), 2012-2026
5.4.2. Canada Market Size and Forecast (US$ Mn), 2012-2026
5.5. Revenue (US$ Mn) Comparison, By Product Type
5.6. Revenue (US$ Mn) Comparison, By End User
5.7. Revenue (US$ Mn) Comparison, By Application
6. Latin America Medical Connectors Market Size and Forecast, 2012-2026
6.1. Latin America Outlook
6.2. Latin America Parent Market Outlook
6.3. Latin America Target Market Outlook
6.4. Revenue (US$ Mn) Comparison, By Country
6.4.1. Brazil Market Size and Forecast (US$ Mn), 2012-2026
6.4.2. Mexico Market Size and Forecast (US$ Mn), 2012-2026
6.4.3. Rest of Latin America Market Size and Forecast (US$ Mn), 2012-2026
6.5. Revenue (US$ Mn) Comparison, By Product Type
6.6. Revenue (US$ Mn) Comparison, By End User
6.7. Revenue (US$ Mn) Comparison, By Application
7. Europe Medical Connectors Market Size and Forecast, 2012-2026
7.1. Europe Outlook
7.2. Europe Parent Market Outlook
7.3. Europe Target Market Outlook
7.4. Revenue (US$ Mn) Comparison, By Country
7.4.1. Germany Market Size and Forecast (US$ Mn), 2012-2026
7.4.2. UK Market Size and Forecast (US$ Mn), 2012-2026
7.4.3. France Market Size and Forecast (US$ Mn), 2012-2026
7.4.4. Spain Market Size and Forecast (US$ Mn), 2012-2026
7.4.5. Italy Market Size and Forecast (US$ Mn), 2012-2026
7.4.6. Rest of Europe Market Size and Forecast (US$ Mn), 2012-2026
7.5. Revenue (US$ Mn) Comparison, By Product Type
7.6. Revenue (US$ Mn) Comparison, By End User
7.7. Revenue (US$ Mn) Comparison, By Application
8. Japan Medical Connectors Market Size and Forecast, 2012-2026
8.1. Japan Outlook
8.2. Japan Parent Market Outlook
8.3. Japan Target Market Outlook
8.4. Revenue (US$ Mn) Comparison, By Country
8.4.1. Japan Market Size and Forecast (US$ Mn), 2012-2026
8.5. Revenue (US$ Mn) Comparison, By Product Type
8.6. Revenue (US$ Mn) Comparison, By End User
8.7. Revenue (US$ Mn) Comparison, By Application
9. APEJ Medical Connectors Market Size and Forecast, 2012-2026
9.1. APEJ Outlook
9.2. APEJ Parent Market Outlook
9.3. APEJ Target Market Outlook
9.4. Revenue (US$ Mn) Comparison, By Country
9.4.1. China Market Size and Forecast (US$ Mn), 2012-2026
9.4.2. India Market Size and Forecast (US$ Mn), 2012-2026
9.4.3. Thailand Market Size and Forecast (US$ Mn), 2012-2026
9.4.4. Singapore Market Size and Forecast (US$ Mn), 2012-2026
9.4.5. Australia Market Size and Forecast (US$ Mn), 2012-2026
9.4.6. Rest of APEJ Market Size and Forecast (US$ Mn), 2012-2026
9.5. Revenue (US$ Mn) Comparison, By Product Type
9.6. Revenue (US$ Mn) Comparison, By End User
9.7. Revenue (US$ Mn) Comparison, By Application
10. MEA Medical Connectors Market Size and Forecast, 2012-2026
10.1. MEA Outlook
10.2. MEA Parent Market Outlook
10.3. MEA Target Market Outlook
10.4. Revenue (US$ Mn) Comparison, By Country
10.4.1. GCC Countries Market Size and Forecast (US$ Mn), 2012-2026
10.4.2. South Africa Market Size and Forecast (US$ Mn), 2012-2026
10.4.3. Israel Market Size and Forecast (US$ Mn), 2012-2026
10.4.4. Rest of MEA Market Size and Forecast (US$ Mn), 2012-2026
10.5. Revenue (US$ Mn) Comparison, By Product Type
10.6. Revenue (US$ Mn) Comparison, By End User
10.7. Revenue (US$ Mn) Comparison, By Application
11. Global Medical Connectors Market Company Share, Competition Landscape and Company Profiles
11.1. Company Share Analysis
11.2. Competition Landscape
11.3. Company Profiles
11.3.1. Amphenol Corporation
11.3.2. ITT, Inc.
11.3.3. Smiths Group plc
11.3.4. TE Connectivity Ltd.
11.3.5. Fischer Connectors SA
11.3.6. Molex, LLC
11.3.7. Esterline Technologies Corporation
11.3.8. LEMO S.A.
11.3.9. Samtec, Inc.
11.3.10. AVX Corporation
11.4. Key Takeaways
12. Research Methodology
13. Disclaimer
List of Tables
TABLE 1 Global Medical Connectors Market Value (US$ Mn), 2012-2017
TABLE 2 Global Medical Connectors Market Value (US$ Mn), 2018-2026
TABLE 3 Global Medical Connectors Market Value (US$ Mn) and Y-o-Y, 2017-2026
TABLE 4 Global Flat Silicone Surgical Cables Segment Value (US$ Mn), By Region 2012-2017
TABLE 5 Global Flat Silicone Surgical Cables Segment Value (US$ Mn), By Region 2018-2026
TABLE 6 Global Flat Silicone Surgical Cables Segment Market Share, By Region 2012-2017
TABLE 7 Global Flat Silicone Surgical Cables Segment Market Share, By Region 2018-2026
TABLE 8 Global Flat Silicone Surgical Cables Segment Y-o-Y, By Region 2017-2026
TABLE 9 Global Embedded Electronics Connectors Segment Value (US$ Mn), By Region 2012-2017
TABLE 10 Global Embedded Electronics Connectors Segment Value (US$ Mn), By Region 2018-2026
TABLE 11 Global Embedded Electronics Connectors Segment Market Share, By Region 2012-2017
TABLE 12 Global Embedded Electronics Connectors Segment Market Share, By Region 2018-2026
TABLE 13 Global Embedded Electronics Connectors Segment Y-o-Y, By Region 2017-2026
TABLE 14 Global Radio-Frequency Connectors Segment Value (US$ Mn), By Region 2012-2017
TABLE 15 Global Radio-Frequency Connectors Segment Value (US$ Mn), By Region 2018-2026
TABLE 16 Global Radio-Frequency Connectors Segment Market Share, By Region 2012-2017
TABLE 17 Global Radio-Frequency Connectors Segment Market Share, By Region 2018-2026
TABLE 18 Global Radio-Frequency Connectors Segment Y-o-Y, By Region 2017-2026
TABLE 19 Global Disposable Plastic Connectors Segment Value (US$ Mn), By Region 2012-2017
TABLE 20 Global Disposable Plastic Connectors Segment Value (US$ Mn), By Region 2018-2026
TABLE 21 Global Disposable Plastic Connectors Segment Market Share, By Region 2012-2017
TABLE 22 Global Disposable Plastic Connectors Segment Market Share, By Region 2018-2026
TABLE 23 Global Disposable Plastic Connectors Segment Y-o-Y, By Region 2017-2026
TABLE 24 Global Hybrid Circular Connector and Receptacle Systems Segment Value (US$ Mn), By Region 2012-2017
TABLE 25 Global Hybrid Circular Connector and Receptacle Systems Segment Value (US$ Mn), By Region 2018-2026
TABLE 26 Global Hybrid Circular Connector and Receptacle Systems Segment Market Share, By Region 2012-2017
TABLE 27 Global Hybrid Circular Connector and Receptacle Systems Segment Market Share, By Region 2018-2026
TABLE 28 Global Hybrid Circular Connector and Receptacle Systems Segment Y-o-Y, By Region 2017-2026
TABLE 29 Global Power Cords With Retention Systems Segment Value (US$ Mn), By Region 2012-2017
TABLE 30 Global Power Cords With Retention Systems Segment Value (US$ Mn), By Region 2018-2026
TABLE 31 Global Power Cords With Retention Systems Segment Market Share, By Region 2012-2017
TABLE 32 Global Power Cords With Retention Systems Segment Market Share, By Region 2018-2026
TABLE 33 Global Power Cords With Retention Systems Segment Y-o-Y, By Region 2017-2026
TABLE 34 Global Lighted Hospital-Grade Cords Segment Value (US$ Mn), By Region 2012-2017
TABLE 35 Global Lighted Hospital-Grade Cords Segment Value (US$ Mn), By Region 2018-2026
TABLE 36 Global Lighted Hospital-Grade Cords Segment Market Share, By Region 2012-2017
TABLE 37 Global Lighted Hospital-Grade Cords Segment Market Share, By Region 2018-2026
TABLE 38 Global Lighted Hospital-Grade Cords Segment Y-o-Y, By Region 2017-2026
TABLE 39 Global Magnetic Medical Connectors Segment Value (US$ Mn), By Region 2012-2017
TABLE 40 Global Magnetic Medical Connectors Segment Value (US$ Mn), By Region 2018-2026
TABLE 41 Global Magnetic Medical Connectors Segment Market Share, By Region 2012-2017
TABLE 42 Global Magnetic Medical Connectors Segment Market Share, By Region 2018-2026
TABLE 43 Global Magnetic Medical Connectors Segment Y-o-Y, By Region 2017-2026
TABLE 44 Global Push-Pull Connectors Segment Value (US$ Mn), By Region 2012-2017
TABLE 45 Global Push-Pull Connectors Segment Value (US$ Mn), By Region 2018-2026
TABLE 46 Global Push-Pull Connectors Segment Market Share, By Region 2012-2017
TABLE 47 Global Push-Pull Connectors Segment Market Share, By Region 2018-2026
TABLE 48 Global Push-Pull Connectors Segment Y-o-Y, By Region 2017-2026
TABLE 49 Global Others Segment Value (US$ Mn), By Region 2012-2017
TABLE 50 Global Others Segment Value (US$ Mn), By Region 2018-2026
TABLE 51 Global Others Segment Market Share, By Region 2012-2017
TABLE 52 Global Others Segment Market Share, By Region 2018-2026
TABLE 53 Global Others Segment Y-o-Y, By Region 2017-2026
TABLE 54 Global Hospitals & Clinics Segment Value (US$ Mn), By Region 2012-2017
TABLE 55 Global Hospitals & Clinics Segment Value (US$ Mn), By Region 2018-2026
TABLE 56 Global Hospitals & Clinics Segment Market Share, By Region 2012-2017
TABLE 57 Global Hospitals & Clinics Segment Market Share, By Region 2018-2026
TABLE 58 Global Hospitals & Clinics Segment Y-o-Y, By Region 2017-2026
TABLE 59 Global Diagnostic Laboratories & Imaging Centers Segment Value (US$ Mn), By Region 2012-2017
TABLE 60 Global Diagnostic Laboratories & Imaging Centers Segment Value (US$ Mn), By Region 2018-2026
TABLE 61 Global Diagnostic Laboratories & Imaging Centers Segment Market Share, By Region 2012-2017
TABLE 62 Global Diagnostic Laboratories & Imaging Centers Segment Market Share, By Region 2018-2026
TABLE 63 Global Diagnostic Laboratories & Imaging Centers Segment Y-o-Y, By Region 2017-2026
TABLE 64 Global Ambulatory Surgical Centers Segment Value (US$ Mn), By Region 2012-2017
TABLE 65 Global Ambulatory Surgical Centers Segment Value (US$ Mn), By Region 2018-2026
TABLE 66 Global Ambulatory Surgical Centers Segment Market Share, By Region 2012-2017
TABLE 67 Global Ambulatory Surgical Centers Segment Market Share, By Region 2018-2026
TABLE 68 Global Ambulatory Surgical Centers Segment Y-o-Y, By Region 2017-2026
TABLE 69 Global Other End Users Segment Value (US$ Mn), By Region 2012-2017
TABLE 70 Global Other End Users Segment Value (US$ Mn), By Region 2018-2026
TABLE 71 Global Other End Users Segment Market Share, By Region 2012-2017
TABLE 72 Global Other End Users Segment Market Share, By Region 2018-2026
TABLE 73 Global Other End Users Segment Y-o-Y, By Region 2017-2026
TABLE 74 Global Monitoring Devices Segment Value (US$ Mn), By Region 2012-2017
TABLE 75 Global Monitoring Devices Segment Value (US$ Mn), By Region 2018-2026
TABLE 76 Global Monitoring Devices Segment Market Share, By Region 2012-2017
TABLE 77 Global Monitoring Devices Segment Market Share, By Region 2018-2026
TABLE 78 Global Monitoring Devices Segment Y-o-Y, By Region 2017-2026
TABLE 79 Global Therapeutic Devices Segment Value (US$ Mn), By Region 2012-2017
TABLE 80 Global Therapeutic Devices Segment Value (US$ Mn), By Region 2018-2026
TABLE 81 Global Therapeutic Devices Segment Market Share, By Region 2012-2017
TABLE 82 Global Therapeutic Devices Segment Market Share, By Region 2018-2026
TABLE 83 Global Therapeutic Devices Segment Y-o-Y, By Region 2017-2026
TABLE 84 Global Diagnostic Devices Segment Value (US$ Mn), By Region 2012-2017
TABLE 85 Global Diagnostic Devices Segment Value (US$ Mn), By Region 2018-2026
TABLE 86 Global Diagnostic Devices Segment Market Share, By Region 2012-2017
TABLE 87 Global Diagnostic Devices Segment Market Share, By Region 2018-2026
TABLE 88 Global Diagnostic Devices Segment Y-o-Y, By Region 2017-2026
TABLE 89 North America Current Expenditure on Health, (% of GDP), by Country, 2010 – 2016
TABLE 90 North America Per Capita Health Expenditure (US$ PPP), by Country, 2010 - 2016
TABLE 91 North America Per Capita Healthcare Expenditure Y-o-Y Growth (in Real terms %), by Country, 2010 - 2016
TABLE 92 North America Out-of-Pocket Healthcare Expenditure, % of Healthcare Expenditure, by Country, 2010 - 2016
TABLE 93 North America Per Capita Healthcare Expenditure (at Current Price, in US$), by Country, 2010 - 2016
TABLE 94 North America Medical Connectors Market Value (US$ Mn), By Country 2012-2017
TABLE 95 North America Medical Connectors Market Value (US$ Mn), By Country 2018-2026
TABLE 96 North America Medical Connectors Market Value (US$ Mn), By Product Type 2012-2017
TABLE 97 North America Medical Connectors Market Value (US$ Mn), By Product Type 2018-2026
TABLE 98 North America Medical Connectors Market Value (US$ Mn), By End User 2012-2017
TABLE 99 North America Medical Connectors Market Value (US$ Mn), By End User 2018-2026
TABLE 100 North America Medical Connectors Market Value (US$ Mn), By Application 2012-2017
TABLE 101 North America Medical Connectors Market Value (US$ Mn), By Application 2018-2026
TABLE 102 Latin America Current Expenditure on Health, (% of GDP), by Country, 2010 – 2016
TABLE 103 Latin America Per Capita Health Expenditure (US$ PPP), by Country, 2010 - 2016
TABLE 104 Latin America Per Capita Healthcare Expenditure Y-o-Y Growth (in Real terms %), by Country, 2010 - 2016
TABLE 105 Latin America Out-of-Pocket Healthcare Expenditure, % of Healthcare Expenditure, by Country, 2010 - 2016
TABLE 106 Latin America Per Capita Healthcare Expenditure (at Current Price, in US$), by Country, 2010 - 2016
TABLE 107 Latin America Medical Connectors Market Value (US$ Mn), By Country 2012-2017
TABLE 108 Latin America Medical Connectors Market Value (US$ Mn), By Country 2018-2026
TABLE 109 Latin America Medical Connectors Market Value (US$ Mn), By Product Type 2012-2017
TABLE 110 Latin America Medical Connectors Market Value (US$ Mn), By Product Type 2018-2026
TABLE 111 Latin America Medical Connectors Market Value (US$ Mn), By End User 2012-2017
TABLE 112 Latin America Medical Connectors Market Value (US$ Mn), By End User 2018-2026
TABLE 113 Latin America Medical Connectors Market Value (US$ Mn), By Application 2012-2017
TABLE 114 Latin America Medical Connectors Market Value (US$ Mn), By Application 2018-2026
TABLE 115 Europe Current Expenditure on Health, (% of GDP), by Country, 2010 – 2016
TABLE 116 Europe Per Capita Health Expenditure (US$ PPP), by Country, 2010 - 2016
TABLE 117 Europe Per Capita Healthcare Expenditure Y-o-Y Growth (in Real terms %), by Country, 2010 - 2016
TABLE 118 Europe Out-of-Pocket Healthcare Expenditure, % of Healthcare Expenditure, by Country, 2010 - 2016
TABLE 119 Europe Per Capita Healthcare Expenditure (at Current Price, in US$), by Country, 2010 - 2016
TABLE 120 Europe Medical Connectors Market Value (US$ Mn), By Country 2012-2017
TABLE 121 Europe Medical Connectors Market Value (US$ Mn), By Country 2018-2026
TABLE 122 Europe Medical Connectors Market Value (US$ Mn), By Product Type 2012-2017
TABLE 123 Europe Medical Connectors Market Value (US$ Mn), By Product Type 2018-2026
TABLE 124 Europe Medical Connectors Market Value (US$ Mn), By End User 2012-2017
TABLE 125 Europe Medical Connectors Market Value (US$ Mn), By End User 2018-2026
TABLE 126 Europe Medical Connectors Market Value (US$ Mn), By Application 2012-2017
TABLE 127 Europe Medical Connectors Market Value (US$ Mn), By Application 2018-2026
TABLE 128 Japan Current Expenditure on Health, (% of GDP), by Country, 2010 – 2016
TABLE 129 Japan Per Capita Health Expenditure (US$ PPP), by Country, 2010 - 2016
TABLE 130 Japan Per Capita Healthcare Expenditure Y-o-Y Growth (in Real terms %), by Country, 2010 - 2016
TABLE 131 Japan Out-of-Pocket Healthcare Expenditure, % of Healthcare Expenditure, by Country, 2010 - 2016
TABLE 132 Japan Per Capita Healthcare Expenditure (at Current Price, in US$), by Country, 2010 - 2016
TABLE 133 Japan Medical Connectors Market Value (US$ Mn), By Country 2012-2017
TABLE 134 Japan Medical Connectors Market Value (US$ Mn), By Country 2018-2026
TABLE 135 Japan Medical Connectors Market Value (US$ Mn), By Product Type 2012-2017
TABLE 136 Japan Medical Connectors Market Value (US$ Mn), By Product Type 2018-2026
TABLE 137 Japan Medical Connectors Market Value (US$ Mn), By End User 2012-2017
TABLE 138 Japan Medical Connectors Market Value (US$ Mn), By End User 2018-2026
TABLE 139 Japan Medical Connectors Market Value (US$ Mn), By Application 2012-2017
TABLE 140 Japan Medical Connectors Market Value (US$ Mn), By Application 2018-2026
TABLE 141 APEJ Current Expenditure on Health, (% of GDP), by Country, 2010 – 2016
TABLE 142 APEJ Per Capita Health Expenditure (US$ PPP), by Country, 2010 - 2016
TABLE 143 APEJ Per Capita Healthcare Expenditure Y-o-Y Growth (in Real terms %), by Country, 2010 - 2016
TABLE 144 APEJ Out-of-Pocket Healthcare Expenditure, % of Healthcare Expenditure, by Country, 2010 - 2016
TABLE 145 APEJ Per Capita Healthcare Expenditure (at Current Price, in US$), by Country, 2010 - 2016
TABLE 146 APEJ Medical Connectors Market Value (US$ Mn), By Country 2012-2017
TABLE 147 APEJ Medical Connectors Market Value (US$ Mn), By Country 2018-2026
TABLE 148 APEJ Medical Connectors Market Value (US$ Mn), By Product Type 2012-2017
TABLE 149 APEJ Medical Connectors Market Value (US$ Mn), By Product Type 2018-2026
TABLE 150 APEJ Medical Connectors Market Value (US$ Mn), By End User 2012-2017
TABLE 151 APEJ Medical Connectors Market Value (US$ Mn), By End User 2018-2026
TABLE 152 APEJ Medical Connectors Market Value (US$ Mn), By Application 2012-2017
TABLE 153 APEJ Medical Connectors Market Value (US$ Mn), By Application 2018-2026
TABLE 154 MEA Current Expenditure on Health, (% of GDP), by Country, 2010 – 2016
TABLE 155 MEA Per Capita Health Expenditure (US$ PPP), by Country, 2010 - 2016
TABLE 156 MEA Per Capita Healthcare Expenditure Y-o-Y Growth (in Real terms %), by Country, 2010 - 2016
TABLE 157 MEA Out-of-Pocket Healthcare Expenditure, % of Healthcare Expenditure, by Country, 2010 - 2016
TABLE 158 MEA Per Capita Healthcare Expenditure (at Current Price, in US$), by Country, 2010 - 2016
TABLE 159 MEA Medical Connectors Market Value (US$ Mn), By Country 2012-2017
TABLE 160 MEA Medical Connectors Market Value (US$ Mn), By Country 2018-2026
TABLE 161 MEA Medical Connectors Market Value (US$ Mn), By Product Type 2012-2017
TABLE 162 MEA Medical Connectors Market Value (US$ Mn), By Product Type 2018-2026
TABLE 163 MEA Medical Connectors Market Value (US$ Mn), By End User 2012-2017
TABLE 164 MEA Medical Connectors Market Value (US$ Mn), By End User 2018-2026
TABLE 165 MEA Medical Connectors Market Value (US$ Mn), By Application 2012-2017
TABLE 166 MEA Medical Connectors Market Value (US$ Mn), By Application 2018-2026
List of Figures
FIG. 1 Global Medical Connectors Market Value (US$ Mn), 2012-2017
FIG. 2 Global Medical Connectors Market Value (US$ Mn) Forecast, 2018-2026
FIG. 3 Global Medical Connectors Market Value (US$ Mn) and Y-o-Y, 2017-2026
FIG. 4 Global Flat Silicone Surgical Cables Segment Market Value (US$ Mn) By Region, 2012-2017
FIG. 5 Global Flat Silicone Surgical Cables Segment Market Value (US$ Mn) By Region, 2018-2026
FIG. 6 Global Flat Silicone Surgical Cables Segment Y-o-Y Growth Rate, By Region, 2017-2026
FIG. 7 Global Embedded Electronics Connectors Segment Market Value (US$ Mn) By Region, 2012-2017
FIG. 8 Global Embedded Electronics Connectors Segment Market Value (US$ Mn) By Region, 2018-2026
FIG. 9 Global Embedded Electronics Connectors Segment Y-o-Y Growth Rate, By Region, 2017-2026
FIG. 10 Global Radio-Frequency Connectors Segment Market Value (US$ Mn) By Region, 2012-2017
FIG. 11 Global Radio-Frequency Connectors Segment Market Value (US$ Mn) By Region, 2018-2026
FIG. 12 Global Radio-Frequency Connectors Segment Y-o-Y Growth Rate, By Region, 2017-2026
FIG. 13 Global Disposable Plastic Connectors Segment Market Value (US$ Mn) By Region, 2012-2017
FIG. 14 Global Disposable Plastic Connectors Segment Market Value (US$ Mn) By Region, 2018-2026
FIG. 15 Global Disposable Plastic Connectors Segment Y-o-Y Growth Rate, By Region, 2017-2026
FIG. 16 Global Hybrid Circular Connector and Receptacle Systems Segment Market Value (US$ Mn) By Region, 2012-2017
FIG. 17 Global Hybrid Circular Connector and Receptacle Systems Segment Market Value (US$ Mn) By Region, 2018-2026
FIG. 18 Global Hybrid Circular Connector and Receptacle Systems Segment Y-o-Y Growth Rate, By Region, 2017-2026
FIG. 19 Global Power Cords With Retention Systems Segment Market Value (US$ Mn) By Region, 2012-2017
FIG. 20 Global Power Cords With Retention Systems Segment Market Value (US$ Mn) By Region, 2018-2026
FIG. 21 Global Power Cords With Retention Systems Segment Y-o-Y Growth Rate, By Region, 2017-2026
FIG. 22 Global Lighted Hospital-Grade Cords Segment Market Value (US$ Mn) By Region, 2012-2017
FIG. 23 Global Lighted Hospital-Grade Cords Segment Market Value (US$ Mn) By Region, 2018-2026
FIG. 24 Global Lighted Hospital-Grade Cords Segment Y-o-Y Growth Rate, By Region, 2017-2026
FIG. 25 Global Magnetic Medical Connectors Segment Market Value (US$ Mn) By Region, 2012-2017
FIG. 26 Global Magnetic Medical Connectors Segment Market Value (US$ Mn) By Region, 2018-2026
FIG. 27 Global Magnetic Medical Connectors Segment Y-o-Y Growth Rate, By Region, 2017-2026
FIG. 28 Global Push-Pull Connectors Segment Market Value (US$ Mn) By Region, 2012-2017
FIG. 29 Global Push-Pull Connectors Segment Market Value (US$ Mn) By Region, 2018-2026
FIG. 30 Global Push-Pull Connectors Segment Y-o-Y Growth Rate, By Region, 2017-2026
FIG. 31 Global Others Segment Market Value (US$ Mn) By Region, 2012-2017
FIG. 32 Global Others Segment Market Value (US$ Mn) By Region, 2018-2026
FIG. 33 Global Others Segment Y-o-Y Growth Rate, By Region, 2017-2026
FIG. 34 Global Hospitals & Clinics Segment Market Value (US$ Mn) By Region, 2012-2017
FIG. 35 Global Hospitals & Clinics Segment Market Value (US$ Mn) By Region, 2018-2026
FIG. 36 Global Hospitals & Clinics Segment Y-o-Y Growth Rate, By Region, 2017-2026
FIG. 37 Global Diagnostic Laboratories & Imaging Centers Segment Market Value (US$ Mn) By Region, 2012-2017
FIG. 38 Global Diagnostic Laboratories & Imaging Centers Segment Market Value (US$ Mn) By Region, 2018-2026
FIG. 39 Global Diagnostic Laboratories & Imaging Centers Segment Y-o-Y Growth Rate, By Region, 2017-2026
FIG. 40 Global Ambulatory Surgical Centers Segment Market Value (US$ Mn) By Region, 2012-2017
FIG. 41 Global Ambulatory Surgical Centers Segment Market Value (US$ Mn) By Region, 2018-2026
FIG. 42 Global Ambulatory Surgical Centers Segment Y-o-Y Growth Rate, By Region, 2017-2026
FIG. 43 Global Other End Users Segment Market Value (US$ Mn) By Region, 2012-2017
FIG. 44 Global Other End Users Segment Market Value (US$ Mn) By Region, 2018-2026
FIG. 45 Global Other End Users Segment Y-o-Y Growth Rate, By Region, 2017-2026
FIG. 46 Global Monitoring Devices Segment Market Value (US$ Mn) By Region, 2012-2017
FIG. 47 Global Monitoring Devices Segment Market Value (US$ Mn) By Region, 2018-2026
FIG. 48 Global Monitoring Devices Segment Y-o-Y Growth Rate, By Region, 2017-2026
FIG. 49 Global Therapeutic Devices Segment Market Value (US$ Mn) By Region, 2012-2017
FIG. 50 Global Therapeutic Devices Segment Market Value (US$ Mn) By Region, 2018-2026
FIG. 51 Global Therapeutic Devices Segment Y-o-Y Growth Rate, By Region, 2017-2026
FIG. 52 Global Diagnostic Devices Segment Market Value (US$ Mn) By Region, 2012-2017
FIG. 53 Global Diagnostic Devices Segment Market Value (US$ Mn) By Region, 2018-2026
FIG. 54 Global Diagnostic Devices Segment Y-o-Y Growth Rate, By Region, 2017-2026
FIG. 55 North America Medical Connectors Market Value (US$ Mn), By Country 2012-2017
FIG. 56 North America Medical Connectors Market Value (US$ Mn), By Country 2018-2026
FIG. 57 North America Medical Connectors Market Value (US$ Mn), By Product Type 2012-2017
FIG. 58 North America Medical Connectors Market Value (US$ Mn), By Product Type 2018-2026
FIG. 59 North America Medical Connectors Market Value (US$ Mn), By End User 2012-2017
FIG. 60 North America Medical Connectors Market Value (US$ Mn), By End User 2018-2026
FIG. 61 North America Medical Connectors Market Value (US$ Mn), By Application 2012-2017
FIG. 62 North America Medical Connectors Market Value (US$ Mn), By Application 2018-2026
FIG. 63 Latin America Medical Connectors Market Value (US$ Mn), By Country 2012-2017
FIG. 64 Latin America Medical Connectors Market Value (US$ Mn), By Country 2018-2026
FIG. 65 Latin America Medical Connectors Market Value (US$ Mn), By Product Type 2012-2017
FIG. 66 Latin America Medical Connectors Market Value (US$ Mn), By Product Type 2018-2026
FIG. 67 Latin America Medical Connectors Market Value (US$ Mn), By End User 2012-2017
FIG. 68 Latin America Medical Connectors Market Value (US$ Mn), By End User 2018-2026
FIG. 69 Latin America Medical Connectors Market Value (US$ Mn), By Application 2012-2017
FIG. 70 Latin America Medical Connectors Market Value (US$ Mn), By Application 2018-2026
FIG. 71 Europe Medical Connectors Market Value (US$ Mn), By Country 2012-2017
FIG. 72 Europe Medical Connectors Market Value (US$ Mn), By Country 2018-2026
FIG. 73 Europe Medical Connectors Market Value (US$ Mn), By Product Type 2012-2017
FIG. 74 Europe Medical Connectors Market Value (US$ Mn), By Product Type 2018-2026
FIG. 75 Europe Medical Connectors Market Value (US$ Mn), By End User 2012-2017
FIG. 76 Europe Medical Connectors Market Value (US$ Mn), By End User 2018-2026
FIG. 77 Europe Medical Connectors Market Value (US$ Mn), By Application 2012-2017
FIG. 78 Europe Medical Connectors Market Value (US$ Mn), By Application 2018-2026
FIG. 79 Japan Medical Connectors Market Value (US$ Mn), By Country 2012-2017
FIG. 80 Japan Medical Connectors Market Value (US$ Mn), By Country 2018-2026
FIG. 81 Japan Medical Connectors Market Value (US$ Mn), By Product Type 2012-2017
FIG. 82 Japan Medical Connectors Market Value (US$ Mn), By Product Type 2018-2026
FIG. 83 Japan Medical Connectors Market Value (US$ Mn), By Application 2012-2017
FIG. 84 Japan Medical Connectors Market Value (US$ Mn), By End User 2018-2026
FIG. 85 Japan Medical Connectors Market Value (US$ Mn), By Application 2012-2017
FIG. 86 Japan Medical Connectors Market Value (US$ Mn), By Application 2018-2026
FIG. 87 APEJ Medical Connectors Market Value (US$ Mn), By Country 2012-2017
FIG. 88 APEJ Medical Connectors Market Value (US$ Mn), By Country 2018-2026
FIG. 89 APEJ Medical Connectors Market Value (US$ Mn), By Product Type 2012-2017
FIG. 90 APEJ Medical Connectors Market Value (US$ Mn), By Product Type 2018-2026
FIG. 91 APEJ Medical Connectors Market Value (US$ Mn), By End User 2012-2017
FIG. 92 APEJ Medical Connectors Market Value (US$ Mn), By End User 2018-2026
FIG. 93 APEJ Medical Connectors Market Value (US$ Mn), By Application 2012-2017
FIG. 94 APEJ Medical Connectors Market Value (US$ Mn), By Application 2018-2026
FIG. 95 MEA Medical Connectors Market Value (US$ Mn), By Country 2012-2017
FIG. 96 MEA Medical Connectors Market Value (US$ Mn), By Country 2018-2026
FIG. 97 MEA Medical Connectors Market Value (US$ Mn), By Product Type 2012-2017
FIG. 98 MEA Medical Connectors Market Value (US$ Mn), By Product Type 2018-2026
FIG. 99 MEA Medical Connectors Market Value (US$ Mn), By End User 2012-2017
FIG. 100 MEA Medical Connectors Market Value (US$ Mn), By End User 2018-2026
FIG. 101 MEA Medical Connectors Market Value (US$ Mn), By Application 2012-2017
FIG. 102 MEA Medical Connectors Market Value (US$ Mn), By Application 2018-2026
Copyright © Transparency Market Research, Inc. All Rights reserved
Trust Online

Medical Connectors Market