

Reports
Reports
The global mechanically separated meat market size was valued at USD 276.5 Million in 2025 and is projected to reach USD 434.7 Million by 2036, expanding at a CAGR of 4.2% from 2026 to 2036. The market growth is attributed to the increasing demand for efficient use of meat-processing raw materials, increasing production of poultry and pork for processed-food applications and continuous innovations in mechanical separation, food-safety controls, cold-chain management, traceability and quality-monitoring technologies across the world.
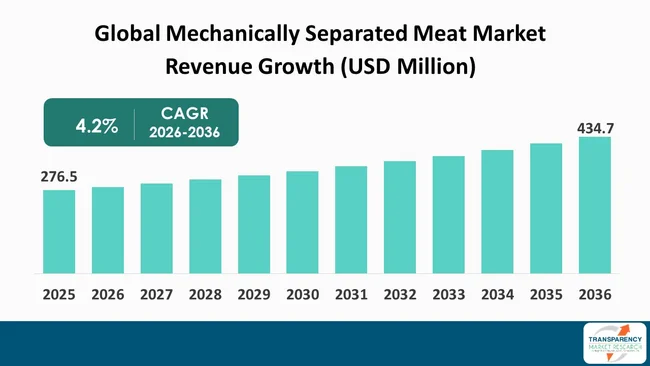
The mechanically separated meat market forms an important part of the broader global meat-processing industry, supporting efficient recovery of edible tissue from poultry, pork, and other permitted species. The market is propelled by the need for inexpensive protein constituents, consistent textures, and greater use of carcass material. Regulatory requirements remain critical as processing methods, labeling, species eligibility and permitted uses vary from jurisdiction to jurisdiction.
The Food and Agriculture Organization said that 374 million tons of meat were produced globally in 2024. This extensive production base supports the availability of raw material for mechanically recovered ingredients, especially where poultry and pork processing yields bone-associated edible tissue. The market is still closely tied to slaughter volumes, processing efficiency and downstream demand for processed foods.
Poultry’s strong position in global protein growth is also shaping the market. Producers are becoming increasingly focused on yield optimization, food safety, traceability and consistent ingredient performance across facilities. These priorities drive investment in separation, chilling, handling and formulation systems that can convert residual edible tissue into usable food ingredients.
The market has a functional role in the manufacturing of processed meat and the use of resources in general. The best growth opportunities are in areas where processors combine efficient raw-material recovery with strict quality controls, reliable cold chains and compliance with food-safety rules. Future market growth will be influenced by protein demand, poultry-processing capacity, regulatory requirements, and manufacturers’ ability to consistently supply high-quality products.
“Mechanically separated meat” means a meat ingredient obtained by the mechanical separation of edible tissue from bones or parts of carcasses after conventional cutting or deboning. The process employs pressure and sieves, separators or the like to recover meat in a finely comminuted form. The resulting material can provide consistent texture and functional properties in processed food products.
The Mechanically Separated Meat Market consists of products made from eligible poultry, pork and other species permitted by national regulations. Uses include sausages, nuggets, patties, meatballs, luncheon meat products, and other heat-treated preparations. The product properties depend on the raw materials, the separation technology, the pressure, the temperature, the particle size, the fat content and the handling conditions.
The Mechanically Separated Meat Market is closely related to slaughtering, deboning, food processing, cold-chain management and regulatory compliance. During production, manufacturers must control hygiene, temperature, traceability and ingredient specifications. The Market therefore functions as a link between primary meat processing and the manufacturing of value-added prepared foods, supporting more complete utilization of edible animal tissue.
| Attribute | Detail |
|---|---|
| Market Drivers |
|
The growth of poultry production is strengthening the base of the mechanically separated meat market, as poultry slaughtering generates substantial volumes of edible tissue remaining on bones after conventional processing. The market rewards processors who can improve raw-material utilization and deliver affordable ingredients for manufacturers of sausages, nuggets, patties, and other prepared foods. The cost competitiveness of poultry is also driving demand for processed poultry ingredients in consumer markets and foodservice channels around the world.
Global poultry consumption is projected to grow by 20% by 2035, according to the 2026 OECD-FAO Agricultural Outlook. This outlook implies further expansion of the poultry protein base supplying downstream processing. Higher demand for poultry in the Mechanically Separated Meat Market could lead to increased throughput at slaughter and deboning facilities, presenting opportunities to efficiently recover edible tissue and better utilize processing streams.
The functional properties of recovered poultry meat also support market demand. The fine structure can be used to provide binding, moisture retention, texture and protein content in heat treated products. Processors can standardize formulations through mechanical separation of ingredients with controlled fat, temperature, particle characteristics and microbiological quality. That makes consistent production performance a key buying consideration.
With the expansion of poultry processing, the mechanically separated meat market has opportunities to capitalize on investments in automated separation, hygienic handling, chilling and quality monitoring. Producers that combine recovery operations with existing deboning lines can improve material utilization and reduce avoidable losses. The greatest opportunity exists where food manufacturers require reliable and inexpensive poultry ingredients and where the regulatory environment allows for their use in well-defined applications. These conditions support efficient and compliant recovery processes.
The mechanically separated meat market is being supported by increasing urbanization, which is concentrating consumers, foodservice activity, retail distribution, and prepared-food manufacturing in large population centers. The market benefits from urban food systems that require ingredients capable of being processed consistently, transported efficiently, and incorporated into convenient food products. These requirements can be met by mechanically separated ingredients made to controlled specifications.
The United Nations World Urbanization Prospects 2025 report shows that cities accounted for 45% of the world population in 2025. This ongoing urban transformation matters to the Mechanically Separated Meat Market because larger urban food networks create demand for the standardized meat inputs that are used in ready-to-cook and heat-treated products. Processors can respond with centralized manufacturing, cold-chain distribution, higher-throughput ingredient production, and dependable procurement.
The market is also linked to shifting urban eating habits. Demand for convenience and reduced preparation time is an important driver among busy households and foodservice operators. Mechanically separated meat can be used as a functional ingredient in sausages, nuggets, meatballs, formed products and other prepared foods. This offers a practical link between urban food demand and industrial meat processing.
Urbanization also leads to investment in logistics, automation, traceability and production planning in the mechanically separated meat market. Manufacturers who supply dense retail and foodservice networks need reliable supply and consistent ingredient specifications. Efficient separation, combined with robust cold-chain controls, can improve service to downstream processors and retailers. As urban food systems grow increasingly integrated, the need for reliable, scalable meat ingredients will continue to support market growth across expanding urban food systems and foodservice networks.
Increasing adoption of resource-efficient meat-processing practices creates a significant opportunity for the mechanically separated meat market. Mechanical recovery can transform edible tissue left over from conventional cutting into standardized ingredients for further processing. It allows a more complete utilization of livestock resources and can improve the economics of integrated slaughtering and deboning operations across large processing networks. This allows the market to benefit as processors focus more on yield, material efficiency and value recovery.
According to the 2025 OECD-FAO Agricultural Outlook, the global production of meat, dairy products and eggs is projected to increase by 17% by 2034. Increasing production of animal-source foods can increase the amount of processing base available to manufacturers of recovered meat ingredients. The opportunity is particularly relevant to the mechanically separated meat market in regions investing in modern slaughtering, deboning, cold-chain infrastructure and food manufacturing capacity.
Technologies that improve separation consistency and food safety can further support market development. Sophisticated equipment is available to help processors manage pressure, particle properties, temperature, hygiene and throughput. Improved process control enables manufacturers to meet tighter customer specifications and support more consistent performance in downstream formulations. Digital monitoring and automated quality checks can increase traceability.
Another opportunity is to develop differentiated ingredient grades for specific applications. Poultry, pork and permitted species can be used to meet a variety of formulation requirements depending upon the texture, fat level, processing conditions and regulations. The mechanically separated meat market can add value by providing reliable, application-specific product specifications rather than treating recovered meat as a generic commodity. This can strengthen relationships and utilization.
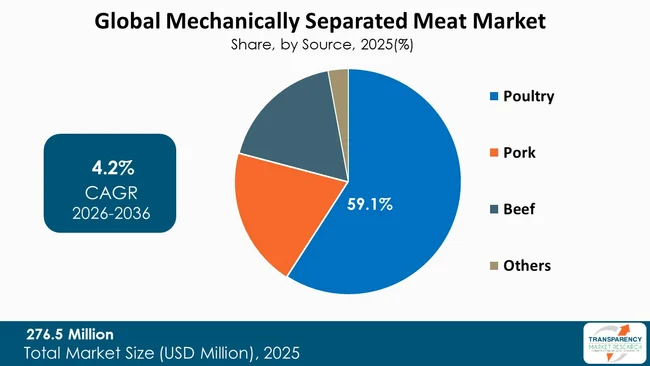
The mechanically separated meat market is segmented by source into poultry, pork, beef, and other sources. Poultry is the largest segment and accounts for 59.1% of the market in the segmentation provided for this report. The poultry segment leads the market because mechanical recovery is widely used in poultry processing to recover edible tissue remaining on bones. Demand is therefore closely linked to chicken and turkey processing and downstream production of sausages, nuggets, and other heat-treated meat products.
Another key source segment in the mechanically separated meat market is Pork. Pork-based mechanically separated material is used where regulations allow and processors demand a consistent texture and performance. The volume of pork slaughtered, deboning practices, food safety requirements and national standards for allowed uses in processed foods impact the segment. Participation varies by jurisdiction and market.
Beef is a more limited source segment, as regulatory treatment varies by country and can restrict certain applications. For example, the European Union prohibits the use of mechanically separated meat from bovine, ovine, and caprine bones. Species eligibility and processing methods are therefore important considerations. Poultry remains dominant, while pork and beef offer additional opportunities depending on product specifications and regulatory requirements.
| Attribute | Detail |
|---|---|
| Leading Region |
|
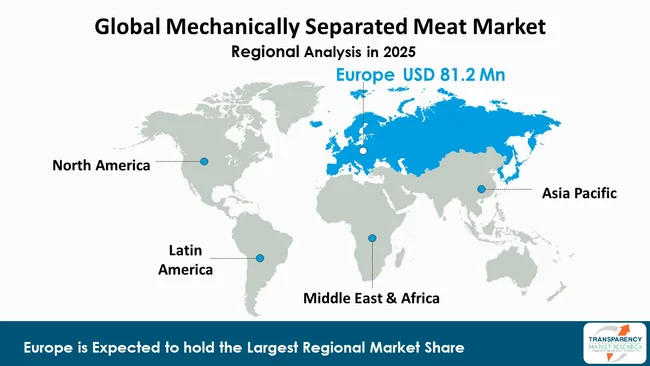
Europe dominated the global mechanically separated meat market in 2025, accounting for approximately 29.4% of total market revenue. The region has a well-established regulatory framework covering production, hygiene, labeling, processing conditions, and permitted uses. This means that the European market is heavily driven by formal food safety control and specific requirements for approved establishments, raw materials, storage and downstream applications.
European regulations classify mechanically separated meat according to the technique used and impose certain controls on the handling and use of the product. These requires processors to maintain documented procedures, controlled temperatures, traceability, and validated food-safety systems. The European Commission has also harmonized rules on food hygiene applying to food businesses in the Member States, giving a consistent regulatory basis for meat processing.
Elsewhere in the world, the market is still important in North America, Latin America, and Asia Pacific, where large poultry and pork-processing industries provide substantial raw-material availability. Regulatory approaches differ, especially for applications, labeling, and species eligibility. Thus the market evolves according to local food standards, processing infrastructure, consumer demand and trade requirements. The dominant region in the requested market structure is Europe, while other regions offer opportunities in expanded poultry processing, prepared food production and modern cold chain systems.
AMPASA, Belwood Foods Ltd., BRF S.A., Cargill, DG Foods LLC, DTS Meat Processing N.V., Favid, J.A. ter Maten B.V., JBS S.A., Kipco-Damaco N.V., Krak-Tol Meat Deboning Plant, Nizami Foods, Polskamp Meat Industrie B.V., Tip Top Poultry, Inc., and Tyson Foods, Inc. are some of the leading manufacturers operating in the global Mechanically Separated Meat market. Each of these companies has been profiled in the global Mechanically Separated Meat industry report based on parameters such as company overview, business strategies, financial overview, business segments, product portfolio, and recent developments.
| Attribute | Detail |
|---|---|
| Market Size Value in 2025 (Base Year) | USD 276.5 Million |
| Market Forecast Value in 2036 | USD 434.7 Million |
| Growth Rate (CAGR 2026 to 2036) | 4.2% |
| Forecast Period | 2026-2036 |
| Historical data Available for | 2021-2025 |
| Quantitative Units | USD Million for Value and Tons for Volume |
| Market Analysis | Global qualitative analysis includes drivers, restraints, opportunities, key trends, key market indicators, Porter’s Five Forces analysis, value chain analysis, SWOT analysis, etc. Furthermore, at the regional level, qualitative analysis includes key trends, price trends, and key supplier analysis. |
| Competition Landscape |
|
| Format | Electronic (PDF) + Excel |
| Market Segmentation | Source
|
| Regions Covered |
|
| Countries Covered |
|
| Companies Profiled |
|
| Customization Scope | Available upon request |
| Pricing | Available upon request |
The global mechanically separated meat market was valued at USD 276.5 Million in 2025.
The global mechanically separated meat industry is projected to reach USD 434.7 Million by 2036.
Key drivers include growing poultry production and protein demand, along with increasing urbanization and convenience-focused food demand.
The global mechanically separated meat market is anticipated to expand at a CAGR of 4.2% from 2026 to 2036.
Europe dominated the global mechanically separated meat market in 2025, accounting for approximately 29.4% of total market revenue.
AMPASA, Belwood Foods Ltd., BRF S.A., Cargill, DG Foods LLC, DTS Meat Processing N.V., Favid, J.A. ter Maten B.V., JBS S.A., Kipco-Damaco N.V., Krak-Tol Meat Deboning Plant, Nizami Foods, Polskamp Meat Industrie B.V., Tip Top Poultry, Inc., and Tyson Foods, Inc. are among the prominent players operating in the global mechanically separated meat market.
Table 01: Global Mechanically Separated Meat Market Value (USD Million) Projection, By Source 2021 to 2036
Table 02: Global Mechanically Separated Meat Market Volume (Tons) Projection, By Source 2021 to 2036
Table 03: Global Mechanically Separated Meat Market Value (USD Million) Projection, By Form 2021 to 2036
Table 04: Global Mechanically Separated Meat Market Volume (Tons) Projection, By Form 2021 to 2036
Table 05: Global Mechanically Separated Meat Market Value (USD Million) Projection, By Processing Technology 2021 to 2036
Table 06: Global Mechanically Separated Meat Market Volume (Tons) Projection, By Processing Technology 2021 to 2036
Table 07: Global Mechanically Separated Meat Market Value (USD Million) Projection, By Application 2021 to 2036
Table 08: Global Mechanically Separated Meat Market Volume (Tons) Projection, By Application 2021 to 2036
Table 09: Global Mechanically Separated Meat Market Value (USD Million) Projection, By End-user 2021 to 2036
Table 10: Global Mechanically Separated Meat Market Volume (Tons) Projection, By End-user 2021 to 2036
Table 11: Global Mechanically Separated Meat Market Value (USD Million) Projection, By Distribution Channel 2021 to 2036
Table 12: Global Mechanically Separated Meat Market Volume (Tons) Projection, By Distribution Channel 2021 to 2036
Table 13: Global Mechanically Separated Meat Market Value (USD Million) Projection, By Country 2021 to 2036
Table 14: Global Mechanically Separated Meat Market Volume (Tons) Projection, By Country 2021 to 2036
Table 15: North America Global Mechanically Separated Meat Market Value (USD Million) Projection, By Source 2021 to 2036
Table 16: North America Global Mechanically Separated Meat Market Volume (Tons) Projection, By Source 2021 to 2036
Table 17: North America Global Mechanically Separated Meat Market Value (USD Million) Projection, By Form 2021 to 2036
Table 18: North America Global Mechanically Separated Meat Market Volume (Tons) Projection, By Form 2021 to 2036
Table 19: North America Global Mechanically Separated Meat Market Value (USD Million) Projection, By Processing Technology 2021 to 2036
Table 20: North America Global Mechanically Separated Meat Market Volume (Tons) Projection, By Processing Technology 2021 to 2036
Table 21: North America Global Mechanically Separated Meat Market Value (USD Million) Projection, By Application 2021 to 2036
Table 22: North America Global Mechanically Separated Meat Market Volume (Tons) Projection, By Application 2021 to 2036
Table 23: North America Global Mechanically Separated Meat Market Value (USD Million) Projection, By End-user 2021 to 2036
Table 24: North America Global Mechanically Separated Meat Market Volume (Tons) Projection, By End-user 2021 to 2036
Table 25: North America Global Mechanically Separated Meat Market Value (USD Million) Projection, By Distribution Channel 2021 to 2036
Table 26: North America Global Mechanically Separated Meat Market Volume (Tons) Projection, By Distribution Channel 2021 to 2036
Table 27: North America Global Mechanically Separated Meat Market Value (USD Million) Projection, By Country 2021 to 2036
Table 28: North America Global Mechanically Separated Meat Market Volume (Tons) Projection, By Country 2021 to 2036
Table 29: U.S. Global Mechanically Separated Meat Market Value (USD Million) Projection, By Source 2021 to 2036
Table 30: U.S. Global Mechanically Separated Meat Market Volume (Tons) Projection, By Source 2021 to 2036
Table 31: U.S. Global Mechanically Separated Meat Market Value (USD Million) Projection, By Form 2021 to 2036
Table 32: U.S. Global Mechanically Separated Meat Market Volume (Tons) Projection, By Form 2021 to 2036
Table 33: U.S. Global Mechanically Separated Meat Market Value (USD Million) Projection, By Processing Technology 2021 to 2036
Table 34: U.S. Global Mechanically Separated Meat Market Volume (Tons) Projection, By Processing Technology 2021 to 2036
Table 35: U.S. Global Mechanically Separated Meat Market Value (USD Million) Projection, By Application 2021 to 2036
Table 36: U.S. Global Mechanically Separated Meat Market Volume (Tons) Projection, By Application 2021 to 2036
Table 37: U.S. Global Mechanically Separated Meat Market Value (USD Million) Projection, By End-user 2021 to 2036
Table 38: U.S. Global Mechanically Separated Meat Market Volume (Tons) Projection, By End-user 2021 to 2036
Table 39: U.S. Global Mechanically Separated Meat Market Value (USD Million) Projection, By Distribution Channel 2021 to 2036
Table 40: U.S. Global Mechanically Separated Meat Market Volume (Tons) Projection, By Distribution Channel 2021 to 2036
Table 41: Canada Global Mechanically Separated Meat Market Value (USD Million) Projection, By Source 2021 to 2036
Table 42: Canada Global Mechanically Separated Meat Market Volume (Tons) Projection, By Source 2021 to 2036
Table 43: Canada Global Mechanically Separated Meat Market Value (USD Million) Projection, By Form 2021 to 2036
Table 44: Canada Global Mechanically Separated Meat Market Volume (Tons) Projection, By Form 2021 to 2036
Table 45: Canada Global Mechanically Separated Meat Market Value (USD Million) Projection, By Processing Technology 2021 to 2036
Table 46: Canada Global Mechanically Separated Meat Market Volume (Tons) Projection, By Processing Technology 2021 to 2036
Table 47: Canada Global Mechanically Separated Meat Market Value (USD Million) Projection, By Application 2021 to 2036
Table 48: Canada Global Mechanically Separated Meat Market Volume (Tons) Projection, By Application 2021 to 2036
Table 49: Canada Global Mechanically Separated Meat Market Value (USD Million) Projection, By End-user 2021 to 2036
Table 50: Canada Global Mechanically Separated Meat Market Volume (Tons) Projection, By End-user 2021 to 2036
Table 51: Canada Global Mechanically Separated Meat Market Value (USD Million) Projection, By Distribution Channel 2021 to 2036
Table 52: Canada Global Mechanically Separated Meat Market Volume (Tons) Projection, By Distribution Channel 2021 to 2036
Table 53: Europe Global Mechanically Separated Meat Market Value (USD Million) Projection, By Source 2021 to 2036
Table 54: Europe Global Mechanically Separated Meat Market Volume (Tons) Projection, By Source 2021 to 2036
Table 55: Europe Global Mechanically Separated Meat Market Value (USD Million) Projection, By Form 2021 to 2036
Table 56: Europe Global Mechanically Separated Meat Market Volume (Tons) Projection, By Form 2021 to 2036
Table 57: Europe Global Mechanically Separated Meat Market Value (USD Million) Projection, By Processing Technology 2021 to 2036
Table 58: Europe Global Mechanically Separated Meat Market Volume (Tons) Projection, By Processing Technology 2021 to 2036
Table 59: Europe Global Mechanically Separated Meat Market Value (USD Million) Projection, By Application 2021 to 2036
Table 60: Europe Global Mechanically Separated Meat Market Volume (Tons) Projection, By Application 2021 to 2036
Table 61: Europe Global Mechanically Separated Meat Market Value (USD Million) Projection, By End-user 2021 to 2036
Table 62: Europe Global Mechanically Separated Meat Market Volume (Tons) Projection, By End-user 2021 to 2036
Table 63: Europe Global Mechanically Separated Meat Market Value (USD Million) Projection, By Distribution Channel 2021 to 2036
Table 64: Europe Global Mechanically Separated Meat Market Volume (Tons) Projection, By Distribution Channel 2021 to 2036
Table 65: Europe Global Mechanically Separated Meat Market Value (USD Million) Projection, By Country 2021 to 2036
Table 66: Europe Global Mechanically Separated Meat Market Volume (Tons) Projection, By Country 2021 to 2036
Table 67: U.K. Global Mechanically Separated Meat Market Value (USD Million) Projection, By Source 2021 to 2036
Table 68: U.K. Global Mechanically Separated Meat Market Volume (Tons) Projection, By Source 2021 to 2036
Table 69: U.K. Global Mechanically Separated Meat Market Value (USD Million) Projection, By Form 2021 to 2036
Table 70: U.K. Global Mechanically Separated Meat Market Volume (Tons) Projection, By Form 2021 to 2036
Table 71: U.K. Global Mechanically Separated Meat Market Value (USD Million) Projection, By Processing Technology 2021 to 2036
Table 72: U.K. Global Mechanically Separated Meat Market Volume (Tons) Projection, By Processing Technology 2021 to 2036
Table 73: U.K. Global Mechanically Separated Meat Market Value (USD Million) Projection, By Application 2021 to 2036
Table 74: U.K. Global Mechanically Separated Meat Market Volume (Tons) Projection, By Application 2021 to 2036
Table 75: U.K. Global Mechanically Separated Meat Market Value (USD Million) Projection, By End-user 2021 to 2036
Table 76: U.K. Global Mechanically Separated Meat Market Volume (Tons) Projection, By End-user 2021 to 2036
Table 77: U.K. Global Mechanically Separated Meat Market Value (USD Million) Projection, By Distribution Channel 2021 to 2036
Table 78: U.K. Global Mechanically Separated Meat Market Volume (Tons) Projection, By Distribution Channel 2021 to 2036
Table 79: Germany Global Mechanically Separated Meat Market Value (USD Million) Projection, By Source 2021 to 2036
Table 80: Germany Global Mechanically Separated Meat Market Volume (Tons) Projection, By Source 2021 to 2036
Table 81: Germany Global Mechanically Separated Meat Market Value (USD Million) Projection, By Form 2021 to 2036
Table 82: Germany Global Mechanically Separated Meat Market Volume (Tons) Projection, By Form 2021 to 2036
Table 83: Germany Global Mechanically Separated Meat Market Value (USD Million) Projection, By Processing Technology 2021 to 2036
Table 84: Germany Global Mechanically Separated Meat Market Volume (Tons) Projection, By Processing Technology 2021 to 2036
Table 85: Germany Global Mechanically Separated Meat Market Value (USD Million) Projection, By Application 2021 to 2036
Table 86: Germany Global Mechanically Separated Meat Market Volume (Tons) Projection, By Application 2021 to 2036
Table 87: Germany Global Mechanically Separated Meat Market Value (USD Million) Projection, By End-user 2021 to 2036
Table 88: Germany Global Mechanically Separated Meat Market Volume (Tons) Projection, By End-user 2021 to 2036
Table 89: Germany Global Mechanically Separated Meat Market Value (USD Million) Projection, By Distribution Channel 2021 to 2036
Table 90: Germany Global Mechanically Separated Meat Market Volume (Tons) Projection, By Distribution Channel 2021 to 2036
Table 91: France Global Mechanically Separated Meat Market Value (USD Million) Projection, By Source 2021 to 2036
Table 92: France Global Mechanically Separated Meat Market Volume (Tons) Projection, By Source 2021 to 2036
Table 93: France Global Mechanically Separated Meat Market Value (USD Million) Projection, By Form 2021 to 2036
Table 94: France Global Mechanically Separated Meat Market Volume (Tons) Projection, By Form 2021 to 2036
Table 95: France Global Mechanically Separated Meat Market Value (USD Million) Projection, By Processing Technology 2021 to 2036
Table 96: France Global Mechanically Separated Meat Market Volume (Tons) Projection, By Processing Technology 2021 to 2036
Table 97: France Global Mechanically Separated Meat Market Value (USD Million) Projection, By Application 2021 to 2036
Table 98: France Global Mechanically Separated Meat Market Volume (Tons) Projection, By Application 2021 to 2036
Table 99: France Global Mechanically Separated Meat Market Value (USD Million) Projection, By End-user 2021 to 2036
Table 100: France Global Mechanically Separated Meat Market Volume (Tons) Projection, By End-user 2021 to 2036
Table 101: France Global Mechanically Separated Meat Market Value (USD Million) Projection, By Distribution Channel 2021 to 2036
Table 102: France Global Mechanically Separated Meat Market Volume (Tons) Projection, By Distribution Channel 2021 to 2036
Table 103: Italy Global Mechanically Separated Meat Market Value (USD Million) Projection, By Source 2021 to 2036
Table 104: Italy Global Mechanically Separated Meat Market Volume (Tons) Projection, By Source 2021 to 2036
Table 105: Italy Global Mechanically Separated Meat Market Value (USD Million) Projection, By Form 2021 to 2036
Table 106: Italy Global Mechanically Separated Meat Market Volume (Tons) Projection, By Form 2021 to 2036
Table 107: Italy Global Mechanically Separated Meat Market Value (USD Million) Projection, By Processing Technology 2021 to 2036
Table 108: Italy Global Mechanically Separated Meat Market Volume (Tons) Projection, By Processing Technology 2021 to 2036
Table 109: Italy Global Mechanically Separated Meat Market Value (USD Million) Projection, By Application 2021 to 2036
Table 110: Italy Global Mechanically Separated Meat Market Volume (Tons) Projection, By Application 2021 to 2036
Table 111: Italy Global Mechanically Separated Meat Market Value (USD Million) Projection, By End-user 2021 to 2036
Table 112: Italy Global Mechanically Separated Meat Market Volume (Tons) Projection, By End-user 2021 to 2036
Table 113: Italy Global Mechanically Separated Meat Market Value (USD Million) Projection, By Distribution Channel 2021 to 2036
Table 114: Italy Global Mechanically Separated Meat Market Volume (Tons) Projection, By Distribution Channel 2021 to 2036
Table 115: Spain Global Mechanically Separated Meat Market Value (USD Million) Projection, By Source 2021 to 2036
Table 116: Spain Global Mechanically Separated Meat Market Volume (Tons) Projection, By Source 2021 to 2036
Table 117: Spain Global Mechanically Separated Meat Market Value (USD Million) Projection, By Form 2021 to 2036
Table 118: Spain Global Mechanically Separated Meat Market Volume (Tons) Projection, By Form 2021 to 2036
Table 119: Spain Global Mechanically Separated Meat Market Value (USD Million) Projection, By Processing Technology 2021 to 2036
Table 120: Spain Global Mechanically Separated Meat Market Volume (Tons) Projection, By Processing Technology 2021 to 2036
Table 121: Spain Global Mechanically Separated Meat Market Value (USD Million) Projection, By Application 2021 to 2036
Table 122: Spain Global Mechanically Separated Meat Market Volume (Tons) Projection, By Application 2021 to 2036
Table 123: Spain Global Mechanically Separated Meat Market Value (USD Million) Projection, By End-user 2021 to 2036
Table 124: Spain Global Mechanically Separated Meat Market Volume (Tons) Projection, By End-user 2021 to 2036
Table 125: Spain Global Mechanically Separated Meat Market Value (USD Million) Projection, By Distribution Channel 2021 to 2036
Table 126: Spain Global Mechanically Separated Meat Market Volume (Tons) Projection, By Distribution Channel 2021 to 2036
Table 127: The Netherlands Global Mechanically Separated Meat Market Value (USD Million) Projection, By Source 2021 to 2036
Table 128: The Netherlands Global Mechanically Separated Meat Market Volume (Tons) Projection, By Source 2021 to 2036
Table 129: The Netherlands Global Mechanically Separated Meat Market Value (USD Million) Projection, By Form 2021 to 2036
Table 130: The Netherlands Global Mechanically Separated Meat Market Volume (Tons) Projection, By Form 2021 to 2036
Table 131: The Netherlands Global Mechanically Separated Meat Market Value (USD Million) Projection, By Processing Technology 2021 to 2036
Table 132: The Netherlands Global Mechanically Separated Meat Market Volume (Tons) Projection, By Processing Technology 2021 to 2036
Table 133: The Netherlands Global Mechanically Separated Meat Market Value (USD Million) Projection, By Application 2021 to 2036
Table 134: The Netherlands Global Mechanically Separated Meat Market Volume (Tons) Projection, By Application 2021 to 2036
Table 135: The Netherlands Global Mechanically Separated Meat Market Value (USD Million) Projection, By End-user 2021 to 2036
Table 136: The Netherlands Global Mechanically Separated Meat Market Volume (Tons) Projection, By End-user 2021 to 2036
Table 137: The Netherlands Global Mechanically Separated Meat Market Value (USD Million) Projection, By Distribution Channel 2021 to 2036
Table 138: The Netherlands Global Mechanically Separated Meat Market Volume (Tons) Projection, By Distribution Channel 2021 to 2036
Table 139: Asia Pacific Global Mechanically Separated Meat Market Value (USD Million) Projection, By Source 2021 to 2036
Table 140: Asia Pacific Global Mechanically Separated Meat Market Volume (Tons) Projection, By Source 2021 to 2036
Table 141: Asia Pacific Global Mechanically Separated Meat Market Value (USD Million) Projection, By Form 2021 to 2036
Table 142: Asia Pacific Global Mechanically Separated Meat Market Volume (Tons) Projection, By Form 2021 to 2036
Table 143: Asia Pacific Global Mechanically Separated Meat Market Value (USD Million) Projection, By Processing Technology 2021 to 2036
Table 144: Asia Pacific Global Mechanically Separated Meat Market Volume (Tons) Projection, By Processing Technology 2021 to 2036
Table 145: Asia Pacific Global Mechanically Separated Meat Market Value (USD Million) Projection, By Application 2021 to 2036
Table 146: Asia Pacific Global Mechanically Separated Meat Market Volume (Tons) Projection, By Application 2021 to 2036
Table 147: Asia Pacific Global Mechanically Separated Meat Market Value (USD Million) Projection, By End-user 2021 to 2036
Table 148: Asia Pacific Global Mechanically Separated Meat Market Volume (Tons) Projection, By End-user 2021 to 2036
Table 149: Asia Pacific Global Mechanically Separated Meat Market Value (USD Million) Projection, By Distribution Channel 2021 to 2036
Table 150: Asia Pacific Global Mechanically Separated Meat Market Volume (Tons) Projection, By Distribution Channel 2021 to 2036
Table 151: Asia Pacific Global Mechanically Separated Meat Market Value (USD Million) Projection, By Country 2021 to 2036
Table 152: Asia Pacific Global Mechanically Separated Meat Market Volume (Tons) Projection, By Country 2021 to 2036
Table 153: China Global Mechanically Separated Meat Market Value (USD Million) Projection, By Source 2021 to 2036
Table 154: China Global Mechanically Separated Meat Market Volume (Tons) Projection, By Source 2021 to 2036
Table 155: China Global Mechanically Separated Meat Market Value (USD Million) Projection, By Form 2021 to 2036
Table 156: China Global Mechanically Separated Meat Market Volume (Tons) Projection, By Form 2021 to 2036
Table 157: China Global Mechanically Separated Meat Market Value (USD Million) Projection, By Processing Technology 2021 to 2036
Table 158: China Global Mechanically Separated Meat Market Volume (Tons) Projection, By Processing Technology 2021 to 2036
Table 159: China Global Mechanically Separated Meat Market Value (USD Million) Projection, By Application 2021 to 2036
Table 160: China Global Mechanically Separated Meat Market Volume (Tons) Projection, By Application 2021 to 2036
Table 161: China Global Mechanically Separated Meat Market Value (USD Million) Projection, By End-user 2021 to 2036
Table 162: China Global Mechanically Separated Meat Market Volume (Tons) Projection, By End-user 2021 to 2036
Table 163: China Global Mechanically Separated Meat Market Value (USD Million) Projection, By Distribution Channel 2021 to 2036
Table 164: China Global Mechanically Separated Meat Market Volume (Tons) Projection, By Distribution Channel 2021 to 2036
Table 165: India Global Mechanically Separated Meat Market Value (USD Million) Projection, By Source 2021 to 2036
Table 166: India Global Mechanically Separated Meat Market Volume (Tons) Projection, By Source 2021 to 2036
Table 167: India Global Mechanically Separated Meat Market Value (USD Million) Projection, By Form 2021 to 2036
Table 168: India Global Mechanically Separated Meat Market Volume (Tons) Projection, By Form 2021 to 2036
Table 169: India Global Mechanically Separated Meat Market Value (USD Million) Projection, By Processing Technology 2021 to 2036
Table 170: India Global Mechanically Separated Meat Market Volume (Tons) Projection, By Processing Technology 2021 to 2036
Table 171: India Global Mechanically Separated Meat Market Value (USD Million) Projection, By Application 2021 to 2036
Table 172: India Global Mechanically Separated Meat Market Volume (Tons) Projection, By Application 2021 to 2036
Table 173: India Global Mechanically Separated Meat Market Value (USD Million) Projection, By End-user 2021 to 2036
Table 174: India Global Mechanically Separated Meat Market Volume (Tons) Projection, By End-user 2021 to 2036
Table 175: India Global Mechanically Separated Meat Market Value (USD Million) Projection, By Distribution Channel 2021 to 2036
Table 176: India Global Mechanically Separated Meat Market Volume (Tons) Projection, By Distribution Channel 2021 to 2036
Table 177: Japan Global Mechanically Separated Meat Market Value (USD Million) Projection, By Source 2021 to 2036
Table 178: Japan Global Mechanically Separated Meat Market Volume (Tons) Projection, By Source 2021 to 2036
Table 179: Japan Global Mechanically Separated Meat Market Value (USD Million) Projection, By Form 2021 to 2036
Table 180: Japan Global Mechanically Separated Meat Market Volume (Tons) Projection, By Form 2021 to 2036
Table 181: Japan Global Mechanically Separated Meat Market Value (USD Million) Projection, By Processing Technology 2021 to 2036
Table 182: Japan Global Mechanically Separated Meat Market Volume (Tons) Projection, By Processing Technology 2021 to 2036
Table 183: Japan Global Mechanically Separated Meat Market Value (USD Million) Projection, By Application 2021 to 2036
Table 184: Japan Global Mechanically Separated Meat Market Volume (Tons) Projection, By Application 2021 to 2036
Table 185: Japan Global Mechanically Separated Meat Market Value (USD Million) Projection, By End-user 2021 to 2036
Table 186: Japan Global Mechanically Separated Meat Market Volume (Tons) Projection, By End-user 2021 to 2036
Table 187: Japan Global Mechanically Separated Meat Market Value (USD Million) Projection, By Distribution Channel 2021 to 2036
Table 188: Japan Global Mechanically Separated Meat Market Volume (Tons) Projection, By Distribution Channel 2021 to 2036
Table 189: Australia Global Mechanically Separated Meat Market Value (USD Million) Projection, By Source 2021 to 2036
Table 190: Australia Global Mechanically Separated Meat Market Volume (Tons) Projection, By Source 2021 to 2036
Table 191: Australia Global Mechanically Separated Meat Market Value (USD Million) Projection, By Form 2021 to 2036
Table 192: Australia Global Mechanically Separated Meat Market Volume (Tons) Projection, By Form 2021 to 2036
Table 193: Australia Global Mechanically Separated Meat Market Value (USD Million) Projection, By Processing Technology 2021 to 2036
Table 194: Australia Global Mechanically Separated Meat Market Volume (Tons) Projection, By Processing Technology 2021 to 2036
Table 195: Australia Global Mechanically Separated Meat Market Value (USD Million) Projection, By Application 2021 to 2036
Table 196: Australia Global Mechanically Separated Meat Market Volume (Tons) Projection, By Application 2021 to 2036
Table 197: Australia Global Mechanically Separated Meat Market Value (USD Million) Projection, By End-user 2021 to 2036
Table 198: Australia Global Mechanically Separated Meat Market Volume (Tons) Projection, By End-user 2021 to 2036
Table 199: Australia Global Mechanically Separated Meat Market Value (USD Million) Projection, By Distribution Channel 2021 to 2036
Table 200: Australia Global Mechanically Separated Meat Market Volume (Tons) Projection, By Distribution Channel 2021 to 2036
Table 201: South Korea Global Mechanically Separated Meat Market Value (USD Million) Projection, By Source 2021 to 2036
Table 202: South Korea Global Mechanically Separated Meat Market Volume (Tons) Projection, By Source 2021 to 2036
Table 203: South Korea Global Mechanically Separated Meat Market Value (USD Million) Projection, By Form 2021 to 2036
Table 204: South Korea Global Mechanically Separated Meat Market Volume (Tons) Projection, By Form 2021 to 2036
Table 205: South Korea Global Mechanically Separated Meat Market Value (USD Million) Projection, By Processing Technology 2021 to 2036
Table 206: South Korea Global Mechanically Separated Meat Market Volume (Tons) Projection, By Processing Technology 2021 to 2036
Table 207: South Korea Global Mechanically Separated Meat Market Value (USD Million) Projection, By Application 2021 to 2036
Table 208: South Korea Global Mechanically Separated Meat Market Volume (Tons) Projection, By Application 2021 to 2036
Table 209: South Korea Global Mechanically Separated Meat Market Value (USD Million) Projection, By End-user 2021 to 2036
Table 210: South Korea Global Mechanically Separated Meat Market Volume (Tons) Projection, By End-user 2021 to 2036
Table 211: South Korea Global Mechanically Separated Meat Market Value (USD Million) Projection, By Distribution Channel 2021 to 2036
Table 212: South Korea Global Mechanically Separated Meat Market Volume (Tons) Projection, By Distribution Channel 2021 to 2036
Table 213: ASEAN Global Mechanically Separated Meat Market Value (USD Million) Projection, By Source 2021 to 2036
Table 214: ASEAN Global Mechanically Separated Meat Market Volume (Tons) Projection, By Source 2021 to 2036
Table 215: ASEAN Global Mechanically Separated Meat Market Value (USD Million) Projection, By Form 2021 to 2036
Table 216: ASEAN Global Mechanically Separated Meat Market Volume (Tons) Projection, By Form 2021 to 2036
Table 217: ASEAN Global Mechanically Separated Meat Market Value (USD Million) Projection, By Processing Technology 2021 to 2036
Table 218: ASEAN Global Mechanically Separated Meat Market Volume (Tons) Projection, By Processing Technology 2021 to 2036
Table 219: ASEAN Global Mechanically Separated Meat Market Value (USD Million) Projection, By Application 2021 to 2036
Table 220: ASEAN Global Mechanically Separated Meat Market Volume (Tons) Projection, By Application 2021 to 2036
Table 221: ASEAN Global Mechanically Separated Meat Market Value (USD Million) Projection, By End-user 2021 to 2036
Table 222: ASEAN Global Mechanically Separated Meat Market Volume (Tons) Projection, By End-user 2021 to 2036
Table 223: ASEAN Global Mechanically Separated Meat Market Value (USD Million) Projection, By Distribution Channel 2021 to 2036
Table 224: ASEAN Global Mechanically Separated Meat Market Volume (Tons) Projection, By Distribution Channel 2021 to 2036
Table 225: Middle East & Africa Global Mechanically Separated Meat Market Value (USD Million) Projection, By Source 2021 to 2036
Table 226: Middle East & Africa Global Mechanically Separated Meat Market Volume (Tons) Projection, By Source 2021 to 2036
Table 227: Middle East & Africa Global Mechanically Separated Meat Market Value (USD Million) Projection, By Form 2021 to 2036
Table 228: Middle East & Africa Global Mechanically Separated Meat Market Volume (Tons) Projection, By Form 2021 to 2036
Table 229: Middle East & Africa Global Mechanically Separated Meat Market Value (USD Million) Projection, By Processing Technology 2021 to 2036
Table 230: Middle East & Africa Global Mechanically Separated Meat Market Volume (Tons) Projection, By Processing Technology 2021 to 2036
Table 231: Middle East & Africa Global Mechanically Separated Meat Market Value (USD Million) Projection, By Application 2021 to 2036
Table 232: Middle East & Africa Global Mechanically Separated Meat Market Volume (Tons) Projection, By Application 2021 to 2036
Table 233: Middle East & Africa Global Mechanically Separated Meat Market Value (USD Million) Projection, By End-user 2021 to 2036
Table 234: Middle East & Africa Global Mechanically Separated Meat Market Volume (Tons) Projection, By End-user 2021 to 2036
Table 235: Middle East & Africa Global Mechanically Separated Meat Market Value (USD Million) Projection, By Distribution Channel 2021 to 2036
Table 236: Middle East & Africa Global Mechanically Separated Meat Market Volume (Tons) Projection, By Distribution Channel 2021 to 2036
Table 237: Middle East & Africa Global Mechanically Separated Meat Market Value (USD Million) Projection, By Country 2021 to 2036
Table 238: Middle East & Africa Global Mechanically Separated Meat Market Volume (Tons) Projection, By Country 2021 to 2036
Table 239: GCC Countries Global Mechanically Separated Meat Market Value (USD Million) Projection, By Source 2021 to 2036
Table 240: GCC Countries Global Mechanically Separated Meat Market Volume (Tons) Projection, By Source 2021 to 2036
Table 241: GCC Countries Global Mechanically Separated Meat Market Value (USD Million) Projection, By Form 2021 to 2036
Table 242: GCC Countries Global Mechanically Separated Meat Market Volume (Tons) Projection, By Form 2021 to 2036
Table 243: GCC Countries Global Mechanically Separated Meat Market Value (USD Million) Projection, By Processing Technology 2021 to 2036
Table 244: GCC Countries Global Mechanically Separated Meat Market Volume (Tons) Projection, By Processing Technology 2021 to 2036
Table 245: GCC Countries Global Mechanically Separated Meat Market Value (USD Million) Projection, By Application 2021 to 2036
Table 246: GCC Countries Global Mechanically Separated Meat Market Volume (Tons) Projection, By Application 2021 to 2036
Table 247: GCC Countries Global Mechanically Separated Meat Market Value (USD Million) Projection, By End-user 2021 to 2036
Table 248: GCC Countries Global Mechanically Separated Meat Market Volume (Tons) Projection, By End-user 2021 to 2036
Table 249: GCC Countries Global Mechanically Separated Meat Market Value (USD Million) Projection, By Distribution Channel 2021 to 2036
Table 250: GCC Countries Global Mechanically Separated Meat Market Volume (Tons) Projection, By Distribution Channel 2021 to 2036
Table 251: South Africa Global Mechanically Separated Meat Market Value (USD Million) Projection, By Source 2021 to 2036
Table 252: South Africa Global Mechanically Separated Meat Market Volume (Tons) Projection, By Source 2021 to 2036
Table 253: South Africa Global Mechanically Separated Meat Market Value (USD Million) Projection, By Form 2021 to 2036
Table 254: South Africa Global Mechanically Separated Meat Market Volume (Tons) Projection, By Form 2021 to 2036
Table 255: South Africa Global Mechanically Separated Meat Market Value (USD Million) Projection, By Processing Technology 2021 to 2036
Table 256: South Africa Global Mechanically Separated Meat Market Volume (Tons) Projection, By Processing Technology 2021 to 2036
Table 257: South Africa Global Mechanically Separated Meat Market Value (USD Million) Projection, By Application 2021 to 2036
Table 258: South Africa Global Mechanically Separated Meat Market Volume (Tons) Projection, By Application 2021 to 2036
Table 259: South Africa Global Mechanically Separated Meat Market Value (USD Million) Projection, By End-user 2021 to 2036
Table 260: South Africa Global Mechanically Separated Meat Market Volume (Tons) Projection, By End-user 2021 to 2036
Table 261: South Africa Global Mechanically Separated Meat Market Value (USD Million) Projection, By Distribution Channel 2021 to 2036
Table 262: South Africa Global Mechanically Separated Meat Market Volume (Tons) Projection, By Distribution Channel 2021 to 2036
Table 263: Latin America Global Mechanically Separated Meat Market Value (USD Million) Projection, By Source 2021 to 2036
Table 264: Latin America Global Mechanically Separated Meat Market Volume (Tons) Projection, By Source 2021 to 2036
Table 265: Latin America Global Mechanically Separated Meat Market Value (USD Million) Projection, By Form 2021 to 2036
Table 266: Latin America Global Mechanically Separated Meat Market Volume (Tons) Projection, By Form 2021 to 2036
Table 267: Latin America Global Mechanically Separated Meat Market Value (USD Million) Projection, By Processing Technology 2021 to 2036
Table 268: Latin America Global Mechanically Separated Meat Market Volume (Tons) Projection, By Processing Technology 2021 to 2036
Table 269: Latin America Global Mechanically Separated Meat Market Value (USD Million) Projection, By Application 2021 to 2036
Table 270: Latin America Global Mechanically Separated Meat Market Volume (Tons) Projection, By Application 2021 to 2036
Table 271: Latin America Global Mechanically Separated Meat Market Value (USD Million) Projection, By End-user 2021 to 2036
Table 272: Latin America Global Mechanically Separated Meat Market Volume (Tons) Projection, By End-user 2021 to 2036
Table 273: Latin America Global Mechanically Separated Meat Market Value (USD Million) Projection, By Distribution Channel 2021 to 2036
Table 274: Latin America Global Mechanically Separated Meat Market Volume (Tons) Projection, By Distribution Channel 2021 to 2036
Table 275: Latin America Global Mechanically Separated Meat Market Value (USD Million) Projection, By Country 2021 to 2036
Table 276: Latin America Global Mechanically Separated Meat Market Volume (Tons) Projection, By Country 2021 to 2036
Table 277: Brazil Global Mechanically Separated Meat Market Value (USD Million) Projection, By Source 2021 to 2036
Table 278: Brazil Global Mechanically Separated Meat Market Volume (Tons) Projection, By Source 2021 to 2036
Table 279: Brazil Global Mechanically Separated Meat Market Value (USD Million) Projection, By Form 2021 to 2036
Table 280: Brazil Global Mechanically Separated Meat Market Volume (Tons) Projection, By Form 2021 to 2036
Table 281: Brazil Global Mechanically Separated Meat Market Value (USD Million) Projection, By Processing Technology 2021 to 2036
Table 282: Brazil Global Mechanically Separated Meat Market Volume (Tons) Projection, By Processing Technology 2021 to 2036
Table 283: Brazil Global Mechanically Separated Meat Market Value (USD Million) Projection, By Application 2021 to 2036
Table 284: Brazil Global Mechanically Separated Meat Market Volume (Tons) Projection, By Application 2021 to 2036
Table 285: Brazil Global Mechanically Separated Meat Market Value (USD Million) Projection, By End-user 2021 to 2036
Table 286: Brazil Global Mechanically Separated Meat Market Volume (Tons) Projection, By End-user 2021 to 2036
Table 287: Brazil Global Mechanically Separated Meat Market Value (USD Million) Projection, By Distribution Channel 2021 to 2036
Table 288: Brazil Global Mechanically Separated Meat Market Volume (Tons) Projection, By Distribution Channel 2021 to 2036
Table 289: Mexico Global Mechanically Separated Meat Market Value (USD Million) Projection, By Source 2021 to 2036
Table 290: Mexico Global Mechanically Separated Meat Market Volume (Tons) Projection, By Source 2021 to 2036
Table 291: Mexico Global Mechanically Separated Meat Market Value (USD Million) Projection, By Form 2021 to 2036
Table 292: Mexico Global Mechanically Separated Meat Market Volume (Tons) Projection, By Form 2021 to 2036
Table 293: Mexico Global Mechanically Separated Meat Market Value (USD Million) Projection, By Processing Technology 2021 to 2036
Table 294: Mexico Global Mechanically Separated Meat Market Volume (Tons) Projection, By Processing Technology 2021 to 2036
Table 295: Mexico Global Mechanically Separated Meat Market Value (USD Million) Projection, By Application 2021 to 2036
Table 296: Mexico Global Mechanically Separated Meat Market Volume (Tons) Projection, By Application 2021 to 2036
Table 297: Mexico Global Mechanically Separated Meat Market Value (USD Million) Projection, By End-user 2021 to 2036
Table 298: Mexico Global Mechanically Separated Meat Market Volume (Tons) Projection, By End-user 2021 to 2036
Table 299: Mexico Global Mechanically Separated Meat Market Value (USD Million) Projection, By Distribution Channel 2021 to 2036
Table 300: Mexico Global Mechanically Separated Meat Market Volume (Tons) Projection, By Distribution Channel 2021 to 2036
Table 301: Argentina Global Mechanically Separated Meat Market Value (USD Million) Projection, By Source 2021 to 2036
Table 302: Argentina Global Mechanically Separated Meat Market Volume (Tons) Projection, By Source 2021 to 2036
Table 303: Argentina Global Mechanically Separated Meat Market Value (USD Million) Projection, By Form 2021 to 2036
Table 304: Argentina Global Mechanically Separated Meat Market Volume (Tons) Projection, By Form 2021 to 2036
Table 305: Argentina Global Mechanically Separated Meat Market Value (USD Million) Projection, By Processing Technology 2021 to 2036
Table 306: Argentina Global Mechanically Separated Meat Market Volume (Tons) Projection, By Processing Technology 2021 to 2036
Table 307: Argentina Global Mechanically Separated Meat Market Value (USD Million) Projection, By Application 2021 to 2036
Table 308: Argentina Global Mechanically Separated Meat Market Volume (Tons) Projection, By Application 2021 to 2036
Table 309: Argentina Global Mechanically Separated Meat Market Value (USD Million) Projection, By End-user 2021 to 2036
Table 310: Argentina Global Mechanically Separated Meat Market Volume (Tons) Projection, By End-user 2021 to 2036
Table 311: Argentina Global Mechanically Separated Meat Market Value (USD Million) Projection, By Distribution Channel 2021 to 2036
Table 312: Argentina Global Mechanically Separated Meat Market Volume (Tons) Projection, By Distribution Channel 2021 to 2036
Figure 01: Global Mechanically Separated Meat Market Value (USD Million) Projection, By Source 2021 to 2036
Figure 02: Global Mechanically Separated Meat Market Volume (Tons) Projection, By Source 2021 to 2036
Figure 03: Global Mechanically Separated Meat Market Incremental Opportunities (USD Million) Forecast, By Source 2026 to 2036
Figure 04: Global Mechanically Separated Meat Market Value (USD Million) Projection, By Form 2021 to 2036
Figure 05: Global Mechanically Separated Meat Market Volume (Tons) Projection, By Form 2021 to 2036
Figure 06: Global Mechanically Separated Meat Market Incremental Opportunities (USD Million) Forecast, By Form 2026 to 2036
Figure 07: Global Mechanically Separated Meat Market Value (USD Million) Projection, By Processing Technology 2021 to 2036
Figure 08: Global Mechanically Separated Meat Market Volume (Tons) Projection, By Processing Technology 2021 to 2036
Figure 09: Global Mechanically Separated Meat Market Incremental Opportunities (USD Million) Forecast, By Processing Technology 2026 to 2036
Figure 10: Global Mechanically Separated Meat Market Value (USD Million) Projection, By Application 2021 to 2036
Figure 11: Global Mechanically Separated Meat Market Volume (Tons) Projection, By Application 2021 to 2036
Figure 12: Global Mechanically Separated Meat Market Incremental Opportunities (USD Million) Forecast, By Application 2026 to 2036
Figure 13: Global Mechanically Separated Meat Market Value (USD Million) Projection, By End-user 2021 to 2036
Figure 14: Global Mechanically Separated Meat Market Volume (Tons) Projection, By End-user 2021 to 2036
Figure 15: Global Mechanically Separated Meat Market Incremental Opportunities (USD Million) Forecast, By End-user 2026 to 2036
Figure 16: Global Mechanically Separated Meat Market Value (USD Million) Projection, By Distribution Channel 2021 to 2036
Figure 17: Global Mechanically Separated Meat Market Volume (Tons) Projection, By Distribution Channel 2021 to 2036
Figure 18: Global Mechanically Separated Meat Market Incremental Opportunities (USD Million) Forecast, By Distribution Channel 2026 to 2036
Figure 19: Global Mechanically Separated Meat Market Value (USD Million) Projection, By Country 2021 to 2036
Figure 20: Global Mechanically Separated Meat Market Volume (Tons) Projection, By Country 2021 to 2036
Figure 21: Global Mechanically Separated Meat Market Incremental Opportunities (USD Million) Forecast, By Country 2026 to 2036
Figure 22: North America Global Mechanically Separated Meat Market Value (USD Million) Projection, By Source 2021 to 2036
Figure 23: North America Global Mechanically Separated Meat Market Volume (Tons) Projection, By Source 2021 to 2036
Figure 24: North America Global Mechanically Separated Meat Market Incremental Opportunities (USD Million) Forecast, By Source 2026 to 2036
Figure 25: North America Global Mechanically Separated Meat Market Value (USD Million) Projection, By Form 2021 to 2036
Figure 26: North America Global Mechanically Separated Meat Market Volume (Tons) Projection, By Form 2021 to 2036
Figure 27: North America Global Mechanically Separated Meat Market Incremental Opportunities (USD Million) Forecast, By Form 2026 to 2036
Figure 28: North America Global Mechanically Separated Meat Market Value (USD Million) Projection, By Processing Technology 2021 to 2036
Figure 29: North America Global Mechanically Separated Meat Market Volume (Tons) Projection, By Processing Technology 2021 to 2036
Figure 30: North America Global Mechanically Separated Meat Market Incremental Opportunities (USD Million) Forecast, By Processing Technology 2026 to 2036
Figure 31: North America Global Mechanically Separated Meat Market Value (USD Million) Projection, By Application 2021 to 2036
Figure 32: North America Global Mechanically Separated Meat Market Volume (Tons) Projection, By Application 2021 to 2036
Figure 33: North America Global Mechanically Separated Meat Market Incremental Opportunities (USD Million) Forecast, By Application 2026 to 2036
Figure 34: North America Global Mechanically Separated Meat Market Value (USD Million) Projection, By End-user 2021 to 2036
Figure 35: North America Global Mechanically Separated Meat Market Volume (Tons) Projection, By End-user 2021 to 2036
Figure 36: North America Global Mechanically Separated Meat Market Incremental Opportunities (USD Million) Forecast, By End-user 2026 to 2036
Figure 37: North America Global Mechanically Separated Meat Market Value (USD Million) Projection, By Distribution Channel 2021 to 2036
Figure 38: North America Global Mechanically Separated Meat Market Volume (Tons) Projection, By Distribution Channel 2021 to 2036
Figure 39: North America Global Mechanically Separated Meat Market Incremental Opportunities (USD Million) Forecast, By Distribution Channel 2026 to 2036
Figure 40: North America Global Mechanically Separated Meat Market Value (USD Million) Projection, By Country 2021 to 2036
Figure 41: North America Global Mechanically Separated Meat Market Volume (Tons) Projection, By Country 2021 to 2036
Figure 42: North America Global Mechanically Separated Meat Market Incremental Opportunities (USD Million) Forecast, By Country 2026 to 2036
Figure 43: U.S. Global Mechanically Separated Meat Market Value (USD Million) Projection, By Source 2021 to 2036
Figure 44: U.S. Global Mechanically Separated Meat Market Volume (Tons) Projection, By Source 2021 to 2036
Figure 45: U.S. Global Mechanically Separated Meat Market Incremental Opportunities (USD Million) Forecast, By Source 2026 to 2036
Figure 46: U.S. Global Mechanically Separated Meat Market Value (USD Million) Projection, By Form 2021 to 2036
Figure 47: U.S. Global Mechanically Separated Meat Market Volume (Tons) Projection, By Form 2021 to 2036
Figure 48: U.S. Global Mechanically Separated Meat Market Incremental Opportunities (USD Million) Forecast, By Form 2026 to 2036
Figure 49: U.S. Global Mechanically Separated Meat Market Value (USD Million) Projection, By Processing Technology 2021 to 2036
Figure 50: U.S. Global Mechanically Separated Meat Market Volume (Tons) Projection, By Processing Technology 2021 to 2036
Figure 51: U.S. Global Mechanically Separated Meat Market Incremental Opportunities (USD Million) Forecast, By Processing Technology 2026 to 2036
Figure 52: U.S. Global Mechanically Separated Meat Market Value (USD Million) Projection, By Application 2021 to 2036
Figure 53: U.S. Global Mechanically Separated Meat Market Volume (Tons) Projection, By Application 2021 to 2036
Figure 54: U.S. Global Mechanically Separated Meat Market Incremental Opportunities (USD Million) Forecast, By Application 2026 to 2036
Figure 55: U.S. Global Mechanically Separated Meat Market Value (USD Million) Projection, By End-user 2021 to 2036
Figure 56: U.S. Global Mechanically Separated Meat Market Volume (Tons) Projection, By End-user 2021 to 2036
Figure 57: U.S. Global Mechanically Separated Meat Market Incremental Opportunities (USD Million) Forecast, By End-user 2026 to 2036
Figure 58: U.S. Global Mechanically Separated Meat Market Value (USD Million) Projection, By Distribution Channel 2021 to 2036
Figure 59: U.S. Global Mechanically Separated Meat Market Volume (Tons) Projection, By Distribution Channel 2021 to 2036
Figure 60: U.S. Global Mechanically Separated Meat Market Incremental Opportunities (USD Million) Forecast, By Distribution Channel 2026 to 2036
Figure 61: Canada Global Mechanically Separated Meat Market Value (USD Million) Projection, By Source 2021 to 2036
Figure 62: Canada Global Mechanically Separated Meat Market Volume (Tons) Projection, By Source 2021 to 2036
Figure 63: Canada Global Mechanically Separated Meat Market Incremental Opportunities (USD Million) Forecast, By Source 2026 to 2036
Figure 64: Canada Global Mechanically Separated Meat Market Value (USD Million) Projection, By Form 2021 to 2036
Figure 65: Canada Global Mechanically Separated Meat Market Volume (Tons) Projection, By Form 2021 to 2036
Figure 66: Canada Global Mechanically Separated Meat Market Incremental Opportunities (USD Million) Forecast, By Form 2026 to 2036
Figure 67: Canada Global Mechanically Separated Meat Market Value (USD Million) Projection, By Processing Technology 2021 to 2036
Figure 68: Canada Global Mechanically Separated Meat Market Volume (Tons) Projection, By Processing Technology 2021 to 2036
Figure 69: Canada Global Mechanically Separated Meat Market Incremental Opportunities (USD Million) Forecast, By Processing Technology 2026 to 2036
Figure 70: Canada Global Mechanically Separated Meat Market Value (USD Million) Projection, By Application 2021 to 2036
Figure 71: Canada Global Mechanically Separated Meat Market Volume (Tons) Projection, By Application 2021 to 2036
Figure 72: Canada Global Mechanically Separated Meat Market Incremental Opportunities (USD Million) Forecast, By Application 2026 to 2036
Figure 73: Canada Global Mechanically Separated Meat Market Value (USD Million) Projection, By End-user 2021 to 2036
Figure 74: Canada Global Mechanically Separated Meat Market Volume (Tons) Projection, By End-user 2021 to 2036
Figure 75: Canada Global Mechanically Separated Meat Market Incremental Opportunities (USD Million) Forecast, By End-user 2026 to 2036
Figure 76: Canada Global Mechanically Separated Meat Market Value (USD Million) Projection, By Distribution Channel 2021 to 2036
Figure 77: Canada Global Mechanically Separated Meat Market Volume (Tons) Projection, By Distribution Channel 2021 to 2036
Figure 78: Canada Global Mechanically Separated Meat Market Incremental Opportunities (USD Million) Forecast, By Distribution Channel 2026 to 2036
Figure 79: Europe Global Mechanically Separated Meat Market Value (USD Million) Projection, By Source 2021 to 2036
Figure 80: Europe Global Mechanically Separated Meat Market Volume (Tons) Projection, By Source 2021 to 2036
Figure 81: Europe Global Mechanically Separated Meat Market Incremental Opportunities (USD Million) Forecast, By Source 2026 to 2036
Figure 82: Europe Global Mechanically Separated Meat Market Value (USD Million) Projection, By Form 2021 to 2036
Figure 83: Europe Global Mechanically Separated Meat Market Volume (Tons) Projection, By Form 2021 to 2036
Figure 84: Europe Global Mechanically Separated Meat Market Incremental Opportunities (USD Million) Forecast, By Form 2026 to 2036
Figure 85: Europe Global Mechanically Separated Meat Market Value (USD Million) Projection, By Processing Technology 2021 to 2036
Figure 86: Europe Global Mechanically Separated Meat Market Volume (Tons) Projection, By Processing Technology 2021 to 2036
Figure 87: Europe Global Mechanically Separated Meat Market Incremental Opportunities (USD Million) Forecast, By Processing Technology 2026 to 2036
Figure 88: Europe Global Mechanically Separated Meat Market Value (USD Million) Projection, By Application 2021 to 2036
Figure 89: Europe Global Mechanically Separated Meat Market Volume (Tons) Projection, By Application 2021 to 2036
Figure 90: Europe Global Mechanically Separated Meat Market Incremental Opportunities (USD Million) Forecast, By Application 2026 to 2036
Figure 91: Europe Global Mechanically Separated Meat Market Value (USD Million) Projection, By End-user 2021 to 2036
Figure 92: Europe Global Mechanically Separated Meat Market Volume (Tons) Projection, By End-user 2021 to 2036
Figure 93: Europe Global Mechanically Separated Meat Market Incremental Opportunities (USD Million) Forecast, By End-user 2026 to 2036
Figure 94: Europe Global Mechanically Separated Meat Market Value (USD Million) Projection, By Distribution Channel 2021 to 2036
Figure 95: Europe Global Mechanically Separated Meat Market Volume (Tons) Projection, By Distribution Channel 2021 to 2036
Figure 96: Europe Global Mechanically Separated Meat Market Incremental Opportunities (USD Million) Forecast, By Distribution Channel 2026 to 2036
Figure 97: Europe Global Mechanically Separated Meat Market Value (USD Million) Projection, By Country 2021 to 2036
Figure 98: Europe Global Mechanically Separated Meat Market Volume (Tons) Projection, By Country 2021 to 2036
Figure 99: Europe Global Mechanically Separated Meat Market Incremental Opportunities (USD Million) Forecast, By Country 2026 to 2036
Figure 100: U.K. Global Mechanically Separated Meat Market Value (USD Million) Projection, By Source 2021 to 2036
Figure 101: U.K. Global Mechanically Separated Meat Market Volume (Tons) Projection, By Source 2021 to 2036
Figure 102: U.K. Global Mechanically Separated Meat Market Incremental Opportunities (USD Million) Forecast, By Source 2026 to 2036
Figure 103: U.K. Global Mechanically Separated Meat Market Value (USD Million) Projection, By Form 2021 to 2036
Figure 104: U.K. Global Mechanically Separated Meat Market Volume (Tons) Projection, By Form 2021 to 2036
Figure 105: U.K. Global Mechanically Separated Meat Market Incremental Opportunities (USD Million) Forecast, By Form 2026 to 2036
Figure 106: U.K. Global Mechanically Separated Meat Market Value (USD Million) Projection, By Processing Technology 2021 to 2036
Figure 107: U.K. Global Mechanically Separated Meat Market Volume (Tons) Projection, By Processing Technology 2021 to 2036
Figure 108: U.K. Global Mechanically Separated Meat Market Incremental Opportunities (USD Million) Forecast, By Processing Technology 2026 to 2036
Figure 109: U.K. Global Mechanically Separated Meat Market Value (USD Million) Projection, By Application 2021 to 2036
Figure 110: U.K. Global Mechanically Separated Meat Market Volume (Tons) Projection, By Application 2021 to 2036
Figure 111: U.K. Global Mechanically Separated Meat Market Incremental Opportunities (USD Million) Forecast, By Application 2026 to 2036
Figure 112: U.K. Global Mechanically Separated Meat Market Value (USD Million) Projection, By End-user 2021 to 2036
Figure 113: U.K. Global Mechanically Separated Meat Market Volume (Tons) Projection, By End-user 2021 to 2036
Figure 114: U.K. Global Mechanically Separated Meat Market Incremental Opportunities (USD Million) Forecast, By End-user 2026 to 2036
Figure 115: U.K. Global Mechanically Separated Meat Market Value (USD Million) Projection, By Distribution Channel 2021 to 2036
Figure 116: U.K. Global Mechanically Separated Meat Market Volume (Tons) Projection, By Distribution Channel 2021 to 2036
Figure 117: U.K. Global Mechanically Separated Meat Market Incremental Opportunities (USD Million) Forecast, By Distribution Channel 2026 to 2036
Figure 118: Germany Global Mechanically Separated Meat Market Value (USD Million) Projection, By Source 2021 to 2036
Figure 119: Germany Global Mechanically Separated Meat Market Volume (Tons) Projection, By Source 2021 to 2036
Figure 120: Germany Global Mechanically Separated Meat Market Incremental Opportunities (USD Million) Forecast, By Source 2026 to 2036
Figure 121: Germany Global Mechanically Separated Meat Market Value (USD Million) Projection, By Form 2021 to 2036
Figure 122: Germany Global Mechanically Separated Meat Market Volume (Tons) Projection, By Form 2021 to 2036
Figure 123: Germany Global Mechanically Separated Meat Market Incremental Opportunities (USD Million) Forecast, By Form 2026 to 2036
Figure 124: Germany Global Mechanically Separated Meat Market Value (USD Million) Projection, By Processing Technology 2021 to 2036
Figure 125: Germany Global Mechanically Separated Meat Market Volume (Tons) Projection, By Processing Technology 2021 to 2036
Figure 126: Germany Global Mechanically Separated Meat Market Incremental Opportunities (USD Million) Forecast, By Processing Technology 2026 to 2036
Figure 127: Germany Global Mechanically Separated Meat Market Value (USD Million) Projection, By Application 2021 to 2036
Figure 128: Germany Global Mechanically Separated Meat Market Volume (Tons) Projection, By Application 2021 to 2036
Figure 129: Germany Global Mechanically Separated Meat Market Incremental Opportunities (USD Million) Forecast, By Application 2026 to 2036
Figure 130: Germany Global Mechanically Separated Meat Market Value (USD Million) Projection, By End-user 2021 to 2036
Figure 131: Germany Global Mechanically Separated Meat Market Volume (Tons) Projection, By End-user 2021 to 2036
Figure 132: Germany Global Mechanically Separated Meat Market Incremental Opportunities (USD Million) Forecast, By End-user 2026 to 2036
Figure 133: Germany Global Mechanically Separated Meat Market Value (USD Million) Projection, By Distribution Channel 2021 to 2036
Figure 134: Germany Global Mechanically Separated Meat Market Volume (Tons) Projection, By Distribution Channel 2021 to 2036
Figure 135: Germany Global Mechanically Separated Meat Market Incremental Opportunities (USD Million) Forecast, By Distribution Channel 2026 to 2036
Figure 136: France Global Mechanically Separated Meat Market Value (USD Million) Projection, By Source 2021 to 2036
Figure 137: France Global Mechanically Separated Meat Market Volume (Tons) Projection, By Source 2021 to 2036
Figure 138: France Global Mechanically Separated Meat Market Incremental Opportunities (USD Million) Forecast, By Source 2026 to 2036
Figure 139: France Global Mechanically Separated Meat Market Value (USD Million) Projection, By Form 2021 to 2036
Figure 140: France Global Mechanically Separated Meat Market Volume (Tons) Projection, By Form 2021 to 2036
Figure 141: France Global Mechanically Separated Meat Market Incremental Opportunities (USD Million) Forecast, By Form 2026 to 2036
Figure 142: France Global Mechanically Separated Meat Market Value (USD Million) Projection, By Processing Technology 2021 to 2036
Figure 143: France Global Mechanically Separated Meat Market Volume (Tons) Projection, By Processing Technology 2021 to 2036
Figure 144: France Global Mechanically Separated Meat Market Incremental Opportunities (USD Million) Forecast, By Processing Technology 2026 to 2036
Figure 145: France Global Mechanically Separated Meat Market Value (USD Million) Projection, By Application 2021 to 2036
Figure 146: France Global Mechanically Separated Meat Market Volume (Tons) Projection, By Application 2021 to 2036
Figure 147: France Global Mechanically Separated Meat Market Incremental Opportunities (USD Million) Forecast, By Application 2026 to 2036
Figure 148: France Global Mechanically Separated Meat Market Value (USD Million) Projection, By End-user 2021 to 2036
Figure 149: France Global Mechanically Separated Meat Market Volume (Tons) Projection, By End-user 2021 to 2036
Figure 150: France Global Mechanically Separated Meat Market Incremental Opportunities (USD Million) Forecast, By End-user 2026 to 2036
Figure 151: France Global Mechanically Separated Meat Market Value (USD Million) Projection, By Distribution Channel 2021 to 2036
Figure 152: France Global Mechanically Separated Meat Market Volume (Tons) Projection, By Distribution Channel 2021 to 2036
Figure 153: France Global Mechanically Separated Meat Market Incremental Opportunities (USD Million) Forecast, By Distribution Channel 2026 to 2036
Figure 154: Italy Global Mechanically Separated Meat Market Value (USD Million) Projection, By Source 2021 to 2036
Figure 155: Italy Global Mechanically Separated Meat Market Volume (Tons) Projection, By Source 2021 to 2036
Figure 156: Italy Global Mechanically Separated Meat Market Incremental Opportunities (USD Million) Forecast, By Source 2026 to 2036
Figure 157: Italy Global Mechanically Separated Meat Market Value (USD Million) Projection, By Form 2021 to 2036
Figure 158: Italy Global Mechanically Separated Meat Market Volume (Tons) Projection, By Form 2021 to 2036
Figure 159: Italy Global Mechanically Separated Meat Market Incremental Opportunities (USD Million) Forecast, By Form 2026 to 2036
Figure 160: Italy Global Mechanically Separated Meat Market Value (USD Million) Projection, By Processing Technology 2021 to 2036
Figure 161: Italy Global Mechanically Separated Meat Market Volume (Tons) Projection, By Processing Technology 2021 to 2036
Figure 162: Italy Global Mechanically Separated Meat Market Incremental Opportunities (USD Million) Forecast, By Processing Technology 2026 to 2036
Figure 163: Italy Global Mechanically Separated Meat Market Value (USD Million) Projection, By Application 2021 to 2036
Figure 164: Italy Global Mechanically Separated Meat Market Volume (Tons) Projection, By Application 2021 to 2036
Figure 165: Italy Global Mechanically Separated Meat Market Incremental Opportunities (USD Million) Forecast, By Application 2026 to 2036
Figure 166: Italy Global Mechanically Separated Meat Market Value (USD Million) Projection, By End-user 2021 to 2036
Figure 167: Italy Global Mechanically Separated Meat Market Volume (Tons) Projection, By End-user 2021 to 2036
Figure 168: Italy Global Mechanically Separated Meat Market Incremental Opportunities (USD Million) Forecast, By End-user 2026 to 2036
Figure 169: Italy Global Mechanically Separated Meat Market Value (USD Million) Projection, By Distribution Channel 2021 to 2036
Figure 170: Italy Global Mechanically Separated Meat Market Volume (Tons) Projection, By Distribution Channel 2021 to 2036
Figure 171: Italy Global Mechanically Separated Meat Market Incremental Opportunities (USD Million) Forecast, By Distribution Channel 2026 to 2036
Figure 172: Spain Global Mechanically Separated Meat Market Value (USD Million) Projection, By Source 2021 to 2036
Figure 173: Spain Global Mechanically Separated Meat Market Volume (Tons) Projection, By Source 2021 to 2036
Figure 174: Spain Global Mechanically Separated Meat Market Incremental Opportunities (USD Million) Forecast, By Source 2026 to 2036
Figure 175: Spain Global Mechanically Separated Meat Market Value (USD Million) Projection, By Form 2021 to 2036
Figure 176: Spain Global Mechanically Separated Meat Market Volume (Tons) Projection, By Form 2021 to 2036
Figure 177: Spain Global Mechanically Separated Meat Market Incremental Opportunities (USD Million) Forecast, By Form 2026 to 2036
Figure 178: Spain Global Mechanically Separated Meat Market Value (USD Million) Projection, By Processing Technology 2021 to 2036
Figure 179: Spain Global Mechanically Separated Meat Market Volume (Tons) Projection, By Processing Technology 2021 to 2036
Figure 180: Spain Global Mechanically Separated Meat Market Incremental Opportunities (USD Million) Forecast, By Processing Technology 2026 to 2036
Figure 181: Spain Global Mechanically Separated Meat Market Value (USD Million) Projection, By Application 2021 to 2036
Figure 182: Spain Global Mechanically Separated Meat Market Volume (Tons) Projection, By Application 2021 to 2036
Figure 183: Spain Global Mechanically Separated Meat Market Incremental Opportunities (USD Million) Forecast, By Application 2026 to 2036
Figure 184: Spain Global Mechanically Separated Meat Market Value (USD Million) Projection, By End-user 2021 to 2036
Figure 185: Spain Global Mechanically Separated Meat Market Volume (Tons) Projection, By End-user 2021 to 2036
Figure 186: Spain Global Mechanically Separated Meat Market Incremental Opportunities (USD Million) Forecast, By End-user 2026 to 2036
Figure 187: Spain Global Mechanically Separated Meat Market Value (USD Million) Projection, By Distribution Channel 2021 to 2036
Figure 188: Spain Global Mechanically Separated Meat Market Volume (Tons) Projection, By Distribution Channel 2021 to 2036
Figure 189: Spain Global Mechanically Separated Meat Market Incremental Opportunities (USD Million) Forecast, By Distribution Channel 2026 to 2036
Figure 190: The Netherlands Global Mechanically Separated Meat Market Value (USD Million) Projection, By Source 2021 to 2036
Figure 191: The Netherlands Global Mechanically Separated Meat Market Volume (Tons) Projection, By Source 2021 to 2036
Figure 192: The Netherlands Global Mechanically Separated Meat Market Incremental Opportunities (USD Million) Forecast, By Source 2026 to 2036
Figure 193: The Netherlands Global Mechanically Separated Meat Market Value (USD Million) Projection, By Form 2021 to 2036
Figure 194: The Netherlands Global Mechanically Separated Meat Market Volume (Tons) Projection, By Form 2021 to 2036
Figure 195: The Netherlands Global Mechanically Separated Meat Market Incremental Opportunities (USD Million) Forecast, By Form 2026 to 2036
Figure 196: The Netherlands Global Mechanically Separated Meat Market Value (USD Million) Projection, By Processing Technology 2021 to 2036
Figure 197: The Netherlands Global Mechanically Separated Meat Market Volume (Tons) Projection, By Processing Technology 2021 to 2036
Figure 198: The Netherlands Global Mechanically Separated Meat Market Incremental Opportunities (USD Million) Forecast, By Processing Technology 2026 to 2036
Figure 199: The Netherlands Global Mechanically Separated Meat Market Value (USD Million) Projection, By Application 2021 to 2036
Figure 200: The Netherlands Global Mechanically Separated Meat Market Volume (Tons) Projection, By Application 2021 to 2036
Figure 201: The Netherlands Global Mechanically Separated Meat Market Incremental Opportunities (USD Million) Forecast, By Application 2026 to 2036
Figure 202: The Netherlands Global Mechanically Separated Meat Market Value (USD Million) Projection, By End-user 2021 to 2036
Figure 203: The Netherlands Global Mechanically Separated Meat Market Volume (Tons) Projection, By End-user 2021 to 2036
Figure 204: The Netherlands Global Mechanically Separated Meat Market Incremental Opportunities (USD Million) Forecast, By End-user 2026 to 2036
Figure 205: The Netherlands Global Mechanically Separated Meat Market Value (USD Million) Projection, By Distribution Channel 2021 to 2036
Figure 206: The Netherlands Global Mechanically Separated Meat Market Volume (Tons) Projection, By Distribution Channel 2021 to 2036
Figure 207: The Netherlands Global Mechanically Separated Meat Market Incremental Opportunities (USD Million) Forecast, By Distribution Channel 2026 to 2036
Figure 208: Asia Pacific Global Mechanically Separated Meat Market Value (USD Million) Projection, By Source 2021 to 2036
Figure 209: Asia Pacific Global Mechanically Separated Meat Market Volume (Tons) Projection, By Source 2021 to 2036
Figure 210: Asia Pacific Global Mechanically Separated Meat Market Incremental Opportunities (USD Million) Forecast, By Source 2026 to 2036
Figure 211: Asia Pacific Global Mechanically Separated Meat Market Value (USD Million) Projection, By Form 2021 to 2036
Figure 212: Asia Pacific Global Mechanically Separated Meat Market Volume (Tons) Projection, By Form 2021 to 2036
Figure 213: Asia Pacific Global Mechanically Separated Meat Market Incremental Opportunities (USD Million) Forecast, By Form 2026 to 2036
Figure 214: Asia Pacific Global Mechanically Separated Meat Market Value (USD Million) Projection, By Processing Technology 2021 to 2036
Figure 215: Asia Pacific Global Mechanically Separated Meat Market Volume (Tons) Projection, By Processing Technology 2021 to 2036
Figure 216: Asia Pacific Global Mechanically Separated Meat Market Incremental Opportunities (USD Million) Forecast, By Processing Technology 2026 to 2036
Figure 217: Asia Pacific Global Mechanically Separated Meat Market Value (USD Million) Projection, By Application 2021 to 2036
Figure 218: Asia Pacific Global Mechanically Separated Meat Market Volume (Tons) Projection, By Application 2021 to 2036
Figure 219: Asia Pacific Global Mechanically Separated Meat Market Incremental Opportunities (USD Million) Forecast, By Application 2026 to 2036
Figure 220: Asia Pacific Global Mechanically Separated Meat Market Value (USD Million) Projection, By End-user 2021 to 2036
Figure 221: Asia Pacific Global Mechanically Separated Meat Market Volume (Tons) Projection, By End-user 2021 to 2036
Figure 222: Asia Pacific Global Mechanically Separated Meat Market Incremental Opportunities (USD Million) Forecast, By End-user 2026 to 2036
Figure 223: Asia Pacific Global Mechanically Separated Meat Market Value (USD Million) Projection, By Distribution Channel 2021 to 2036
Figure 224: Asia Pacific Global Mechanically Separated Meat Market Volume (Tons) Projection, By Distribution Channel 2021 to 2036
Figure 225: Asia Pacific Global Mechanically Separated Meat Market Incremental Opportunities (USD Million) Forecast, By Distribution Channel 2026 to 2036
Figure 226: Asia Pacific Global Mechanically Separated Meat Market Value (USD Million) Projection, By Country 2021 to 2036
Figure 227: Asia Pacific Global Mechanically Separated Meat Market Volume (Tons) Projection, By Country 2021 to 2036
Figure 228: Asia Pacific Global Mechanically Separated Meat Market Incremental Opportunities (USD Million) Forecast, By Country 2026 to 2036
Figure 229: China Global Mechanically Separated Meat Market Value (USD Million) Projection, By Source 2021 to 2036
Figure 230: China Global Mechanically Separated Meat Market Volume (Tons) Projection, By Source 2021 to 2036
Figure 231: China Global Mechanically Separated Meat Market Incremental Opportunities (USD Million) Forecast, By Source 2026 to 2036
Figure 232: China Global Mechanically Separated Meat Market Value (USD Million) Projection, By Form 2021 to 2036
Figure 233: China Global Mechanically Separated Meat Market Volume (Tons) Projection, By Form 2021 to 2036
Figure 234: China Global Mechanically Separated Meat Market Incremental Opportunities (USD Million) Forecast, By Form 2026 to 2036
Figure 235: China Global Mechanically Separated Meat Market Value (USD Million) Projection, By Processing Technology 2021 to 2036
Figure 236: China Global Mechanically Separated Meat Market Volume (Tons) Projection, By Processing Technology 2021 to 2036
Figure 237: China Global Mechanically Separated Meat Market Incremental Opportunities (USD Million) Forecast, By Processing Technology 2026 to 2036
Figure 238: China Global Mechanically Separated Meat Market Value (USD Million) Projection, By Application 2021 to 2036
Figure 239: China Global Mechanically Separated Meat Market Volume (Tons) Projection, By Application 2021 to 2036
Figure 240: China Global Mechanically Separated Meat Market Incremental Opportunities (USD Million) Forecast, By Application 2026 to 2036
Figure 241: China Global Mechanically Separated Meat Market Value (USD Million) Projection, By End-user 2021 to 2036
Figure 242: China Global Mechanically Separated Meat Market Volume (Tons) Projection, By End-user 2021 to 2036
Figure 243: China Global Mechanically Separated Meat Market Incremental Opportunities (USD Million) Forecast, By End-user 2026 to 2036
Figure 244: China Global Mechanically Separated Meat Market Value (USD Million) Projection, By Distribution Channel 2021 to 2036
Figure 245: China Global Mechanically Separated Meat Market Volume (Tons) Projection, By Distribution Channel 2021 to 2036
Figure 246: China Global Mechanically Separated Meat Market Incremental Opportunities (USD Million) Forecast, By Distribution Channel 2026 to 2036
Figure 247: India Global Mechanically Separated Meat Market Value (USD Million) Projection, By Source 2021 to 2036
Figure 248: India Global Mechanically Separated Meat Market Volume (Tons) Projection, By Source 2021 to 2036
Figure 249: India Global Mechanically Separated Meat Market Incremental Opportunities (USD Million) Forecast, By Source 2026 to 2036
Figure 250: India Global Mechanically Separated Meat Market Value (USD Million) Projection, By Form 2021 to 2036
Figure 251: India Global Mechanically Separated Meat Market Volume (Tons) Projection, By Form 2021 to 2036
Figure 252: India Global Mechanically Separated Meat Market Incremental Opportunities (USD Million) Forecast, By Form 2026 to 2036
Figure 253: India Global Mechanically Separated Meat Market Value (USD Million) Projection, By Processing Technology 2021 to 2036
Figure 254: India Global Mechanically Separated Meat Market Volume (Tons) Projection, By Processing Technology 2021 to 2036
Figure 255: India Global Mechanically Separated Meat Market Incremental Opportunities (USD Million) Forecast, By Processing Technology 2026 to 2036
Figure 256: India Global Mechanically Separated Meat Market Value (USD Million) Projection, By Application 2021 to 2036
Figure 257: India Global Mechanically Separated Meat Market Volume (Tons) Projection, By Application 2021 to 2036
Figure 258: India Global Mechanically Separated Meat Market Incremental Opportunities (USD Million) Forecast, By Application 2026 to 2036
Figure 259: India Global Mechanically Separated Meat Market Value (USD Million) Projection, By End-user 2021 to 2036
Figure 260: India Global Mechanically Separated Meat Market Volume (Tons) Projection, By End-user 2021 to 2036
Figure 261: India Global Mechanically Separated Meat Market Incremental Opportunities (USD Million) Forecast, By End-user 2026 to 2036
Figure 262: India Global Mechanically Separated Meat Market Value (USD Million) Projection, By Distribution Channel 2021 to 2036
Figure 263: India Global Mechanically Separated Meat Market Volume (Tons) Projection, By Distribution Channel 2021 to 2036
Figure 264: India Global Mechanically Separated Meat Market Incremental Opportunities (USD Million) Forecast, By Distribution Channel 2026 to 2036
Figure 265: Japan Global Mechanically Separated Meat Market Value (USD Million) Projection, By Source 2021 to 2036
Figure 266: Japan Global Mechanically Separated Meat Market Volume (Tons) Projection, By Source 2021 to 2036
Figure 267: Japan Global Mechanically Separated Meat Market Incremental Opportunities (USD Million) Forecast, By Source 2026 to 2036
Figure 268: Japan Global Mechanically Separated Meat Market Value (USD Million) Projection, By Form 2021 to 2036
Figure 269: Japan Global Mechanically Separated Meat Market Volume (Tons) Projection, By Form 2021 to 2036
Figure 270: Japan Global Mechanically Separated Meat Market Incremental Opportunities (USD Million) Forecast, By Form 2026 to 2036
Figure 271: Japan Global Mechanically Separated Meat Market Value (USD Million) Projection, By Processing Technology 2021 to 2036
Figure 272: Japan Global Mechanically Separated Meat Market Volume (Tons) Projection, By Processing Technology 2021 to 2036
Figure 273: Japan Global Mechanically Separated Meat Market Incremental Opportunities (USD Million) Forecast, By Processing Technology 2026 to 2036
Figure 274: Japan Global Mechanically Separated Meat Market Value (USD Million) Projection, By Application 2021 to 2036
Figure 275: Japan Global Mechanically Separated Meat Market Volume (Tons) Projection, By Application 2021 to 2036
Figure 276: Japan Global Mechanically Separated Meat Market Incremental Opportunities (USD Million) Forecast, By Application 2026 to 2036
Figure 277: Japan Global Mechanically Separated Meat Market Value (USD Million) Projection, By End-user 2021 to 2036
Figure 278: Japan Global Mechanically Separated Meat Market Volume (Tons) Projection, By End-user 2021 to 2036
Figure 279: Japan Global Mechanically Separated Meat Market Incremental Opportunities (USD Million) Forecast, By End-user 2026 to 2036
Figure 280: Japan Global Mechanically Separated Meat Market Value (USD Million) Projection, By Distribution Channel 2021 to 2036
Figure 281: Japan Global Mechanically Separated Meat Market Volume (Tons) Projection, By Distribution Channel 2021 to 2036
Figure 282: Japan Global Mechanically Separated Meat Market Incremental Opportunities (USD Million) Forecast, By Distribution Channel 2026 to 2036
Figure 283: Australia Global Mechanically Separated Meat Market Value (USD Million) Projection, By Source 2021 to 2036
Figure 284: Australia Global Mechanically Separated Meat Market Volume (Tons) Projection, By Source 2021 to 2036
Figure 285: Australia Global Mechanically Separated Meat Market Incremental Opportunities (USD Million) Forecast, By Source 2026 to 2036
Figure 286: Australia Global Mechanically Separated Meat Market Value (USD Million) Projection, By Form 2021 to 2036
Figure 287: Australia Global Mechanically Separated Meat Market Volume (Tons) Projection, By Form 2021 to 2036
Figure 288: Australia Global Mechanically Separated Meat Market Incremental Opportunities (USD Million) Forecast, By Form 2026 to 2036
Figure 289: Australia Global Mechanically Separated Meat Market Value (USD Million) Projection, By Processing Technology 2021 to 2036
Figure 290: Australia Global Mechanically Separated Meat Market Volume (Tons) Projection, By Processing Technology 2021 to 2036
Figure 291: Australia Global Mechanically Separated Meat Market Incremental Opportunities (USD Million) Forecast, By Processing Technology 2026 to 2036
Figure 292: Australia Global Mechanically Separated Meat Market Value (USD Million) Projection, By Application 2021 to 2036
Figure 293: Australia Global Mechanically Separated Meat Market Volume (Tons) Projection, By Application 2021 to 2036
Figure 294: Australia Global Mechanically Separated Meat Market Incremental Opportunities (USD Million) Forecast, By Application 2026 to 2036
Figure 295: Australia Global Mechanically Separated Meat Market Value (USD Million) Projection, By End-user 2021 to 2036
Figure 296: Australia Global Mechanically Separated Meat Market Volume (Tons) Projection, By End-user 2021 to 2036
Figure 297: Australia Global Mechanically Separated Meat Market Incremental Opportunities (USD Million) Forecast, By End-user 2026 to 2036
Figure 298: Australia Global Mechanically Separated Meat Market Value (USD Million) Projection, By Distribution Channel 2021 to 2036
Figure 299: Australia Global Mechanically Separated Meat Market Volume (Tons) Projection, By Distribution Channel 2021 to 2036
Figure 300: Australia Global Mechanically Separated Meat Market Incremental Opportunities (USD Million) Forecast, By Distribution Channel 2026 to 2036
Figure 301: South Korea Global Mechanically Separated Meat Market Value (USD Million) Projection, By Source 2021 to 2036
Figure 302: South Korea Global Mechanically Separated Meat Market Volume (Tons) Projection, By Source 2021 to 2036
Figure 303: South Korea Global Mechanically Separated Meat Market Incremental Opportunities (USD Million) Forecast, By Source 2026 to 2036
Figure 304: South Korea Global Mechanically Separated Meat Market Value (USD Million) Projection, By Form 2021 to 2036
Figure 305: South Korea Global Mechanically Separated Meat Market Volume (Tons) Projection, By Form 2021 to 2036
Figure 306: South Korea Global Mechanically Separated Meat Market Incremental Opportunities (USD Million) Forecast, By Form 2026 to 2036
Figure 307: South Korea Global Mechanically Separated Meat Market Value (USD Million) Projection, By Processing Technology 2021 to 2036
Figure 308: South Korea Global Mechanically Separated Meat Market Volume (Tons) Projection, By Processing Technology 2021 to 2036
Figure 309: South Korea Global Mechanically Separated Meat Market Incremental Opportunities (USD Million) Forecast, By Processing Technology 2026 to 2036
Figure 310: South Korea Global Mechanically Separated Meat Market Value (USD Million) Projection, By Application 2021 to 2036
Figure 311: South Korea Global Mechanically Separated Meat Market Volume (Tons) Projection, By Application 2021 to 2036
Figure 312: South Korea Global Mechanically Separated Meat Market Incremental Opportunities (USD Million) Forecast, By Application 2026 to 2036
Figure 313: South Korea Global Mechanically Separated Meat Market Value (USD Million) Projection, By End-user 2021 to 2036
Figure 314: South Korea Global Mechanically Separated Meat Market Volume (Tons) Projection, By End-user 2021 to 2036
Figure 315: South Korea Global Mechanically Separated Meat Market Incremental Opportunities (USD Million) Forecast, By End-user 2026 to 2036
Figure 316: South Korea Global Mechanically Separated Meat Market Value (USD Million) Projection, By Distribution Channel 2021 to 2036
Figure 317: South Korea Global Mechanically Separated Meat Market Volume (Tons) Projection, By Distribution Channel 2021 to 2036
Figure 318: South Korea Global Mechanically Separated Meat Market Incremental Opportunities (USD Million) Forecast, By Distribution Channel 2026 to 2036
Figure 319: ASEAN Global Mechanically Separated Meat Market Value (USD Million) Projection, By Source 2021 to 2036
Figure 320: ASEAN Global Mechanically Separated Meat Market Volume (Tons) Projection, By Source 2021 to 2036
Figure 321: ASEAN Global Mechanically Separated Meat Market Incremental Opportunities (USD Million) Forecast, By Source 2026 to 2036
Figure 322: ASEAN Global Mechanically Separated Meat Market Value (USD Million) Projection, By Form 2021 to 2036
Figure 323: ASEAN Global Mechanically Separated Meat Market Volume (Tons) Projection, By Form 2021 to 2036
Figure 324: ASEAN Global Mechanically Separated Meat Market Incremental Opportunities (USD Million) Forecast, By Form 2026 to 2036
Figure 325: ASEAN Global Mechanically Separated Meat Market Value (USD Million) Projection, By Processing Technology 2021 to 2036
Figure 326: ASEAN Global Mechanically Separated Meat Market Volume (Tons) Projection, By Processing Technology 2021 to 2036
Figure 327: ASEAN Global Mechanically Separated Meat Market Incremental Opportunities (USD Million) Forecast, By Processing Technology 2026 to 2036
Figure 328: ASEAN Global Mechanically Separated Meat Market Value (USD Million) Projection, By Application 2021 to 2036
Figure 329: ASEAN Global Mechanically Separated Meat Market Volume (Tons) Projection, By Application 2021 to 2036
Figure 330: ASEAN Global Mechanically Separated Meat Market Incremental Opportunities (USD Million) Forecast, By Application 2026 to 2036
Figure 331: ASEAN Global Mechanically Separated Meat Market Value (USD Million) Projection, By End-user 2021 to 2036
Figure 332: ASEAN Global Mechanically Separated Meat Market Volume (Tons) Projection, By End-user 2021 to 2036
Figure 333: ASEAN Global Mechanically Separated Meat Market Incremental Opportunities (USD Million) Forecast, By End-user 2026 to 2036
Figure 334: ASEAN Global Mechanically Separated Meat Market Value (USD Million) Projection, By Distribution Channel 2021 to 2036
Figure 335: ASEAN Global Mechanically Separated Meat Market Volume (Tons) Projection, By Distribution Channel 2021 to 2036
Figure 336: ASEAN Global Mechanically Separated Meat Market Incremental Opportunities (USD Million) Forecast, By Distribution Channel 2026 to 2036
Figure 337: Middle East & Africa Global Mechanically Separated Meat Market Value (USD Million) Projection, By Source 2021 to 2036
Figure 338: Middle East & Africa Global Mechanically Separated Meat Market Volume (Tons) Projection, By Source 2021 to 2036
Figure 339: Middle East & Africa Global Mechanically Separated Meat Market Incremental Opportunities (USD Million) Forecast, By Source 2026 to 2036
Figure 340: Middle East & Africa Global Mechanically Separated Meat Market Value (USD Million) Projection, By Form 2021 to 2036
Figure 341: Middle East & Africa Global Mechanically Separated Meat Market Volume (Tons) Projection, By Form 2021 to 2036
Figure 342: Middle East & Africa Global Mechanically Separated Meat Market Incremental Opportunities (USD Million) Forecast, By Form 2026 to 2036
Figure 343: Middle East & Africa Global Mechanically Separated Meat Market Value (USD Million) Projection, By Processing Technology 2021 to 2036
Figure 344: Middle East & Africa Global Mechanically Separated Meat Market Volume (Tons) Projection, By Processing Technology 2021 to 2036
Figure 345: Middle East & Africa Global Mechanically Separated Meat Market Incremental Opportunities (USD Million) Forecast, By Processing Technology 2026 to 2036
Figure 346: Middle East & Africa Global Mechanically Separated Meat Market Value (USD Million) Projection, By Application 2021 to 2036
Figure 347: Middle East & Africa Global Mechanically Separated Meat Market Volume (Tons) Projection, By Application 2021 to 2036
Figure 348: Middle East & Africa Global Mechanically Separated Meat Market Incremental Opportunities (USD Million) Forecast, By Application 2026 to 2036
Figure 349: Middle East & Africa Global Mechanically Separated Meat Market Value (USD Million) Projection, By End-user 2021 to 2036
Figure 350: Middle East & Africa Global Mechanically Separated Meat Market Volume (Tons) Projection, By End-user 2021 to 2036
Figure 351: Middle East & Africa Global Mechanically Separated Meat Market Incremental Opportunities (USD Million) Forecast, By End-user 2026 to 2036
Figure 352: Middle East & Africa Global Mechanically Separated Meat Market Value (USD Million) Projection, By Distribution Channel 2021 to 2036
Figure 353: Middle East & Africa Global Mechanically Separated Meat Market Volume (Tons) Projection, By Distribution Channel 2021 to 2036
Figure 354: Middle East & Africa Global Mechanically Separated Meat Market Incremental Opportunities (USD Million) Forecast, By Distribution Channel 2026 to 2036
Figure 355: Middle East & Africa Global Mechanically Separated Meat Market Value (USD Million) Projection, By Country 2021 to 2036
Figure 356: Middle East & Africa Global Mechanically Separated Meat Market Volume (Tons) Projection, By Country 2021 to 2036
Figure 357: Middle East & Africa Global Mechanically Separated Meat Market Incremental Opportunities (USD Million) Forecast, By Country 2026 to 2036
Figure 358: GCC Countries Global Mechanically Separated Meat Market Value (USD Million) Projection, By Source 2021 to 2036
Figure 359: GCC Countries Global Mechanically Separated Meat Market Volume (Tons) Projection, By Source 2021 to 2036
Figure 360: GCC Countries Global Mechanically Separated Meat Market Incremental Opportunities (USD Million) Forecast, By Source 2026 to 2036
Figure 361: GCC Countries Global Mechanically Separated Meat Market Value (USD Million) Projection, By Form 2021 to 2036
Figure 362: GCC Countries Global Mechanically Separated Meat Market Volume (Tons) Projection, By Form 2021 to 2036
Figure 363: GCC Countries Global Mechanically Separated Meat Market Incremental Opportunities (USD Million) Forecast, By Form 2026 to 2036
Figure 364: GCC Countries Global Mechanically Separated Meat Market Value (USD Million) Projection, By Processing Technology 2021 to 2036
Figure 365: GCC Countries Global Mechanically Separated Meat Market Volume (Tons) Projection, By Processing Technology 2021 to 2036
Figure 366: GCC Countries Global Mechanically Separated Meat Market Incremental Opportunities (USD Million) Forecast, By Processing Technology 2026 to 2036
Figure 367: GCC Countries Global Mechanically Separated Meat Market Value (USD Million) Projection, By Application 2021 to 2036
Figure 368: GCC Countries Global Mechanically Separated Meat Market Volume (Tons) Projection, By Application 2021 to 2036
Figure 369: GCC Countries Global Mechanically Separated Meat Market Incremental Opportunities (USD Million) Forecast, By Application 2026 to 2036
Figure 370: GCC Countries Global Mechanically Separated Meat Market Value (USD Million) Projection, By End-user 2021 to 2036
Figure 371: GCC Countries Global Mechanically Separated Meat Market Volume (Tons) Projection, By End-user 2021 to 2036
Figure 372: GCC Countries Global Mechanically Separated Meat Market Incremental Opportunities (USD Million) Forecast, By End-user 2026 to 2036
Figure 373: GCC Countries Global Mechanically Separated Meat Market Value (USD Million) Projection, By Distribution Channel 2021 to 2036
Figure 374: GCC Countries Global Mechanically Separated Meat Market Volume (Tons) Projection, By Distribution Channel 2021 to 2036
Figure 375: GCC Countries Global Mechanically Separated Meat Market Incremental Opportunities (USD Million) Forecast, By Distribution Channel 2026 to 2036
Figure 376: South Africa Global Mechanically Separated Meat Market Value (USD Million) Projection, By Source 2021 to 2036
Figure 377: South Africa Global Mechanically Separated Meat Market Volume (Tons) Projection, By Source 2021 to 2036
Figure 378: South Africa Global Mechanically Separated Meat Market Incremental Opportunities (USD Million) Forecast, By Source 2026 to 2036
Figure 379: South Africa Global Mechanically Separated Meat Market Value (USD Million) Projection, By Form 2021 to 2036
Figure 380: South Africa Global Mechanically Separated Meat Market Volume (Tons) Projection, By Form 2021 to 2036
Figure 381: South Africa Global Mechanically Separated Meat Market Incremental Opportunities (USD Million) Forecast, By Form 2026 to 2036
Figure 382: South Africa Global Mechanically Separated Meat Market Value (USD Million) Projection, By Processing Technology 2021 to 2036
Figure 383: South Africa Global Mechanically Separated Meat Market Volume (Tons) Projection, By Processing Technology 2021 to 2036
Figure 384: South Africa Global Mechanically Separated Meat Market Incremental Opportunities (USD Million) Forecast, By Processing Technology 2026 to 2036
Figure 385: South Africa Global Mechanically Separated Meat Market Value (USD Million) Projection, By Application 2021 to 2036
Figure 386: South Africa Global Mechanically Separated Meat Market Volume (Tons) Projection, By Application 2021 to 2036
Figure 387: South Africa Global Mechanically Separated Meat Market Incremental Opportunities (USD Million) Forecast, By Application 2026 to 2036
Figure 388: South Africa Global Mechanically Separated Meat Market Value (USD Million) Projection, By End-user 2021 to 2036
Figure 389: South Africa Global Mechanically Separated Meat Market Volume (Tons) Projection, By End-user 2021 to 2036
Figure 390: South Africa Global Mechanically Separated Meat Market Incremental Opportunities (USD Million) Forecast, By End-user 2026 to 2036
Figure 391: South Africa Global Mechanically Separated Meat Market Value (USD Million) Projection, By Distribution Channel 2021 to 2036
Figure 392: South Africa Global Mechanically Separated Meat Market Volume (Tons) Projection, By Distribution Channel 2021 to 2036
Figure 393: South Africa Global Mechanically Separated Meat Market Incremental Opportunities (USD Million) Forecast, By Distribution Channel 2026 to 2036
Figure 394: Latin America Global Mechanically Separated Meat Market Value (USD Million) Projection, By Source 2021 to 2036
Figure 395: Latin America Global Mechanically Separated Meat Market Volume (Tons) Projection, By Source 2021 to 2036
Figure 396: Latin America Global Mechanically Separated Meat Market Incremental Opportunities (USD Million) Forecast, By Source 2026 to 2036
Figure 397: Latin America Global Mechanically Separated Meat Market Value (USD Million) Projection, By Form 2021 to 2036
Figure 398: Latin America Global Mechanically Separated Meat Market Volume (Tons) Projection, By Form 2021 to 2036
Figure 399: Latin America Global Mechanically Separated Meat Market Incremental Opportunities (USD Million) Forecast, By Form 2026 to 2036
Figure 400: Latin America Global Mechanically Separated Meat Market Value (USD Million) Projection, By Processing Technology 2021 to 2036
Figure 401: Latin America Global Mechanically Separated Meat Market Volume (Tons) Projection, By Processing Technology 2021 to 2036
Figure 402: Latin America Global Mechanically Separated Meat Market Incremental Opportunities (USD Million) Forecast, By Processing Technology 2026 to 2036
Figure 403: Latin America Global Mechanically Separated Meat Market Value (USD Million) Projection, By Application 2021 to 2036
Figure 404: Latin America Global Mechanically Separated Meat Market Volume (Tons) Projection, By Application 2021 to 2036
Figure 405: Latin America Global Mechanically Separated Meat Market Incremental Opportunities (USD Million) Forecast, By Application 2026 to 2036
Figure 406: Latin America Global Mechanically Separated Meat Market Value (USD Million) Projection, By End-user 2021 to 2036
Figure 407: Latin America Global Mechanically Separated Meat Market Volume (Tons) Projection, By End-user 2021 to 2036
Figure 408: Latin America Global Mechanically Separated Meat Market Incremental Opportunities (USD Million) Forecast, By End-user 2026 to 2036
Figure 409: Latin America Global Mechanically Separated Meat Market Value (USD Million) Projection, By Distribution Channel 2021 to 2036
Figure 410: Latin America Global Mechanically Separated Meat Market Volume (Tons) Projection, By Distribution Channel 2021 to 2036
Figure 411: Latin America Global Mechanically Separated Meat Market Incremental Opportunities (USD Million) Forecast, By Distribution Channel 2026 to 2036
Figure 412: Latin America Global Mechanically Separated Meat Market Value (USD Million) Projection, By Country 2021 to 2036
Figure 413: Latin America Global Mechanically Separated Meat Market Volume (Tons) Projection, By Country 2021 to 2036
Figure 414: Latin America Global Mechanically Separated Meat Market Incremental Opportunities (USD Million) Forecast, By Country 2026 to 2036
Figure 415: Brazil Global Mechanically Separated Meat Market Value (USD Million) Projection, By Source 2021 to 2036
Figure 416: Brazil Global Mechanically Separated Meat Market Volume (Tons) Projection, By Source 2021 to 2036
Figure 417: Brazil Global Mechanically Separated Meat Market Incremental Opportunities (USD Million) Forecast, By Source 2026 to 2036
Figure 418: Brazil Global Mechanically Separated Meat Market Value (USD Million) Projection, By Form 2021 to 2036
Figure 419: Brazil Global Mechanically Separated Meat Market Volume (Tons) Projection, By Form 2021 to 2036
Figure 420: Brazil Global Mechanically Separated Meat Market Incremental Opportunities (USD Million) Forecast, By Form 2026 to 2036
Figure 421: Brazil Global Mechanically Separated Meat Market Value (USD Million) Projection, By Processing Technology 2021 to 2036
Figure 422: Brazil Global Mechanically Separated Meat Market Volume (Tons) Projection, By Processing Technology 2021 to 2036
Figure 423: Brazil Global Mechanically Separated Meat Market Incremental Opportunities (USD Million) Forecast, By Processing Technology 2026 to 2036
Figure 424: Brazil Global Mechanically Separated Meat Market Value (USD Million) Projection, By Application 2021 to 2036
Figure 425: Brazil Global Mechanically Separated Meat Market Volume (Tons) Projection, By Application 2021 to 2036
Figure 426: Brazil Global Mechanically Separated Meat Market Incremental Opportunities (USD Million) Forecast, By Application 2026 to 2036
Figure 427: Brazil Global Mechanically Separated Meat Market Value (USD Million) Projection, By End-user 2021 to 2036
Figure 428: Brazil Global Mechanically Separated Meat Market Volume (Tons) Projection, By End-user 2021 to 2036
Figure 429: Brazil Global Mechanically Separated Meat Market Incremental Opportunities (USD Million) Forecast, By End-user 2026 to 2036
Figure 430: Brazil Global Mechanically Separated Meat Market Value (USD Million) Projection, By Distribution Channel 2021 to 2036
Figure 431: Brazil Global Mechanically Separated Meat Market Volume (Tons) Projection, By Distribution Channel 2021 to 2036
Figure 432: Brazil Global Mechanically Separated Meat Market Incremental Opportunities (USD Million) Forecast, By Distribution Channel 2026 to 2036
Figure 433: Mexico Global Mechanically Separated Meat Market Value (USD Million) Projection, By Source 2021 to 2036
Figure 434: Mexico Global Mechanically Separated Meat Market Volume (Tons) Projection, By Source 2021 to 2036
Figure 435: Mexico Global Mechanically Separated Meat Market Incremental Opportunities (USD Million) Forecast, By Source 2026 to 2036
Figure 436: Mexico Global Mechanically Separated Meat Market Value (USD Million) Projection, By Form 2021 to 2036
Figure 437: Mexico Global Mechanically Separated Meat Market Volume (Tons) Projection, By Form 2021 to 2036
Figure 438: Mexico Global Mechanically Separated Meat Market Incremental Opportunities (USD Million) Forecast, By Form 2026 to 2036
Figure 439: Mexico Global Mechanically Separated Meat Market Value (USD Million) Projection, By Processing Technology 2021 to 2036
Figure 440: Mexico Global Mechanically Separated Meat Market Volume (Tons) Projection, By Processing Technology 2021 to 2036
Figure 441: Mexico Global Mechanically Separated Meat Market Incremental Opportunities (USD Million) Forecast, By Processing Technology 2026 to 2036
Figure 442: Mexico Global Mechanically Separated Meat Market Value (USD Million) Projection, By Application 2021 to 2036
Figure 443: Mexico Global Mechanically Separated Meat Market Volume (Tons) Projection, By Application 2021 to 2036
Figure 444: Mexico Global Mechanically Separated Meat Market Incremental Opportunities (USD Million) Forecast, By Application 2026 to 2036
Figure 445: Mexico Global Mechanically Separated Meat Market Value (USD Million) Projection, By End-user 2021 to 2036
Figure 446: Mexico Global Mechanically Separated Meat Market Volume (Tons) Projection, By End-user 2021 to 2036
Figure 447: Mexico Global Mechanically Separated Meat Market Incremental Opportunities (USD Million) Forecast, By End-user 2026 to 2036
Figure 448: Mexico Global Mechanically Separated Meat Market Value (USD Million) Projection, By Distribution Channel 2021 to 2036
Figure 449: Mexico Global Mechanically Separated Meat Market Volume (Tons) Projection, By Distribution Channel 2021 to 2036
Figure 450: Mexico Global Mechanically Separated Meat Market Incremental Opportunities (USD Million) Forecast, By Distribution Channel 2026 to 2036
Figure 451: Argentina Global Mechanically Separated Meat Market Value (USD Million) Projection, By Source 2021 to 2036
Figure 452: Argentina Global Mechanically Separated Meat Market Volume (Tons) Projection, By Source 2021 to 2036
Figure 453: Argentina Global Mechanically Separated Meat Market Incremental Opportunities (USD Million) Forecast, By Source 2026 to 2036
Figure 454: Argentina Global Mechanically Separated Meat Market Value (USD Million) Projection, By Form 2021 to 2036
Figure 455: Argentina Global Mechanically Separated Meat Market Volume (Tons) Projection, By Form 2021 to 2036
Figure 456: Argentina Global Mechanically Separated Meat Market Incremental Opportunities (USD Million) Forecast, By Form 2026 to 2036
Figure 457: Argentina Global Mechanically Separated Meat Market Value (USD Million) Projection, By Processing Technology 2021 to 2036
Figure 458: Argentina Global Mechanically Separated Meat Market Volume (Tons) Projection, By Processing Technology 2021 to 2036
Figure 459: Argentina Global Mechanically Separated Meat Market Incremental Opportunities (USD Million) Forecast, By Processing Technology 2026 to 2036
Figure 460: Argentina Global Mechanically Separated Meat Market Value (USD Million) Projection, By Application 2021 to 2036
Figure 461: Argentina Global Mechanically Separated Meat Market Volume (Tons) Projection, By Application 2021 to 2036
Figure 462: Argentina Global Mechanically Separated Meat Market Incremental Opportunities (USD Million) Forecast, By Application 2026 to 2036
Figure 463: Argentina Global Mechanically Separated Meat Market Value (USD Million) Projection, By End-user 2021 to 2036
Figure 464: Argentina Global Mechanically Separated Meat Market Volume (Tons) Projection, By End-user 2021 to 2036
Figure 465: Argentina Global Mechanically Separated Meat Market Incremental Opportunities (USD Million) Forecast, By End-user 2026 to 2036
Figure 466: Argentina Global Mechanically Separated Meat Market Value (USD Million) Projection, By Distribution Channel 2021 to 2036
Figure 467: Argentina Global Mechanically Separated Meat Market Volume (Tons) Projection, By Distribution Channel 2021 to 2036
Figure 468: Argentina Global Mechanically Separated Meat Market Incremental Opportunities (USD Million) Forecast, By Distribution Channel 2026 to 2036
Copyright © Transparency Market Research, Inc. All Rights reserved
Trust Online


Mechanically Separated Meat Market
