
Reports
Reports
Analysts’ Viewpoint
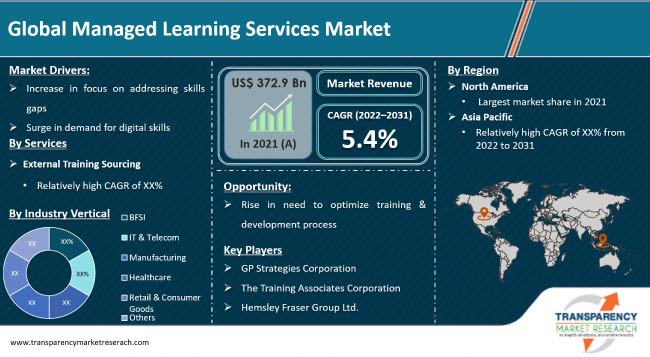
Increase in focus on addressing skills gaps is driving the managed learning service market size. Managed training services help fill skill gaps in the modern, digital, and post-industrial economy. Managed learning services outsourcing is gaining traction across the globe, as businesses look to cover the entire spectrum of Learning & Development (L&D) offerings to achieve operational excellence.
Expansion in the BFSI sector is expected to augment market statistics during the forecast period. Managed learning services are widely used in banking and financial institutions due to the continuous adoption of the latest technologies to enhance customer experience in these institutions. Thus, surge in demand for training management services and digital skills is likely to offer lucrative opportunities for market players. Service providers are focusing on expanding their presence in various industry verticals to increase their managed learning services market share.
Managed learning services refer to the outsourcing of management for training activities. These services help organizations manage their overall training and development programs by providing them with the ability to outsource a part or entire learning and performance function. This reduces the organization’s burden of overheads and other hassles associated with learning.
Managed learning services model is customized to suit the budget of various types of organizations. It helps enhance training effectiveness, reduce costs, and improve business impact by streamlining training operations. In-depth learning analysis is employed to determine appropriate learning solutions needed to improve business performance. Customized learning is more research-driven and application-oriented. Managed learning services provide a wide range of expertise, while reducing training costs by 15% to 20%.
Organizations are making headway in bridging skills shortage. Hard skills that employees lack primarily include writing proficiency, public speaking, and data analysis. Critical thinking, communication, leadership, and attention to detail are some of the soft skills that employees lack. Several companies are investing time and money in training to ensure their employees adapt to the changing times.
Recently, JPMorgan Chase & Co. announced plans to invest US$ 600 Mn to upskill its workforce, while Amazon is investing over US$ 700 Mn in employee upskill. PwC is investing around US$ 3 Bn to upskill its employees over the tenure of three to four years.
Organizations are emphasizing employee and leadership development at the system and individual levels to address skills gaps. They are also focusing on articulating the most critical behaviors that reflect values and leadership standards. Thus, vendors in the market are launching new models of L&D to broaden the current thinking and industry best practices required for career development and building a smoother and easy learning ecosystem.
Increase in demand for online learning and surge in adoption of remote working are expected to influence the future of managed learning services. The shift to remote learning has caused disruption across the L&D sector. It has prompted the need to develop new solutions that can help address the evolving learning landscape. Managed learning services can help bridge skills gap by integrating new technologies and digital platforms.
Organizations are increasingly adopting managed learning services to redesign their training outsourcing strategies. They are focusing on long-term plans to increase the organization’s agility. Optimization of the training outsourcing strategy with managed learning services can enable a company to prepare for future changes in the market.
Training & development processes facilitate organizations to retain and gain top talent with improved productivity. Managed learning services ensure the availability of resources needed to develop high-quality training materials, thereby accelerating the entire training & development process. Training management service providers offer end-to-end services and expertise in a variety of areas of training and development.
According to the latest managed learning services market forecast, North America is expected to dominate the business during 2022 to 2031. The region held significant share in 2021. Presence of several key managed learning service providers and rise in adoption of advanced technologies in L&D are driving market progress in North America.
The market in Asia Pacific is expected to grow at the highest CAGR in the next few years. Surge in usage of learning and development services in several industry verticals is propelling managed learning services market expansion in the region.
Detailed profiles of vendors have been provided in the managed learning services market report to evaluate their financials, key product offerings, recent developments, and strategies. Prominent companies are expanding their service offerings to enhance their market share.
GP Strategies Corporation, The Training Associates Corporation, NIIT, Capita plc, The City & Guilds Group, QA Total Learning, Hemsley Fraser Group Ltd., Infopro Learning, Inc., Skillsoft, Conduent, Inc., NetCom Learning, Learning Tree International, Inc., TÜV Rheinland, and MPS Interactive Systems Limited are key entities operating in the market.
|
Attribute |
Detail |
|
Market Size Value in 2021 |
US$ 372.9 Bn |
|
Market Forecast Value in 2031 |
US$ 624.1 Bn |
|
Growth Rate (CAGR) |
5.4% |
|
Forecast Period |
2022–2031 |
|
Historical Data Available for |
2016–2020 |
|
Quantitative Units |
US$ Bn for Value |
|
Market Analysis |
Includes cross-segment analysis at global as well as regional level. Furthermore, the qualitative analysis includes drivers, restraints, opportunities, key trends, analysis, value chain analysis, and key trend analysis. |
|
Competition Landscape |
|
|
Format |
Electronic (PDF) + Excel |
|
Market Segmentation |
|
|
Regions Covered |
|
|
Countries Covered |
|
|
Companies Profiled |
|
|
Customization Scope |
Available upon request |
|
Pricing |
Available upon request |
It was valued at US$ 372.9 Bn in 2021
The CAGR is expected to be 5.4% during 2022-2031
It is expected to reach US$ 624.1 Bn by 2031
Cost optimization and overhead reduction, freedom to focus on learning goals, and better alignment of learning
Increase in focus on addressing skills gaps and surge in demand for digital skills
North America accounted for 44.5% share in 2022
GP Strategies Corporation, The Training Associates Corporation, NIIT, Capita plc, The City & Guilds Group, QA Total Learning, Hemsley Fraser Group Ltd., Infopro Learning, Inc., Skillsoft, Conduent, Inc., NetCom Learning, Learning Tree International, Inc., TÜV Rheinland, and MPS Interactive Systems Limited
1. Preface
1.1. Market Introduction
1.2. Market Segmentation
1.3. Key Research Objectives
2. Assumptions and Research Methodology
2.1. Research Methodology
2.1.1. List of Primary and Secondary Sources
2.2. Key Assumptions for Data Modelling
3. Executive Summary: Global Managed Learning Services Market
4. Market Overview
4.1. Market Definition
4.2. Technology/Product Roadmap
4.3. Market Factor Analysis
4.3.1. Forecast Factors
4.3.2. Ecosystem/Value Chain Analysis
4.3.3. Market Dynamics (Growth Influencers)
4.3.3.1. Drivers
4.3.3.2. Restraints
4.3.3.3. Opportunities
4.3.3.4. Impact Analysis of Drivers and Restraints
4.4. COVID-19 Impact Analysis
4.4.1. Impact of COVID-19 on Managed Learning Services Market
4.4.2. Industry Vertical Sentiment Analysis: Comparative Analysis on Spending
4.4.2.1. Increase in Spending
4.4.2.2. Decrease in Spending
4.4.3. Short-term and Long-term Impact on Market
4.5. Market Opportunity Assessment – by Region (North America/Europe/Asia Pacific/Middle East & Africa/ South America)
4.5.1. By Services
4.5.2. By Delivery Mode
4.5.3. By Enterprise Size
4.5.4. By Industry Vertical
5. Global Managed Learning Services Market Analysis and Forecast
5.1. Market Revenue Analysis (US$ Bn), 2016-2031
5.1.1. Historic Growth Trends, 2016-2021
5.1.2. Forecast Trends, 2022-2031
6. Global Managed Learning Services Market Analysis, by Services
6.1. Overview and Definitions
6.2. Key Segment Analysis
6.3. Managed Learning Services Market Size (US$ Bn) Forecast, by Services, 2018 - 2031
6.3.1. External Training Sourcing
6.3.2. L&D Administration
6.3.3. Others
7. Global Managed Learning Services Market Analysis, by Delivery Mode
7.1. Overview and Definitions
7.2. Key Segment Analysis
7.3. Managed Learning Services Market Size (US$ Bn) Forecast, by Delivery Mode, 2018 - 2031
7.3.1. Online
7.3.2. Offline
7.3.3. Blended
8. Global Managed Learning Services Market Analysis, by Enterprise Size
8.1. Overview and Definitions
8.2. Key Segment Analysis
8.3. Managed Learning Services Market Size (US$ Bn) Forecast, by Enterprise Size, 2018 - 2031
8.3.1. SMEs
8.3.2. Large Enterprises
9. Global Managed Learning Services Market Analysis, by Industry Vertical
9.1. Key Segment Analysis
9.2. Managed Learning Services Market Size (US$ Bn) Forecast, by Industry Vertical, 2018 - 2031
9.2.1. BFSI
9.2.2. IT & Telecom
9.2.3. Manufacturing
9.2.4. Healthcare
9.2.5. Retail & Consumer Goods
9.2.6. Others
10. Global Managed Learning Services Market Analysis and Forecast, by Region
10.1. Key Findings
10.2. Market Size (US$ Bn) Forecast by Region, 2018-2031
10.2.1. North America
10.2.2. Europe
10.2.3. Asia Pacific
10.2.4. Middle East & Africa
10.2.5. South America
11. North America Managed Learning Services Market Analysis and Forecast
11.1. Regional Outlook
11.2. Managed Learning Services Market Size (US$ Bn) Analysis and Forecast, 2018 - 2031
11.2.1. By Services
11.2.2. By Delivery Mode
11.2.3. By Enterprise Size
11.2.4. By Industry Vertical
11.3. Managed Learning Services Market Size (US$ Bn) Forecast, by Country, 2018 - 2031
11.3.1. U.S.
11.3.2. Canada
11.3.3. Mexico
12. Europe Managed Learning Services Market Analysis and Forecast
12.1. Regional Outlook
12.2. Managed Learning Services Market Size (US$ Bn) Analysis and Forecast, 2018 - 2031
12.2.1. By Services
12.2.2. By Delivery Mode
12.2.3. By Enterprise Size
12.2.4. By Industry Vertical
12.3. Managed Learning Services Market Size (US$ Bn) Forecast, by Country, 2018 - 2031
12.3.1. Germany
12.3.2. U.K.
12.3.3. France
12.3.4. Italy
12.3.5. Spain
12.3.6. Rest of Europe
13. Asia Pacific Managed Learning Services Market Analysis and Forecast
13.1. Regional Outlook
13.2. Managed Learning Services Market Size (US$ Bn) Analysis and Forecast, 2018 - 2031
13.2.1. By Services
13.2.2. By Delivery Mode
13.2.3. By Enterprise Size
13.2.4. By Industry Vertical
13.3. Managed Learning Services Market Size (US$ Bn) Forecast, by Country, 2018 - 2031
13.3.1. China
13.3.2. India
13.3.3. Japan
13.3.4. ASEAN
13.3.5. Rest of Asia Pacific
14. Middle East & Africa Managed Learning Services Market Analysis and Forecast
14.1. Regional Outlook
14.2. Managed Learning Services Market Size (US$ Bn) Analysis and Forecast, 2018 - 2031
14.2.1. By Services
14.2.2. By Delivery Mode
14.2.3. By Enterprise Size
14.2.4. By Industry Vertical
14.3. Managed Learning Services Market Size (US$ Bn) Forecast, by Country, 2018 - 2031
14.3.1. Saudi Arabia
14.3.2. United Arab Emirates
14.3.3. South Africa
14.3.4. Rest of Middle East & Africa
15. South America Managed Learning Services Market Analysis and Forecast
15.1. Regional Outlook
15.2. Managed Learning Services Market Size (US$ Bn) Analysis and Forecast, 2018 - 2031
15.2.1. By Services
15.2.2. By Delivery Mode
15.2.3. By Enterprise Size
15.2.4. By Industry Vertical
15.3. Managed Learning Services Market Size (US$ Bn) Forecast, by Country, 2018 - 2031
15.3.1. Brazil
15.3.2. Argentina
15.3.3. Rest of South America
16. Competition Landscape
16.1. Market Competition Matrix, by Leading Players
16.2. Market Revenue Share Analysis (%), by Leading Players (2021)
16.3. Competitive Scenario
16.3.1. List of Emerging, Prominent, and Leading Players
16.3.2. Major Mergers & Acquisitions, Expansions, Partnership, Contacts, Deals, etc.
17. Company Profiles
17.1. GP Strategies Corporation
17.1.1. Business Overview
17.1.2. Company Revenue
17.1.3. Product Portfolio
17.1.4. Geographic Footprint
17.1.5. Strategic Partnership, Merger & Acquisition, Business Expansion, New Product Launch, Innovation, etc.
17.2. The Training Associates Corporation
17.2.1. Business Overview
17.2.2. Company Revenue
17.2.3. Product Portfolio
17.2.4. Geographic Footprint
17.2.5. Strategic Partnership, Merger & Acquisition, Business Expansion, New Product Launch, Innovation, etc.
17.3. NIIT
17.3.1. Business Overview
17.3.2. Company Revenue
17.3.3. Product Portfolio
17.3.4. Geographic Footprint
17.3.5. Strategic Partnership, Merger & Acquisition, Business Expansion, New Product Launch, Innovation, etc.
17.4. Capita PLC
17.4.1. Business Overview
17.4.2. Company Revenue
17.4.3. Product Portfolio
17.4.4. Geographic Footprint
17.4.5. Strategic Partnership, Merger & Acquisition, Business Expansion, New Product Launch, Innovation, etc.
17.5. The City & Guilds Group
17.5.1. Business Overview
17.5.2. Company Revenue
17.5.3. Product Portfolio
17.5.4. Geographic Footprint
17.5.5. Strategic Partnership, Merger & Acquisition, Business Expansion, New Product Launch, Innovation, etc.
17.6. QA Total Learning
17.6.1. Business Overview
17.6.2. Company Revenue
17.6.3. Product Portfolio
17.6.4. Geographic Footprint
17.6.5. Strategic Partnership, Merger & Acquisition, Business Expansion, New Product Launch, Innovation, etc.
17.7. Hemsley Fraser Group Ltd.
17.7.1. Business Overview
17.7.2. Company Revenue
17.7.3. Product Portfolio
17.7.4. Geographic Footprint
17.7.5. Strategic Partnership, Merger & Acquisition, Business Expansion, New Product Launch, Innovation, etc.
17.8. Infopro Learning, Inc.
17.8.1. Business Overview
17.8.2. Company Revenue
17.8.3. Product Portfolio
17.8.4. Geographic Footprint
17.8.5. Strategic Partnership, Merger & Acquisition, Business Expansion, New Product Launch, Innovation, etc.
17.9. Skillsoft
17.9.1. Business Overview
17.9.2. Company Revenue
17.9.3. Product Portfolio
17.9.4. Geographic Footprint
17.9.5. Strategic Partnership, Merger & Acquisition, Business Expansion, New Product Launch, Innovation, etc.
17.10. Conduent, Inc.
17.10.1. Business Overview
17.10.2. Company Revenue
17.10.3. Product Portfolio
17.10.4. Geographic Footprint
17.10.5. Strategic Partnership, Merger & Acquisition, Business Expansion, New Product Launch, Innovation, etc.
17.11. NetCom Learning
17.11.1. Business Overview
17.11.2. Company Revenue
17.11.3. Product Portfolio
17.11.4. Geographic Footprint
17.11.5. Strategic Partnership, Merger & Acquisition, Business Expansion, New Product Launch, Innovation, etc.
17.12. Learning Tree International, Inc.
17.12.1. Business Overview
17.12.2. Company Revenue
17.12.3. Product Portfolio
17.12.4. Geographic Footprint
17.12.5. Strategic Partnership, Merger & Acquisition, Business Expansion, New Product Launch, Innovation, etc.
17.13. TÜV Rheinland
17.13.1. Business Overview
17.13.2. Company Revenue
17.13.3. Product Portfolio
17.13.4. Geographic Footprint
17.13.5. Strategic Partnership, Merger & Acquisition, Business Expansion, New Product Launch, Innovation, etc.
17.14. MPS Interactive Systems Limited
17.14.1. Business Overview
17.14.2. Company Revenue
17.14.3. Product Portfolio
17.14.4. Geographic Footprint
17.14.5. Strategic Partnership, Merger & Acquisition, Business Expansion, New Product Launch, Innovation, etc.
17.15. Others
18. Key Takeaways
List of Tables
Table 1: Acronyms Used in Managed Learning Services Market
Table 2: North America Managed Learning Services Market Revenue Analysis, by Country, 2022 - 2031 (US$ Bn)
Table 3: Europe Managed Learning Services Market Revenue Analysis, by Country, 2022 - 2031 (US$ Bn)
Table 4: Asia Pacific Managed Learning Services Market Revenue Analysis, by Country, 2022 - 2031 (US$ Bn)
Table 5: Middle East & Africa Managed Learning Services Market Revenue Analysis, by Country, 2021 and 2031 (US$ Bn)
Table 6: South America Managed Learning Services Market Revenue Analysis, by Country, 2022 - 2031 (US$ Bn)
Table 7: Forecast Factors: Relevance and Impact (1/2)
Table 8: Forecast Factors: Relevance and Impact (2/2)
Table 9: Impact Analysis of Drivers & Restraints
Table 10: Global Managed Learning Services Market Value (US$ Bn) Forecast, by Services, 2018 – 2031
Table 11: Global Managed Learning Services Market Value (US$ Bn) Forecast, by Enterprise Size, 2018 – 2031
Table 12: Global Managed Learning Services Market Value (US$ Bn) Forecast, by Delivery Mode, 2018 – 2031
Table 13: Global Managed Learning Services Market Value (US$ Bn) Forecast, by Industry Vertical, 2018 – 2031
Table 14: Global Managed Learning Services Market Volume (US$ Bn) Forecast, by Region, 2018 - 2031
Table 15: North America Managed Learning Services Market Value (US$ Bn) Forecast, by Services, 2018 – 2031
Table 16: North America Managed Learning Services Market Value (US$ Bn) Forecast, by Enterprise Size, 2018 – 2031
Table 17: North America Managed Learning Services Market Value (US$ Bn) Forecast, by Delivery Mode, 2018 – 2031
Table 18: North America Managed Learning Services Market Value (US$ Bn) Forecast, by Industry Vertical, 2018 – 2031
Table 19: North America Managed Learning Services Market Value (US$ Bn) Forecast, by Country, 2018 - 2031
Table 20: U.S. Managed Learning Services Market Revenue CAGR Breakdown (%), by Growth Term
Table 21: Canada Managed Learning Services Market Revenue CAGR Breakdown (%), by Growth Term
Table 22: Mexico Managed Learning Services Market Revenue CAGR Breakdown (%), by Growth Term
Table 23: Europe Managed Learning Services Market Value (US$ Bn) Forecast, by Services, 2018 – 2031
Table 24: Europe Managed Learning Services Market Value (US$ Bn) Forecast, by Enterprise Size, 2018 – 2031
Table 25: Europe Managed Learning Services Market Value (US$ Bn) Forecast, by Delivery Mode, 2018 – 2031
Table 26: Europe Managed Learning Services Market Value (US$ Bn) Forecast, by Industry Vertical, 2018 – 2031
Table 27: Europe Managed Learning Services Market Value (US$ Bn) Forecast, by Country, 2018 - 2031
Table 28: Germany Managed Learning Services Market Revenue CAGR Breakdown (%), by Growth Term
Table 29: U.K. Managed Learning Services Market Revenue CAGR Breakdown (%), by Growth Term
Table 30: France Managed Learning Services Market Revenue CAGR Breakdown (%), by Growth Term
Table 31: Italy Managed Learning Services Market Revenue CAGR Breakdown (%), by Growth Term
Table 32: Spain Managed Learning Services Market Revenue CAGR Breakdown (%), by Growth Term
Table 33: Asia Pacific Managed Learning Services Market Value (US$ Bn) Forecast, by Services, 2018 – 2031
Table 34: Asia Pacific Managed Learning Services Market Value (US$ Bn) Forecast, by Delivery Mode, 2018 – 2031
Table 35: Asia Pacific Managed Learning Services Market Value (US$ Bn) Forecast, by Enterprise Size, 2018 – 2031
Table 36: Asia Pacific Managed Learning Services Market Value (US$ Bn) Forecast, by Industry Vertical, 2018 – 2031
Table 37: Asia Pacific Managed Learning Services Market Value (US$ Bn) Forecast, by Country, 2018 - 2031
Table 38: China Managed Learning Services Market Revenue CAGR Breakdown (%), by Growth Term
Table 39: India Managed Learning Services Market Revenue CAGR Breakdown (%), by Growth Term
Table 40: Japan Managed Learning Services Market Revenue CAGR Breakdown (%), by Growth Term
Table 41: ASEAN Managed Learning Services Market Revenue CAGR Breakdown (%), by Growth Term
Table 42: Middle East & Africa Managed Learning Services Market Value (US$ Bn) Forecast, by Services, 2018 – 2031
Table 43: Middle East & Africa Managed Learning Services Market Value (US$ Bn) Forecast, by Delivery Mode, 2018 – 2031
Table 44: Middle East & Africa Managed Learning Services Market Value (US$ Bn) Forecast, by Enterprise Size, 2018 – 2031
Table 45: Middle East & Africa Managed Learning Services Market Value (US$ Bn) Forecast, by Industry Vertical, 2018 – 2031
Table 46: Middle East & Africa Managed Learning Services Market Value (US$ Bn) Forecast, by Country, 2018 - 2031
Table 47: Saudi Arabia Managed Learning Services Market Revenue CAGR Breakdown (%), by Growth Term
Table 48: United Arab Emirates Managed Learning Services Market Revenue CAGR Breakdown (%), by Growth Term
Table 49: South Africa Managed Learning Services Market Revenue CAGR Breakdown (%), by Growth Term
Table 50: South America Managed Learning Services Market Value (US$ Bn) Forecast, by Services, 2018 – 2031
Table 51: South America a Managed Learning Services Market Value (US$ Bn) Forecast, by Delivery Mode, 2018 – 2031
Table 52: South America Managed Learning Services Market Value (US$ Bn) Forecast, by Enterprise Size, 2018 – 2031
Table 53: South America Managed Learning Services Market Value (US$ Bn) Forecast, by Industry Vertical, 2018 – 2031
Table 54: South America Managed Learning Services Market Value (US$ Bn) Forecast, by Country, 2018 - 2031
Table 55: Brazil Managed Learning Services Market Revenue CAGR Breakdown (%), by Growth Term
Table 56: Argentina Managed Learning Services Market Revenue CAGR Breakdown (%), by Growth Term
Table 57: Mergers & Acquisitions, Partnerships (1/2)
Table 58: Mergers & Acquisitions, Partnership (2/2)
List of Figures
Figure 1: Global Managed Learning Services Market Size (US$ Bn) Forecast, 2018–2031
Figure 2: Global Managed Learning Services Market Revenue (US$ Bn) Opportunity Assessment, by Region, 2022E
Figure 3: Top Segment Analysis of Managed Learning Services Market
Figure 4: Global Managed Learning Services Market Revenue (US$ Bn) Opportunity Assessment, by Region, 2031F
Figure 5: Global Managed Learning Services Market Attractiveness Assessment, by Services
Figure 6: Global Managed Learning Services Market Attractiveness Assessment, by Enterprise Size
Figure 7: Global Managed Learning Services Market Attractiveness Assessment, by Delivery Mode
Figure 8: Global Managed Learning Services Market Attractiveness Assessment, by Industry Vertical
Figure 9: Global Managed Learning Services Market Attractiveness Assessment, by Region
Figure 10: Global Managed Learning Services Market Revenue (US$ Bn) Historic Trends, 2016 – 2021
Figure 11: Global Managed Learning Services Market Revenue Opportunity (US$ Bn) Historic Trends, 2016 – 2021
Figure 12: Global Managed Learning Services Market Value Share Analysis, by Enterprise Size, 2022
Figure 13: Global Managed Learning Services Market Value Share Analysis, by Enterprise Services, 2031
Figure 14: Global Managed Learning Services Market Absolute Opportunity (US$ Bn), by, SMEs 2022 – 2031
Figure 15: Global Managed Learning Services Market Absolute Opportunity (US$ Bn), by Large Enterprises, 2022 – 2031
Figure 16: Global Managed Learning Services Market Value Share Analysis, by Delivery Mode, 2022
Figure 17: Global Managed Learning Services Market Value Share Analysis, by Delivery Mode, 2031
Figure 18: Global Managed Learning Services Market Absolute Opportunity (US$ Bn), by, Online 2022 – 2031
Figure 19: Global Managed Learning Services Market Absolute Opportunity (US$ Bn), by, Offline, 2022 – 2031
Figure 20: Global Managed Learning Services Market Absolute Opportunity (US$ Bn), by Blended, 2022 – 2031
Figure 21: Global Managed Learning Services Market Value Share Analysis, by Industry Vertical, 2022
Figure 22: Global Managed Learning Services Market Value Share Analysis, by Industry Vertical, 2031
Figure 23: Global Managed Learning Services Market Absolute Opportunity (US$ Bn), by 2022 – 2031
Figure 24: Global Managed Learning Services Market Absolute Opportunity (US$ Bn), by, BFSI 2022 – 2031
Figure 25: Global Managed Learning Services Market Absolute Opportunity (US$ Bn), by IT & Telecom, 2022 – 2031
Figure 26: Global Managed Learning Services Market Absolute Opportunity (US$ Bn), by Manufacturing, 2022 – 2031
Figure 27: Global Managed Learning Services Market Absolute Opportunity (US$ Bn), by Healthcare, 2022 – 2031
Figure 28: Global Managed Learning Services Market Absolute Opportunity (US$ Bn), by Retail and Consumer Goods, 2022 – 2031
Figure 29: Global Managed Learning Services Market Absolute Opportunity (US$ Bn), by Others, 2022 – 2031
Figure 30: Global Managed Learning Services Market Opportunity (US$ Bn), by Region
Figure 31: Global Managed Learning Services Market Opportunity Share (%), by Region, 2022–2031
Figure 32: Global Managed Learning Services Market Size (US$ Bn), by Region, 2022 & 2031
Figure 33: Global Managed Learning Services Market Value Share Analysis, by Region, 2022
Figure 34: Global Managed Learning Services Market Value Share Analysis, by Region, 2031
Figure 35: North America Managed Learning Services Market Absolute Opportunity (US$ Bn), 2022 – 2031
Figure 36: Europe Managed Learning Services Market Absolute Opportunity (US$ Bn), 2022 – 2031
Figure 37: Asia Pacific Managed Learning Services Market Absolute Opportunity (US$ Bn), 2022 – 2031
Figure 38: Middle East & Africa Managed Learning Services Market Absolute Opportunity (US$ Bn), 2022 – 2031
Figure 39: South America Managed Learning Services Market Absolute Opportunity (US$ Bn), 2022 – 2031
Figure 40: North America Managed Learning Services Market Attractiveness Assessment, by Services
Figure 41: North America Managed Learning Services Market Attractiveness Assessment, by Enterprise Size
Figure 42: North America Managed Learning Services Market Attractiveness Assessment, by Delivery Mode
Figure 43: North America Managed Learning Services Market Attractiveness Assessment, by Industry Vertical
Figure 44: North America Managed Learning Services Market Attractiveness Assessment, by Region
Figure 45: North America Managed Learning Services Market Revenue (US$ Bn) Historic Trends, 2016 – 2021
Figure 46: North America Managed Learning Services Market Revenue Opportunity (US$ Bn) Historic Trends, 2016 – 2021
Figure 47: North America Managed Learning Services Market Value Share Analysis, by Enterprise Size, 2022
Figure 48: North America Managed Learning Services Market Value Share Analysis, by Enterprise Services, 2031
Figure 49: North America Managed Learning Services Market Absolute Opportunity (US$ Bn), by, SMEs 2022 – 2031
Figure 50: North America Managed Learning Services Market Absolute Opportunity (US$ Bn), by Large Enterprises, 2022 – 2031
Figure 51: North America Managed Learning Services Market Value Share Analysis, by Delivery Mode, 2022
Figure 52: North America Managed Learning Services Market Value Share Analysis, by Delivery Mode, 2031
Figure 53: North America Managed Learning Services Market Absolute Opportunity (US$ Bn), by, Online 2022 – 2031
Figure 54: North America Managed Learning Services Market Absolute Opportunity (US$ Bn), by, Offline, 2022 – 2031
Figure 55: North America Managed Learning Services Market Absolute Opportunity (US$ Bn), by Blended, 2022 – 2031
Figure 56: North America Managed Learning Services Market Value Share Analysis, by Industry Vertical, 2022
Figure 57: North America Managed Learning Services Market Value Share Analysis, by Industry Vertical, 2031
Figure 58: North America Managed Learning Services Market Absolute Opportunity (US$ Bn), by 2022 – 2031
Figure 59: North America Managed Learning Services Market Absolute Opportunity (US$ Bn), by, BFSI 2022 – 2031
Figure 60: North America Managed Learning Services Market Absolute Opportunity (US$ Bn), by IT & Telecom, 2022 – 2031
Figure 61: North America Managed Learning Services Market Absolute Opportunity (US$ Bn), by Manufacturing, 2022 – 2031
Figure 62: North America Managed Learning Services Market Absolute Opportunity (US$ Bn), by Healthcare, 2022 – 2031
Figure 63: North America Managed Learning Services Market Absolute Opportunity (US$ Bn), by Retail and Consumer Goods, 2022 – 2031
Figure 64: North America Managed Learning Services Market Absolute Opportunity (US$ Bn), by Others, 2022 – 2031
Figure 65: North America Managed Learning Services Market Value Share Analysis, by Country, 2022
Figure 66: North America Managed Learning Services Market Value Share Analysis, by Country, 2031
Figure 67: U.S. Managed Learning Services Market Opportunity Growth Analysis (US$ Bn) Forecast, 2022 – 2031
Figure 68: Canada Managed Learning Services Market Opportunity Growth Analysis (US$ Bn) Forecast, 2022 – 2031
Figure 69: Mexico Managed Learning Services Market Opportunity Growth Analysis (US$ Bn) Forecast, 2022 – 2031
Figure 70: Europe Managed Learning Services Market Attractiveness Assessment, by Services
Figure 71: Europe Managed Learning Services Market Attractiveness Assessment, by Enterprise Size
Figure 72: Europe Managed Learning Services Market Attractiveness Assessment, by Delivery Mode
Figure 73: Europe Managed Learning Services Market Attractiveness Assessment, by Industry Vertical
Figure 74: Europe Managed Learning Services Market Attractiveness Assessment, by Region
Figure 75: Europe Managed Learning Services Market Revenue (US$ Bn) Historic Trends, 2016 – 2021
Figure 76: Europe Managed Learning Services Market Revenue Opportunity (US$ Bn) Historic Trends, 2016 – 2021
Figure 77: Europe Managed Learning Services Market Value Share Analysis, by Enterprise Size, 2022
Figure 78: Europe Managed Learning Services Market Value Share Analysis, by Enterprise Services, 2031
Figure 79: Europe Managed Learning Services Market Absolute Opportunity (US$ Bn), by, SMEs 2022 – 2031
Figure 80: Europe Managed Learning Services Market Absolute Opportunity (US$ Bn), by Large Enterprises, 2022 – 2031
Figure 81: Europe Managed Learning Services Market Value Share Analysis, by Delivery Mode, 2022
Figure 82: Europe Managed Learning Services Market Value Share Analysis, by Delivery Mode, 2031
Figure 83: Europe Managed Learning Services Market Absolute Opportunity (US$ Bn), by, Online 2022 – 2031
Figure 84: Europe Managed Learning Services Market Absolute Opportunity (US$ Bn), by, Offline, 2022 – 2031
Figure 85: Europe Managed Learning Services Market Absolute Opportunity (US$ Bn), by Blended, 2022 – 2031
Figure 86: Europe Managed Learning Services Market Value Share Analysis, by Industry Vertical, 2022
Figure 87: Europe Managed Learning Services Market Value Share Analysis, by Industry Vertical, 2031
Figure 88: Europe Managed Learning Services Market Absolute Opportunity (US$ Bn), by 2022 – 2031
Figure 89: Europe Managed Learning Services Market Absolute Opportunity (US$ Bn), by, BFSI 2022 – 2031
Figure 90: Europe Managed Learning Services Market Absolute Opportunity (US$ Bn), by IT & Telecom, 2022 – 2031
Figure 91: Europe Managed Learning Services Market Absolute Opportunity (US$ Bn), by Manufacturing, 2022 – 2031
Figure 92: Europe Managed Learning Services Market Absolute Opportunity (US$ Bn), by Healthcare, 2022 – 2031
Figure 93: Europe Managed Learning Services Market Absolute Opportunity (US$ Bn), by Retail and Consumer Goods, 2022 – 2031
Figure 94: Europe Managed Learning Services Market Absolute Opportunity (US$ Bn), by Others, 2022 – 2031
Figure 95: Europe Managed Learning Services Market Value Share Analysis, by Country, 2022
Figure 96: Europe Managed Learning Services Market Value Share Analysis, by Country, 2031
Figure 97: Germany Managed Learning Services Market Opportunity Growth Analysis (US$ Bn) Forecast, 2022 – 2031
Figure 98: U.K. Managed Learning Services Market Opportunity Growth Analysis (US$ Bn) Forecast, 2022 – 2031
Figure 99: France Managed Learning Services Market Opportunity Growth Analysis (US$ Bn) Forecast, 2022 – 2031
Figure 100: Italy Managed Learning Services Market Opportunity Growth Analysis (US$ Bn) Forecast, 2022 – 2031
Figure 101: Spain Managed Learning Services Market Opportunity Growth Analysis (US$ Bn) Forecast, 2022 – 2031
Figure 102: Asia Pacific Managed Learning Services Market Attractiveness Assessment, by Services
Figure 103: Asia Pacific Managed Learning Services Market Attractiveness Assessment, by Enterprise Size
Figure 104: Asia Pacific Managed Learning Services Market Attractiveness Assessment, by Delivery Mode
Figure 105: Asia Pacific Managed Learning Services Market Attractiveness Assessment, by Industry Vertical
Figure 106: Asia Pacific Managed Learning Services Market Attractiveness Assessment, by Region
Figure 107: Asia Pacific Managed Learning Services Market Revenue (US$ Bn) Historic Trends, 2016 – 2021
Figure 108: Asia Pacific Managed Learning Services Market Revenue Opportunity (US$ Bn) Historic Trends, 2016 – 2021
Figure 109: Asia Pacific Managed Learning Services Market Value Share Analysis, by Enterprise Size, 2022
Figure 110: Asia Pacific Managed Learning Services Market Value Share Analysis, by Enterprise Services, 2031
Figure 111: Asia Pacific Managed Learning Services Market Absolute Opportunity (US$ Bn), by, SMEs 2022 – 2031
Figure 112: Asia Pacific Managed Learning Services Market Absolute Opportunity (US$ Bn), by Large Enterprises, 2022 – 2031
Figure 113: Asia Pacific Managed Learning Services Market Value Share Analysis, by Delivery Mode, 2022
Figure 114: Asia Pacific Managed Learning Services Market Value Share Analysis, by Delivery Mode, 2031
Figure 115: Asia Pacific Managed Learning Services Market Absolute Opportunity (US$ Bn), by, Online 2022 – 2031
Figure 116: Asia Pacific Managed Learning Services Market Absolute Opportunity (US$ Bn), by, Offline, 2022 – 2031
Figure 117: Asia Pacific Managed Learning Services Market Absolute Opportunity (US$ Bn), by Blended, 2022 – 2031
Figure 118: Asia Pacific Managed Learning Services Market Value Share Analysis, by Industry Vertical, 2022
Figure 119: Asia Pacific Managed Learning Services Market Value Share Analysis, by Industry Vertical, 2031
Figure 120: Asia Pacific Managed Learning Services Market Absolute Opportunity (US$ Bn), by 2022 – 2031
Figure 121: Asia Pacific Managed Learning Services Market Absolute Opportunity (US$ Bn), by, BFSI 2022 – 2031
Figure 122: Asia Pacific Managed Learning Services Market Absolute Opportunity (US$ Bn), by IT & Telecom, 2022 – 2031
Figure 123: Asia Pacific Managed Learning Services Market Absolute Opportunity (US$ Bn), by Manufacturing, 2022 – 2031
Figure 124: Asia Pacific Managed Learning Services Market Absolute Opportunity (US$ Bn), by Healthcare, 2022 – 2031
Figure 125: Asia Pacific Managed Learning Services Market Absolute Opportunity (US$ Bn), by Retail and Consumer Goods, 2022 – 2031
Figure 126: Asia Pacific Managed Learning Services Market Absolute Opportunity (US$ Bn), by Others, 2022 – 2031
Figure 127: Asia Pacific Managed Learning Services Market Revenue Opportunity Share, by Country
Figure 128: China Managed Learning Services Market Opportunity Growth Analysis (US$ Bn) Forecast, 2022 – 2031
Figure 129: India Managed Learning Services Market Opportunity Growth Analysis (US$ Bn) Forecast, 2022 – 2031
Figure 130: Japan Managed Learning Services Market Opportunity Growth Analysis (US$ Bn) Forecast, 2022 – 2031
Figure 131: ASEAN Managed Learning Services Market Opportunity Growth Analysis (US$ Bn) Forecast, 2022 – 2031
Figure 132: Middle East & Africa Managed Learning Services Market Attractiveness Assessment, by Services
Figure 133: Middle East & Africa Managed Learning Services Market Attractiveness Assessment, by Enterprise Size
Figure 134: Middle East & Africa Managed Learning Services Market Attractiveness Assessment, by Delivery Mode
Figure 135: Middle East & Africa Managed Learning Services Market Attractiveness Assessment, by Industry Vertical
Figure 136: Middle East & Africa Managed Learning Services Market Attractiveness Assessment, by Region
Figure 137: Middle East & Africa Managed Learning Services Market Revenue (US$ Bn) Historic Trends, 2016 – 2021
Figure 138: Middle East & Africa Managed Learning Services Market Revenue Opportunity (US$ Bn) Historic Trends, 2016 – 2021
Figure 139: Middle East & Africa Managed Learning Services Market Value Share Analysis, by Enterprise Size, 2022
Figure 140: Middle East & Africa Managed Learning Services Market Value Share Analysis, by Enterprise Services, 2031
Figure 141: Middle East & Africa Managed Learning Services Market Absolute Opportunity (US$ Bn), by, SMEs 2022 – 2031
Figure 142: Middle East & Africa Managed Learning Services Market Absolute Opportunity (US$ Bn), by Large Enterprises, 2022 – 2031
Figure 143: Middle East & Africa Managed Learning Services Market Value Share Analysis, by Delivery Mode, 2022
Figure 144: Middle East & Africa Managed Learning Services Market Value Share Analysis, by Delivery Mode, 2031
Figure 145: Global Managed Learning Services Market Absolute Opportunity (US$ Bn), by, Online 2022 – 2031
Figure 146: Global Managed Learning Services Market Absolute Opportunity (US$ Bn), by, Offline, 2022 – 2031
Figure 147: Global Managed Learning Services Market Absolute Opportunity (US$ Bn), by Blended, 2022 – 2031
Figure 148: Global Managed Learning Services Market Value Share Analysis, by Industry Vertical, 2022
Figure 149: Global Managed Learning Services Market Value Share Analysis, by Industry Vertical, 2031
Figure 150: Global Managed Learning Services Market Absolute Opportunity (US$ Bn), by 2022 – 2031
Figure 151: Global Managed Learning Services Market Absolute Opportunity (US$ Bn), by, BFSI 2022 – 2031
Figure 152: Global Managed Learning Services Market Absolute Opportunity (US$ Bn), by IT & Telecom, 2022 – 2031
Figure 153: Global Managed Learning Services Market Absolute Opportunity (US$ Bn), by Manufacturing, 2022 – 2031
Figure 154: Global Managed Learning Services Market Absolute Opportunity (US$ Bn), by Healthcare, 2022 – 2031
Figure 155: Global Managed Learning Services Market Absolute Opportunity (US$ Bn), by Retail and Consumer Goods, 2022 – 2031
Figure 156: Global Managed Learning Services Market Absolute Opportunity (US$ Bn), by Others, 2022 – 2031
Figure 157: Middle East & Africa Managed Learning Services Market Value Share Analysis, by Country, 2022
Figure 158: Middle East & Africa Managed Learning Services Market Value Share Analysis, by Country, 2031
Figure 159: Saudi Arabia Managed Learning Services Market Opportunity Growth Analysis (US$ Bn) Forecast, 2022 – 2031
Figure 160: United Arab Emirates Managed Learning Services Market Opportunity Growth Analysis (US$ Bn) Forecast, 2022 – 2031
Figure 161: South Africa Managed Learning Services Market Opportunity Growth Analysis (US$ Bn) Forecast, 2022 – 2031
Figure 162: South America Managed Learning Services Market Attractiveness Assessment, by Services
Figure 163: South America Managed Learning Services Market Attractiveness Assessment, by Enterprise Size
Figure 164: South America Managed Learning Services Market Attractiveness Assessment, by Delivery Mode
Figure 165: South America Managed Learning Services Market Attractiveness Assessment, by Industry Vertical
Figure 166: South America Managed Learning Services Market Attractiveness Assessment, by Region
Figure 167: South America Managed Learning Services Market Revenue (US$ Bn) Historic Trends, 2016 – 2021
Figure 168: South America Managed Learning Services Market Revenue Opportunity (US$ Bn) Historic Trends, 2016 – 2021
Figure 169: South America Managed Learning Services Market Value Share Analysis, by Enterprise Size, 2022
Figure 170: South America Managed Learning Services Market Value Share Analysis, by Enterprise Services, 2031
Figure 171: South America Managed Learning Services Market Absolute Opportunity (US$ Bn), by, SMEs 2022 – 2031
Figure 172: South America Managed Learning Services Market Absolute Opportunity (US$ Bn), by Large Enterprises, 2022 – 2031
Figure 173: South America Managed Learning Services Market Value Share Analysis, by Delivery Mode, 2022
Figure 174: South America Managed Learning Services Market Value Share Analysis, by Delivery Mode, 2031
Figure 175: South America Managed Learning Services Market Absolute Opportunity (US$ Bn), by, Online 2022 – 2031
Figure 176: South America Managed Learning Services Market Absolute Opportunity (US$ Bn), by, Offline, 2022 – 2031
Figure 177: South America Managed Learning Services Market Absolute Opportunity (US$ Bn), by Blended, 2022 – 2031
Figure 178: South America Managed Learning Services Market Value Share Analysis, by Industry Vertical, 2022
Figure 179: South America Managed Learning Services Market Value Share Analysis, by Industry Vertical, 2031
Figure 180: South America Managed Learning Services Market Absolute Opportunity (US$ Bn), by 2022 – 2031
Figure 181: South America Managed Learning Services Market Absolute Opportunity (US$ Bn), by, BFSI 2022 – 2031
Figure 182: South America Managed Learning Services Market Absolute Opportunity (US$ Bn), by IT & Telecom, 2022 – 2031
Figure 183: South America Managed Learning Services Market Absolute Opportunity (US$ Bn), by Manufacturing, 2022 – 2031
Figure 184: South America Managed Learning Services Market Absolute Opportunity (US$ Bn), by Healthcare, 2022 – 2031
Figure 185: South America Managed Learning Services Market Absolute Opportunity (US$ Bn), by Retail and Consumer Goods, 2022 – 2031
Figure 186: South America Managed Learning Services Market Absolute Opportunity (US$ Bn), by Others, 2022 – 2031
Figure 187: South America Managed Learning Services Market Value Share Analysis, by Country, 2022
Figure 188: South America Managed Learning Services Market Value Share Analysis, by Country, 2031
Figure 189: Brazil Managed Learning Services Market Opportunity Growth Analysis (US$ Bn) Forecast, 2022 – 2031
Figure 190: Argentina Managed Learning Services Market Opportunity Growth Analysis (US$ Bn) Forecast, 2022 – 2031
Copyright © Transparency Market Research, Inc. All Rights reserved
Trust Online

Managed Learning Services Market