
Reports
Reports
The growing number of health-conscious consumers has encouraged companies in the malted barley flour market to develop products with clean label malted ingredients. For instance, Muntons - a supplier of malted ingredients for the worldwide F&B industry, manufactures high-quality clean-label malt ingredients targeted at health-conscious consumers. This trend has bolstered the output of malted barley flour market which is expected to reach ~7,382,500 metric tons by the end of 2029.
The brewing industry is one of the key focus points for companies in the malted barley flour market, owing to the rapidly growing craft brewing movement worldwide. Companies are investing for the development of new production facilities that can specially focus on brewing applications. They are making bold investments to incorporate test breweries, test kitchens, and conference facilities to help stakeholders have an interactive approach toward innovations in craft brewing. These investments have helped market players to closely identify the needs of their customers.
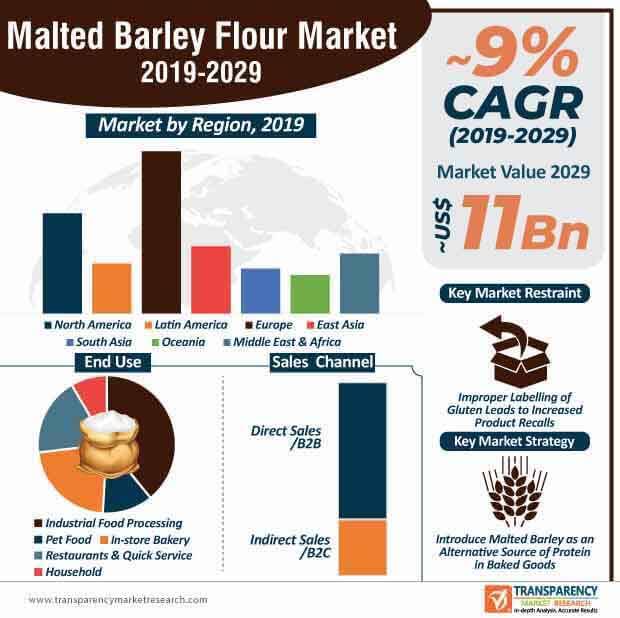
The Europe malted barley flour market is flourishing due to the emergence of new production facilities of leading market players. As such, the malted barley flour market in Europe is projected for aggressive growth. The region is estimated to lead the malted barley flour market during the forecast period.
The trend of home beer making has driven investments in state-of-the-art product development and innovation facilities. Companies in Europe are strengthening their supply chains by developing malted barley flour products, kibbles, flakes, and flour blends to meet consumer requirements. They are inviting potential customers to book the facilities in order to conduct brainstorming sessions with in-house bakers, head brewers, and food technologists to gain insights on changing consumer preferences. On the other hand, companies are introducing malted barley in baked goods as an alternative source of protein.
Spent grains are gaining popularity due to their low-sugar/starch content and are high on fiber and protein. However, malted barley flour has small amount of fiber as compared to spent grains. Hence, companies in the malted barley flour market are increasing awareness about the enzymatic activity of the flour in the production of baked goods that provides desired results to end users. Thus, manufacturers are creating revenue streams by increasing the production of sweeter bread products, doughnuts, cakes, and the likes. This trend has led to exponential growth of the malted barley flour market, which is anticipated to progress at a healthy CAGR of ~9% during the forecast period.
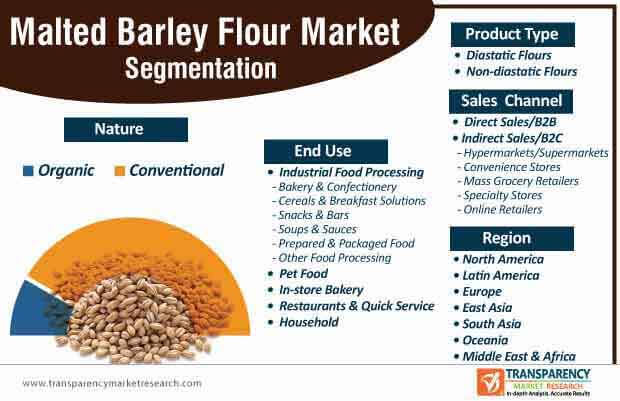
Companies are creating stable business streams by tapping opportunities in bakery products segment. As such, bakery & confectionary sub-segment is projected to lead the in industrial food processing segment. On the other hand, spent grains are gaining popularity for their high-fiber attributes, contributing toward reduced ecological footprint.
Diverse Segments such as Pet Food Create Incremental Opportunities for Companies
The malted barley flour market is expected to reach the global revenue of ~US$ 11 Bn by the end of 2029. However, improper labeling of gluten-containing malted barley flour has led to incidences of product recalls. For instance, Premier Foods-a British food company, announced product recalls for Hovis Granary Bread Flour, since it contained gluten and was not mentioned on the label. This issue is likely to slow down market growth. Hence, manufacturers in the malted barley flour market are adopting ‘full-ingredient’ labels to avoid the issue of misleading labeling and prevent incidence of product recalls.
Apart from bakery & confectionary, producers are leveraging incremental opportunities in diverse segments such as pet food and breakfast cereals. Lately, pet owners are growing increasingly aware about gastrointestinal and joint problems of animals. In order to avoid such health issues in pets, pet parents are opting for products with malted barley flour to maintain optimum health of their animals.
Analysts’ Viewpoint
Continuous growth of the malted barley flour market largely contributes to the number of fragmented market players, which account for ~55-60% of the market stake. This has enabled innovations in craft brewery. Moreover, high prevalence of millennial population has contributed to the business of craft brewery with the growth of HoReCa, especially in developing economies of East and South Asia.
Bakery & confectionary is one of the key focus segments of producers. However, improper labelling of gluten in malted barley flour products has led to issues of product recalls. Hence, companies should adopt ‘full-ingredient’ labeling to prevent product recalls. Companies should explore untapped opportunities in Latin America and Middle East & Africa, since the malted barley flour market is predicted for exponential growth during the forecast period.
Malted Barley Flour: Market Frontrunners
Malted Barley Flour Market: Trends
Health Benefits Associated with Malted Barley Flour to Augment Sales
Malted Barley Flour Market: Strategies
Target Region for Market
Malted Barley Flour Market: Players
Malted Barley Flour Market is projected to reach US$ 11 Bn by the end of 2029
Malted Barley Flour Market is expected to grow at a CAGR of 9% during 2019 – 2029
Rising Preference for Malted Barley Flour by Health-conscious Consumers to Boost Growth Opportunities
Europe is a more attractive region for vendors in the Malted Barley Flour Market
Key vendors in the Malted Barley Flour Market are Ardent Mills, LLC, IREKS GmbH, Briess Malt & Ingredients Co., Munari F.lli s.p.a, Maltexco S.A, etc
1. Executive Summary
1.1. Global Market Outlook
1.2. Demand-side Trends
1.3. Supply-side Trends
1.4. Technology Roadmap Analysis
1.5. Analysis and Recommendations
2. Market Overview
2.1. Market Coverage / Taxonomy
2.2. Market Definition / Scope / Limitations
3. Key Market Trends
3.1. Key Trends Impacting the Market
3.2. Product Innovation / Development Trends
4. Key Success Factors
4.1. Product Production and Processing Overview
4.2. Product Formulation for Unique End Use Applications
4.3. Quality Certifications and Claims Impact Analysis
5. Global Malted Barley Flour Market Demand Analysis 2014-2018 and Forecast, 2019-2029
5.1. Historical Market Volume (Metric Tons) Analysis, 2014-2018
5.2. Current and Future Market Volume (Metric Tons) Projections, 2019-2029
5.3. Y-o-Y Growth Trend Analysis
6. Global Malted Barley Flour Market - Pricing Analysis
6.1. Regional Pricing Analysis (US$/Metric Tons) By Product
6.2. Pricing Break-up
6.2.1. Manufacturer Level Pricing
6.2.2. Distributor Level Pricing
6.2.3. Retail Pricing
6.3. Global Average Pricing Analysis Benchmark
7. Global Malted Barley Flour Market Demand (Size in US$ Mn) Analysis 2014-2018 and Forecast, 2019-2029
7.1. Historical Market Value (US$ Mn) Analysis, 2014-2018
7.2. Current and Future Market Value (US$ Mn) Projections, 2019-2029
7.2.1. Y-o-Y Growth Trend Analysis
7.2.2. Absolute $ Opportunity Analysis
8. Market Background
8.1. Barley Production Overview
8.1.1. Total Harvested Area (Hectares), by Country/Region
8.1.2. Average Yield/Hectare, by Region/Country
8.2. Nutritional Composition of Malted Barley Flour
8.3. Production and Processing Technology Overview
8.4. Policy Developments and Regulatory Scenario
8.5. Supply/Demand and Trade Scenario
8.6. Macro-Economic Factors
8.6.1. Global GDP Growth Outlook
8.6.2. Global Industry Value Added
8.6.3. Personal Consumption Expenditures
8.6.4. Modern Trade Penetration
8.6.5. Consumer Price Indices
8.7. Forecast Factors - Relevance & Impact
8.7.1. Area Under Cultivation Outlook
8.7.2. Seasonality and Yield Analysis
8.7.3. Trade Tariffs and Regulation Outlook
8.7.4. Production/Processing Capacity Growth
8.7.5. Global Food & Beverage Industry Outlook
8.7.6. Global Urbanization Growth Outlook
8.8. Value Chain Analysis
8.8.1. Raw Material Suppliers
8.8.2. Product Manufacturers
8.8.3. Distributors/Suppliers/Wholesalers
8.8.4. Industrial Food Processors
8.8.5. Bakeries & Foodservice
8.8.6. Other End Use Segments
8.9. Market Dynamics
8.9.1. Drivers
8.9.2. Restraints
8.9.3. Opportunity
9. Global Malted Barley Flour Market Analysis 2014-2018 and Forecast 2019-2029, By Nature
9.1. Introduction / Key Findings
9.2. Historical Market Size (US$ Mn) and Volume Analysis By Nature, 2014 - 2018
9.3. Current and Future Market Size (US$ Mn) and Volume Analysis and Forecast By Nature, 2019 - 2029
9.3.1. Organic
9.3.2. Conventional
9.4. Market Attractiveness Analysis By Nature
10. Global Malted Barley Flour Market Analysis 2014-2018 and Forecast 2019-2029, By Product Type
10.1. Introduction / Key Findings
10.2. Historical Market Size (US$ Mn) and Volume Analysis By Product Type, 2014 - 2018
10.3. Current and Future Market Size (US$ Mn) and Volume Analysis and Forecast By Product Type, 2019 - 2029
10.3.1. Diastatic Flours
10.3.2. Non-diastatic Flours
10.4. Market Attractiveness Analysis By Product Type
11. Global Malted Barley Flour Market Analysis 2014-2018 and Forecast 2019-2029, By Sales Channel
11.1. Introduction / Key Findings
11.2. Historical Market Size (US$ Mn) and Volume Analysis By Sales Channel, 2014 - 2018
11.3. Current and Future Market Size (US$ Mn) and Volume Analysis and Forecast By Sales Channel, 2019 - 2029
11.3.1. Direct Sales/B2B
11.3.2. Indirect Sales/B2C
11.3.2.1. Hypermarkets/Supermarkets
11.3.2.2. Convenience Stores
11.3.2.3. Mass Grocery Retailers
11.3.2.4. Specialty Stores
11.3.2.5. Online Retailers
11.4. Market Attractiveness Analysis By Sales Channel
12. Global Malted Barley Flour Market Analysis 2014-2018 and Forecast 2019-2029, By End Use
12.1. Introduction / Key Findings
12.2. Historical Market Size (US$ Mn) and Volume Analysis By End Use, 2014 - 2018
12.3. Current and Future Market Size (US$ Mn) and Volume Analysis and Forecast By End Use, 2019 - 2029
12.3.1. Industrial Food Processing
12.3.1.1. Bakery & Confectionery
12.3.1.1.1. Breads & Flatbreads
12.3.1.1.2. Cakes & Pies
12.3.1.1.3. Bagels & Rolls
12.3.1.1.4. Biscuits, Cookies & Crackers
12.3.1.1.5. Batters, Breadings & Mixes
12.3.1.1.6. Other Baked Goods
12.3.1.2. Cereals & Breakfast Solutions
12.3.1.3. Snacks & Bars
12.3.1.4. Soups & Sauces
12.3.1.5. Prepared & Packaged Food
12.3.1.6. Other Food Processing
12.3.2. Pet Food
12.3.3. In-store Bakery
12.3.4. Restaurants & Quick Service
12.3.5. Household
12.4. Market Attractiveness Analysis By End Use
13. Global Malted Barley Flour Market Analysis 2014-2018 and Forecast 2019-2029, By Region
13.1. Introduction
13.2. Historical Market Size (US$ Mn) and Volume Analysis By Region, 2014 - 2018
13.3. Current Market Size (US$ Mn) and Volume Analysis and Forecast By Region, 2019 - 2029
13.3.1. North America
13.3.2. Latin America
13.3.3. Europe
13.3.4. East Asia
13.3.5. South Asia
13.3.6. Oceania
13.3.7. Middle East and Africa
13.4. Market Attractiveness Analysis By Region
14. North America Malted Barley Flour Market Analysis 2014-2018 and Forecast 2019-2029
14.1. Introduction
14.2. Pricing Analysis
14.3. Historical Market Size (US$ Mn) and Volume Trend Analysis By Market Taxonomy, 2014 - 2018
14.4. Market Size (US$ Mn) and Volume Forecast By Market Taxonomy, 2019 - 2029
14.4.1. By Country
14.4.1.1. U.S.
14.4.1.2. Canada
14.4.2. By Nature
14.4.3. By Product Type
14.4.4. By Sales Channel
14.4.5. By End Use
14.5. Market Attractiveness Analysis
14.5.1. By Country
14.5.2. By Nature
14.5.3. By Product Type
14.5.4. By Sales Channel
14.5.5. By End Use
14.6. Market Trends
14.7. Key Market Participants - Intensity Mapping
14.8. Drivers and Restraints - Impact Analysis
15. Latin America Malted Barley Flour Market Analysis 2014-2018 and Forecast 2019-2029
15.1. Introduction
15.2. Pricing Analysis
15.3. Historical Market Size (US$ Mn) and Volume Trend Analysis By Market Taxonomy, 2014 - 2018
15.4. Market Size (US$ Mn) and Volume Forecast By Market Taxonomy, 2019 - 2029
15.4.1. By Country
15.4.1.1. Brazil
15.4.1.2. Mexico
15.4.1.3. Argentina
15.4.1.4. Rest of Latin America
15.4.2. By Nature
15.4.3. By Product Type
15.4.4. By Sales Channel
15.4.5. By End Use
15.5. Market Attractiveness Analysis
15.5.1. By Country
15.5.2. By Nature
15.5.3. By Product Type
15.5.4. By Sales Channel
15.5.5. By End Use
15.6. Market Trends
15.7. Key Market Participants - Intensity Mapping
15.8. Drivers and Restraints - Impact Analysis
16. Europe Malted Barley Flour Market Analysis 2014-2018 and Forecast 2019-2029
16.1. Introduction
16.2. Pricing Analysis
16.3. Historical Market Size (US$ Mn) and Volume Trend Analysis By Market Taxonomy, 2014 - 2018
16.4. Market Size (US$ Mn) and Volume Forecast By Market Taxonomy, 2019 - 2029
16.4.1. By Country
16.4.1.1. Germany
16.4.1.2. Italy
16.4.1.3. France
16.4.1.4. U.K.
16.4.1.5. Spain
16.4.1.6. BENELUX
16.4.1.7. Russia
16.4.1.8. Poland
16.4.1.9. Rest of Europe
16.4.2. By Nature
16.4.3. By Product Type
16.4.4. By Sales Channel
16.4.5. By End Use
16.5. Market Attractiveness Analysis
16.5.1. By Country
16.5.2. By Nature
16.5.3. By Product Type
16.5.4. By Sales Channel
16.5.5. By End Use
16.6. Market Trends
16.7. Key Market Participants - Intensity Mapping
16.8. Drivers and Restraints - Impact Analysis
17. East Asia Malted Barley Flour Market Analysis 2014-2018 and Forecast 2019-2029
17.1. Introduction
17.2. Pricing Analysis
17.3. Historical Market Size (US$ Mn) and Volume Trend Analysis By Market Taxonomy, 2014 - 2018
17.4. Market Size (US$ Mn) and Volume Forecast By Market Taxonomy, 2019 - 2029
17.4.1. By Country
17.4.1.1. China
17.4.1.2. Japan
17.4.1.3. South Korea
17.4.2. By Nature
17.4.3. By Product Type
17.4.4. By Sales Channel
17.4.5. By End Use
17.5. Market Attractiveness Analysis
17.5.1. By Country
17.5.2. By Nature
17.5.3. By Product Type
17.5.4. By Sales Channel
17.5.5. By End Use
17.6. Market Trends
17.7. Key Market Participants - Intensity Mapping
17.8. Drivers and Restraints - Impact Analysis
18. South Asia Malted Barley Flour Market Analysis 2014-2018 and Forecast 2019-2029
18.1. Introduction
18.2. Pricing Analysis
18.3. Historical Market Size (US$ Mn) and Volume Trend Analysis By Market Taxonomy, 2014 - 2018
18.4. Market Size (US$ Mn) and Volume Forecast By Market Taxonomy, 2019 - 2029
18.4.1. By Country
18.4.1.1. India
18.4.1.2. Thailand
18.4.1.3. Indonesia
18.4.1.4. Malaysia
18.4.1.5. Singapore
18.4.1.6. Rest of South Asia
18.4.2. By Nature
18.4.3. By Product Type
18.4.4. By Sales Channel
18.4.5. By End Use
18.5. Market Attractiveness Analysis
18.5.1. By Country
18.5.2. By Nature
18.5.3. By Product Type
18.5.4. By Sales Channel
18.5.5. By End Use
18.6. Market Trends
18.7. Key Market Participants - Intensity Mapping
18.8. Drivers and Restraints - Impact Analysis
19. Oceania Malted Barley Flour Market Analysis 2014-2018 and Forecast 2019-2029
19.1. Introduction
19.2. Pricing Analysis
19.3. Historical Market Size (US$ Mn) and Volume Trend Analysis By Market Taxonomy, 2014 - 2018
19.4. Market Size (US$ Mn) and Volume Forecast By Market Taxonomy, 2019 - 2029
19.4.1. By Country
19.4.1.1. Australia
19.4.1.2. New Zealand
19.4.2. By Nature
19.4.3. By Product Type
19.4.4. By Sales Channel
19.4.5. By End Use
19.5. Market Attractiveness Analysis
19.5.1. By Country
19.5.2. By Nature
19.5.3. By Product Type
19.5.4. By Sales Channel
19.5.5. By End Use
19.6. Market Trends
19.7. Key Market Participants - Intensity Mapping
19.8. Drivers and Restraints - Impact Analysis
20. Middle East and Africa Malted Barley Flour Market Analysis 2014-2018 and Forecast 2019-2029
20.1. Introduction
20.2. Pricing Analysis
20.3. Historical Market Size (US$ Mn) and Volume Trend Analysis By Market Taxonomy, 2014 - 2018
20.4. Market Size (US$ Mn) and Volume Forecast By Market Taxonomy, 2019 - 2029
20.4.1. By Country
20.4.1.1. GCC Countries
20.4.1.2. South Africa
20.4.1.3. Turkey
20.4.1.4. Rest of Middle East and Africa
20.4.2. By Nature
20.4.3. By Product Type
20.4.4. By Sales Channel
20.4.5. By End Use
20.5. Market Attractiveness Analysis
20.5.1. By Country
20.5.2. By Nature
20.5.3. By Product Type
20.5.4. By Sales Channel
20.5.5. By End Use
20.6. Market Trends
20.7. Key Market Participants - Intensity Mapping
20.8. Drivers and Restraints - Impact Analysis
21. Market Structure Analysis
21.1. Market Analysis by Tier of Companies
21.2. Market Share Analysis of Top Players
21.3. Market Presence Analysis
21.3.1. By Regional Footprint of Players
21.3.2. Product Footprint by Players
21.3.3. Channel Footprint by Players
22. Competition Analysis
22.1. Competition Dashboard
22.2. Pricing Analysis by Competition
22.3. Competition Benchmarking
22.4. Competition Deep Dive (Tentative List)
22.4.1. AIT Ingredients (Groupe Soufflet)
22.4.1.1. Overview
22.4.1.2. Product Portfolio
22.4.1.3. Profitability by Market Segments (Product/Region)
22.4.1.4. Sales Footprint
22.4.1.5. Strategy Overview
22.4.1.5.1. Marketing Strategy
22.4.1.5.2. Product Strategy
22.4.2. Ardent Mills, LLC (JV of ConAgra Foods, Cargill and CHS)
22.4.2.1. Overview
22.4.2.2. Product Portfolio
22.4.2.3. Profitability by Market Segments (Product/Region)
22.4.2.4. Sales Footprint
22.4.2.5. Strategy Overview
22.4.2.5.1. Marketing Strategy
22.4.2.5.2. Product Strategy
22.4.3. Briess Malt & Ingredients Co.
22.4.3.1. Overview
22.4.3.2. Product Portfolio
22.4.3.3. Profitability by Market Segments (Product/Region)
22.4.3.4. Sales Footprint
22.4.3.5. Strategy Overview
22.4.3.5.1. Marketing Strategy
22.4.3.5.2. Product Strategy
22.4.4. Cereal & Malt Extract (Pty) Ltd
22.4.4.1. Overview
22.4.4.2. Product Portfolio
22.4.4.3. Profitability by Market Segments (Product/Region)
22.4.4.4. Sales Footprint
22.4.4.5. Strategy Overview
22.4.4.5.1. Marketing Strategy
22.4.4.5.2. Product Strategy
22.4.5. Edme Limited
22.4.5.1. Overview
22.4.5.2. Product Portfolio
22.4.5.3. Profitability by Market Segments (Product/Region)
22.4.5.4. Sales Footprint
22.4.5.5. Strategy Overview
22.4.5.5.1. Marketing Strategy
22.4.5.5.2. Product Strategy
22.4.6. Estonian Malt OÜ
22.4.6.1. Overview
22.4.6.2. Product Portfolio
22.4.6.3. Profitability by Market Segments (Product/Region)
22.4.6.4. Sales Footprint
22.4.6.5. Strategy Overview
22.4.6.5.1. Marketing Strategy
22.4.6.5.2. Product Strategy
22.4.7. Galletti S.n.c.
22.4.7.1. Overview
22.4.7.2. Product Portfolio
22.4.7.3. Profitability by Market Segments (Product/Region)
22.4.7.4. Sales Footprint
22.4.7.5. Strategy Overview
22.4.7.5.1. Marketing Strategy
22.4.7.5.2. Product Strategy
22.4.8. Imperial Malts Ltd.
22.4.8.1. Overview
22.4.8.2. Product Portfolio
22.4.8.3. Profitability by Market Segments (Product/Region)
22.4.8.4. Sales Footprint
22.4.8.5. Strategy Overview
22.4.8.5.1. Marketing Strategy
22.4.8.5.2. Product Strategy
22.4.9. IREKS GmbH
22.4.9.1. Overview
22.4.9.2. Product Portfolio
22.4.9.3. Profitability by Market Segments (Product/Region)
22.4.9.4. Sales Footprint
22.4.9.5. Strategy Overview
22.4.9.5.1. Marketing Strategy
22.4.9.5.2. Product Strategy
22.4.10. King Arthur Flour
22.4.10.1. Overview
22.4.10.2. Product Portfolio
22.4.10.3. Profitability by Market Segments (Product/Region)
22.4.10.4. Sales Footprint
22.4.10.5. Strategy Overview
22.4.10.5.1. Marketing Strategy
22.4.10.5.2. Product Strategy
22.4.11. The Malt Company (India) Pvt Ltd.
22.4.11.1. Overview
22.4.11.2. Product Portfolio
22.4.11.3. Profitability by Market Segments (Product/Region)
22.4.11.4. Sales Footprint
22.4.11.5. Strategy Overview
22.4.11.5.1. Marketing Strategy
22.4.11.5.2. Product Strategy
22.4.12. Maltexco S.A
22.4.12.1. Overview
22.4.12.2. Product Portfolio
22.4.12.3. Profitability by Market Segments (Product/Region)
22.4.12.4. Sales Footprint
22.4.12.5. Strategy Overview
22.4.12.5.1. Marketing Strategy
22.4.12.5.2. Product Strategy
22.4.13. Munari F.lli s.p.a.
22.4.13.1. Overview
22.4.13.2. Product Portfolio
22.4.13.3. Profitability by Market Segments (Product/Region)
22.4.13.4. Sales Footprint
22.4.13.5. Strategy Overview
22.4.13.5.1. Marketing Strategy
22.4.13.5.2. Product Strategy
22.4.14. Muntons plc
22.4.14.1. Overview
22.4.14.2. Product Portfolio
22.4.14.3. Profitability by Market Segments (Product/Region)
22.4.14.4. Sales Footprint
22.4.14.5. Strategy Overview
22.4.14.5.1. Marketing Strategy
22.4.14.5.2. Product Strategy
22.4.15. PureMalt Products Ltd.
22.4.15.1. Overview
22.4.15.2. Product Portfolio
22.4.15.3. Profitability by Market Segments (Product/Region)
22.4.15.4. Sales Footprint
22.4.15.5. Strategy Overview
22.4.15.5.1. Marketing Strategy
22.4.15.5.2. Product Strategy
23. Assumptions and Acronyms Used
24. Research Methodology
List of Table
Table 01: Global Malted Barley Flour Market Historical Value (US$ Mn) Analysis by Nature, 2014-2018
Table 02: Global Malted Barley Flour Market Historical Volume (MT) Analysis by Nature, 2014-2018
Table 03: Global Malted Barley Flour Market forecast Value (US$ Mn) Analysis by Nature, 2019-2029
Table 04: Global Malted Barley Flour Market Forecast Volume (MT) Analysis by Nature, 2019-2029
Table 05: Global Malted Barley Flour Market Historical Value (US$ Mn) Analysis by Product Type, 2014-2018
Table 06: Global Malted Barley Flour Market Historical Volume (MT) Analysis by Product Type, 2014-2018
Table 07: Global Malted Barley Flour Market Forecast Value (US$ Mn) Analysis by Product Type, 2019-2029
Table 08: Global Malted Barley Flour Market Forecast Volume (MT) Analysis by Product Type, 2019-2029
Table 09: Global Malted Barley Flour Market Historical Value (US$ Mn) Analysis by Sales Channel, 2014-2018
Table 10: Global Malted Barley Flour Market Historical Volume (MT) Analysis by Sales Channel, 2014-2018
Table 11: Global Malted Barley Flour Market Forecast Value (US$ Mn) Analysis by Sales Channel, 2019-2029
Table 12: Global Malted Barley Flour Market Forecast Volume (MT) Analysis by Sales Channel, 2019-2029
Table 13: Global Malted Barley Flour Market Historical Value (US$ Mn) Analysis by End-Use, 2014-2018
Table 14: Global Malted Barley Flour Market Historical Volume (MT) Analysis by End-Use, 2014-2018
Table 15: Global Malted Barley Flour Market Forecast Value (US$ Mn) Analysis by End-Use, 2019-2029
Table 16: Global Malted Barley Flour Market Forecast Volume (MT) Analysis by End-Use, 2019-2029
Table 17: Global Malted Barley Flour Market Historical Value (US$ Mn) Analysis by Region, 2014-2018
Table 18: Global Malted Barley Flour Market Historical Volume (MT) Analysis by Region, 2014-2018
Table 19: Global Malted Barley Flour Market Forecast Value (US$ Mn) Analysis by Region, 2019-2029
Table 20: Global Malted Barley Flour Market Forecast Volume (MT) Analysis by Region, 2019-2029
Table 21: North America Malted Barley Flour Market Historical Value (US$ Mn) Analysis by Nature, 2014-2018
Table 22: North America Malted Barley Flour Market Historical Volume (MT) Analysis by Nature, 2014-2018
Table 23: North America Malted Barley Flour Market forecast Value (US$ Mn) Analysis by Nature, 2019-2029
Table 24: North America Malted Barley Flour Market Forecast Volume (MT) Analysis by Nature, 2019-2029
Table 25: North America Malted Barley Flour Market Historical Value (US$ Mn) Analysis by Product Type, 2014-2018
Table 26: North America Malted Barley Flour Market Historical Volume (MT) Analysis by Product Type, 2014-2018
Table 27: North America Malted Barley Flour Market Forecast Value (US$ Mn) Analysis by Product Type, 2019-2029
Table 28: North America Malted Barley Flour Market Forecast Volume (MT) Analysis by Product Type, 2019-2029
Table 29: North America Malted Barley Flour Market Historical Value (US$ Mn) Analysis by Sales Channel, 2014-2018
Table 30: North America Malted Barley Flour Market Historical Volume (MT) Analysis by Sales Channel, 2014-2018
Table 31: North America Malted Barley Flour Market Forecast Value (US$ Mn) Analysis by Sales Channel, 2019-2029
Table 32: North America Malted Barley Flour Market Forecast Volume (MT) Analysis by Sales Channel, 2019-2029
Table 33: North America Malted Barley Flour Market Historical Value (US$ Mn) Analysis by End-Use, 2014-2018
Table 34: North America Malted Barley Flour Market Historical Volume (MT) Analysis by End-Use, 2014-2018
Table 35: North America Malted Barley Flour Market Forecast Value (US$ Mn) Analysis by End-Use, 2019-2029
Table 36: North America Malted Barley Flour Market Forecast Volume (MT) Analysis by End-Use, 2019-2029
Table 37: North America Malted Barley Flour Market Historical Value (US$ Mn) Analysis by Country, 2014-2018
Table 38: North America Malted Barley Flour Market Historical Volume (MT) Analysis by Country, 2014-2018
Table 39: North America Malted Barley Flour Market Forecast Value (US$ Mn) Analysis by Country, 2019-2029
Table 40: North America Malted Barley Flour Market Forecast Volume (MT) Analysis by Country, 2019-2029
Table 41: Latin America Malted Barley Flour Market Historical Value (US$ Mn) Analysis by Nature, 2014-2018
Table 42: Latin America Malted Barley Flour Market Historical Volume (MT) Analysis by Nature, 2014-2018
Table 43: Latin America Malted Barley Flour Market forecast Value (US$ Mn) Analysis by Nature, 2019-2029
Table 44: Latin America Malted Barley Flour Market Forecast Volume (MT) Analysis by Nature, 2019-2029
Table 45: Latin America Malted Barley Flour Market Historical Value (US$ Mn) Analysis by Product Type, 2014-2018
Table 46: Latin America Malted Barley Flour Market Historical Volume (MT) Analysis by Product Type, 2014-2018
Table 47: Latin America Malted Barley Flour Market Forecast Value (US$ Mn) Analysis by Product Type, 2019-2029
Table 48: Latin America Malted Barley Flour Market Forecast Volume (MT) Analysis by Product Type, 2019-2029
Table 49: Latin America Malted Barley Flour Market Historical Value (US$ Mn) Analysis by Sales Channel, 2014-2018
Table 50: Latin America Malted Barley Flour Market Historical Volume (MT) Analysis by Sales Channel, 2014-2018
Table 51: Latin America Malted Barley Flour Market Forecast Value (US$ Mn) Analysis by Sales Channel, 2019-2029
Table 52: Latin America Malted Barley Flour Market Forecast Volume (MT) Analysis by Sales Channel, 2019-2029
Table 53: Latin America Malted Barley Flour Market Historical Value (US$ Mn) Analysis by End-Use, 2014-2018
Table 54: Latin America Malted Barley Flour Market Historical Volume (MT) Analysis by End-Use, 2014-2018
Table 55: Latin America Malted Barley Flour Market Forecast Value (US$ Mn) Analysis by End-Use, 2019-2029
Table 56: Latin America Malted Barley Flour Market Forecast Volume (MT) Analysis by End-Use, 2019-2029
Table 57: Latin America Malted Barley Flour Market Historical Value (US$ Mn) Analysis by Country, 2014-2018
Table 58: Latin America Malted Barley Flour Market Historical Volume (MT) Analysis by Country, 2014-2018
Table 59: Latin America Malted Barley Flour Market Forecast Value (US$ Mn) Analysis by Country, 2019-2029
Table 60: Latin America Malted Barley Flour Market Forecast Volume (MT) Analysis by Country, 2019-2029
Table 61: Europe Malted Barley Flour Market Historical Value (US$ Mn) Analysis by Nature, 2014-2018
Table 62: Europe Malted Barley Flour Market Historical Volume (MT) Analysis by Nature, 2014-2018
Table 63: Europe Malted Barley Flour Market forecast Value (US$ Mn) Analysis by Nature, 2019-2029
Table 64: Europe Malted Barley Flour Market Forecast Volume (MT) Analysis by Nature, 2019-2029
Table 65: Europe Malted Barley Flour Market Historical Value (US$ Mn) Analysis by Product Type, 2014-2018
Table 66: Europe Malted Barley Flour Market Historical Volume (MT) Analysis by Product Type, 2014-2018
Table 67: Europe Malted Barley Flour Market Forecast Value (US$ Mn) Analysis by Product Type, 2019-2029
Table 68: Europe Malted Barley Flour Market Forecast Volume (MT) Analysis by Product Type, 2019-2029
Table 69: Europe Malted Barley Flour Market Historical Value (US$ Mn) Analysis by Sales Channel, 2014-2018
Table 70: Europe Malted Barley Flour Market Historical Volume (MT) Analysis by Sales Channel, 2014-2018
Table 71: Europe Malted Barley Flour Market Forecast Value (US$ Mn) Analysis by Sales Channel, 2019-2029
Table 72: Europe Malted Barley Flour Market Forecast Volume (MT) Analysis by Sales Channel, 2019-2029
Table 73: Europe Malted Barley Flour Market Historical Value (US$ Mn) Analysis by End-Use, 2014-2018
Table 74: Europe Malted Barley Flour Market Historical Volume (MT) Analysis by End-Use, 2014-2018
Table 75: Europe Malted Barley Flour Market Forecast Value (US$ Mn) Analysis by End-Use, 2019-2029
Table 76: Europe Malted Barley Flour Market Forecast Volume (MT) Analysis by End-Use, 2019-2029
Table 77: Europe Malted Barley Flour Market Historical Value (US$ Mn) Analysis by Country, 2014-2018
Table 78: Europe Malted Barley Flour Market Historical Volume (MT) Analysis by Country, 2014-2018
Table 79: Europe Malted Barley Flour Market Forecast Value (US$ Mn) Analysis by Country, 2019-2029
Table 80: Europe Malted Barley Flour Market Forecast Volume (MT) Analysis by Country, 2019-2029
Table 81: East Asia Malted Barley Flour Market Historical Value (US$ Mn) Analysis by Nature, 2014-2018
Table 82: East Asia Malted Barley Flour Market Historical Volume (MT) Analysis by Nature, 2014-2018
Table 83: East Asia Malted Barley Flour Market forecast Value (US$ Mn) Analysis by Nature, 2019-2029
Table 84: East Asia Malted Barley Flour Market Forecast Volume (MT) Analysis by Nature, 2019-2029
Table 85: East Asia Malted Barley Flour Market Historical Value (US$ Mn) Analysis by Product Type, 2014-2018
Table 86: East Asia Malted Barley Flour Market Historical Volume (MT) Analysis by Product Type, 2014-2018
Table 87: East Asia Malted Barley Flour Market Forecast Value (US$ Mn) Analysis by Product Type, 2019-2029
Table 88: East Asia Malted Barley Flour Market Forecast Volume (MT) Analysis by Product Type, 2019-2029
Table 89: East Asia Malted Barley Flour Market Historical Value (US$ Mn) Analysis by Sales Channel, 2014-2018
Table 90: East Asia Malted Barley Flour Market Historical Volume (MT) Analysis by Sales Channel, 2014-2018
Table 91: East Asia Malted Barley Flour Market Forecast Value (US$ Mn) Analysis by Sales Channel, 2019-2029
Table 92: East Asia Malted Barley Flour Market Forecast Volume (MT) Analysis by Sales Channel, 2019-2029
Table 93: East Asia Malted Barley Flour Market Historical Value (US$ Mn) Analysis by End-Use, 2014-2018
Table 94: East Asia Malted Barley Flour Market Historical Volume (MT) Analysis by End-Use, 2014-2018
Table 95: East Asia Malted Barley Flour Market Forecast Value (US$ Mn) Analysis by End-Use, 2019-2029
Table 96: East Asia Malted Barley Flour Market Forecast Volume (MT) Analysis by End-Use, 2019-2029
Table 97: East Asia Malted Barley Flour Market Historical Value (US$ Mn) Analysis by Country, 2014-2018
Table 98: East Asia Malted Barley Flour Market Historical Volume (MT) Analysis by Country, 2014-2018
Table 99: East Asia Malted Barley Flour Market Forecast Value (US$ Mn) Analysis by Country, 2019-2029
Table 100: East Asia Malted Barley Flour Market Forecast Volume (MT) Analysis by Country, 2019-2029
Table 101: South Asia Malted Barley Flour Market Historical Value (US$ Mn) Analysis by Nature, 2014-2018
Table 102: South Asia Malted Barley Flour Market Historical Volume (MT) Analysis by Nature, 2014-2018
Table 103: South Asia Malted Barley Flour Market forecast Value (US$ Mn) Analysis by Nature, 2019-2029
Table 104: South Asia Malted Barley Flour Market Forecast Volume (MT) Analysis by Nature, 2019-2029
Table 105: South Asia Malted Barley Flour Market Historical Value (US$ Mn) Analysis by Product Type, 2014-2018
Table 106: South Asia Malted Barley Flour Market Historical Volume (MT) Analysis by Product Type, 2014-2018
Table 107: South Asia Malted Barley Flour Market Forecast Value (US$ Mn) Analysis by Product Type, 2019-2029
Table 108: South Asia Malted Barley Flour Market Forecast Volume (MT) Analysis by Product Type, 2019-2029
Table 109: South Asia Malted Barley Flour Market Historical Value (US$ Mn) Analysis by Sales Channel, 2014-2018
Table 110: South Asia Malted Barley Flour Market Historical Volume (MT) Analysis by Sales Channel, 2014-2018
Table 111: South Asia Malted Barley Flour Market Forecast Value (US$ Mn) Analysis by Sales Channel, 2019-2029
Table 112: South Asia Malted Barley Flour Market Forecast Volume (MT) Analysis by Sales Channel, 2019-2029
Table 113: South Asia Malted Barley Flour Market Historical Value (US$ Mn) Analysis by End-Use, 2014-2018
Table 114: South Asia Malted Barley Flour Market Historical Volume (MT) Analysis by End-Use, 2014-2018
Table 115: South Asia Malted Barley Flour Market Forecast Value (US$ Mn) Analysis by End-Use, 2019-2029
Table 116: South Asia Malted Barley Flour Market Forecast Volume (MT) Analysis by End-Use, 2019-2029
Table 117: South Asia Malted Barley Flour Market Historical Value (US$ Mn) Analysis by Country, 2014-2018
Table 118: South Asia Malted Barley Flour Market Historical Volume (MT) Analysis by Country, 2014-2018
Table 119: South Asia Malted Barley Flour Market Forecast Value (US$ Mn) Analysis by Country, 2019-2029
Table 120: South Asia Malted Barley Flour Market Forecast Volume (MT) Analysis by Country, 2019-2029
Table 121: Oceania Malted Barley Flour Market Historical Value (US$ Mn) Analysis by Nature, 2014-2018
Table 122: Oceania Malted Barley Flour Market Historical Volume (MT) Analysis by Nature, 2014-2018
Table 123: Oceania Malted Barley Flour Market forecast Value (US$ Mn) Analysis by Nature, 2019-2029
Table 124: Oceania Malted Barley Flour Market Forecast Volume (MT) Analysis by Nature, 2019-2029
Table 125: Oceania Malted Barley Flour Market Historical Value (US$ Mn) Analysis by Product Type, 2014-2018
Table 126: Oceania Malted Barley Flour Market Historical Volume (MT) Analysis by Product Type, 2014-2018
Table 127: Oceania Malted Barley Flour Market Forecast Value (US$ Mn) Analysis by Product Type, 2019-2029
Table 128: Oceania Malted Barley Flour Market Forecast Volume (MT) Analysis by Product Type, 2019-2029
Table 129: Oceania Malted Barley Flour Market Historical Value (US$ Mn) Analysis by Sales Channel, 2014-2018
Table 130: Oceania Malted Barley Flour Market Historical Volume (MT) Analysis by Sales Channel, 2014-2018
Table 131: Oceania Malted Barley Flour Market Forecast Value (US$ Mn) Analysis by Sales Channel, 2019-2029
Table 132: Oceania Malted Barley Flour Market Forecast Volume (MT) Analysis by Sales Channel, 2019-2029
Table 133: Oceania Malted Barley Flour Market Historical Value (US$ Mn) Analysis by End-Use, 2014-2018
Table 134: Oceania Malted Barley Flour Market Historical Volume (MT) Analysis by End-Use, 2014-2018
Table 135: Oceania Malted Barley Flour Market Forecast Value (US$ Mn) Analysis by End-Use, 2019-2029
Table 136: Oceania Malted Barley Flour Market Forecast Volume (MT) Analysis by End-Use, 2019-2029
Table 137: Oceania Malted Barley Flour Market Historical Value (US$ Mn) Analysis by Country, 2014-2018
Table 138: Oceania Malted Barley Flour Market Historical Volume (MT) Analysis by Country, 2014-2018
Table 139: Oceania Malted Barley Flour Market Forecast Value (US$ Mn) Analysis by Country, 2019-2029
Table 140: Oceania Malted Barley Flour Market Forecast Volume (MT) Analysis by Country, 2019-2029
Table 141: MEA Malted Barley Flour Market Historical Value (US$ Mn) Analysis by Nature, 2014-2018
Table 142: MEA Malted Barley Flour Market Historical Volume (MT) Analysis by Nature, 2014-2018
Table 143: MEA Malted Barley Flour Market forecast Value (US$ Mn) Analysis by Nature, 2019-2029
Table 144: MEA Malted Barley Flour Market Forecast Volume (MT) Analysis by Nature, 2019-2029
Table 145: MEA Malted Barley Flour Market Historical Value (US$ Mn) Analysis by Product Type, 2014-2018
Table 146: MEA Malted Barley Flour Market Historical Volume (MT) Analysis by Product Type, 2014-2018
Table 147: MEA Malted Barley Flour Market Forecast Value (US$ Mn) Analysis by Product Type, 2019-2029
Table 148: MEA Malted Barley Flour Market Forecast Volume (MT) Analysis by Product Type, 2019-2029
Table 149: MEA Malted Barley Flour Market Historical Value (US$ Mn) Analysis by Sales Channel, 2014-2018
Table 150: MEA Malted Barley Flour Market Historical Volume (MT) Analysis by Sales Channel, 2014-2018
Table 151: MEA Malted Barley Flour Market Forecast Value (US$ Mn) Analysis by Sales Channel, 2019-2029
Table 152: MEA Malted Barley Flour Market Forecast Volume (MT) Analysis by Sales Channel, 2019-2029
Table 153: MEA Malted Barley Flour Market Historical Value (US$ Mn) Analysis by End-Use, 2014-2018
Table 154: MEA Malted Barley Flour Market Historical Volume (MT) Analysis by End-Use, 2014-2018
Table 155: MEA Malted Barley Flour Market Forecast Value (US$ Mn) Analysis by End-Use, 2019-2029
Table 156: MEA Malted Barley Flour Market Forecast Volume (MT) Analysis by End-Use, 2019-2029
Table 157: MEA Malted Barley Flour Market Historical Value (US$ Mn) Analysis by Country, 2014-2018
Table 158: MEA Malted Barley Flour Market Historical Volume (MT) Analysis by Country, 2014-2018
Table 159: MEA Malted Barley Flour Market Forecast Value (US$ Mn) Analysis by Country, 2019-2029
Table 160: MEA Malted Barley Flour Market Forecast Volume (MT) Analysis by Country, 2019-2029
List of Figure
Figure 1: Global Malted Barley Flour Market Value Y-o-Y Growth and Forecast, 2014-2029
Figure 2: Global Malted Barley Flour Market Incremental $ Opportunity, 2019-2029
Figure 3: Global Malted Barley Flour Market Incremental Volume (MT), 2019-2029
Figure 4: Global Malted Barley Flour Market Value Y-o-Y Growth and Forecast, by Region, 2014-2029
Figure 5: Global Malted Barley Flour Market Incremental $ Opportunity, by Region, 2019-2029
Figure 6: Global Malted Barley Flour Market Attractiveness Index, by Region, 2019-2029
Figure 7: Global Malted Barley Flour Market Value Y-o-Y Growth and Forecast, by Nature, 2014-2029
Figure 8: Global Malted Barley Flour Market Incremental $ Opportunity, by Nature, 2019-2029
Figure 9: Global Malted Barley Flour Market Value Y-o-Y Growth and Forecast, by Nature, 2014-2029
Figure 10: Global Malted Barley Flour Market Value Y-o-Y Growth and Forecast, by Product Type, 2014-2029
Figure 11: Global Malted Barley Flour Market Incremental $ Opportunity, by Product Type, 2019-2029
Figure 12: Global Malted Barley Flour Market Value Y-o-Y Growth and Forecast, by Product Type, 2014-2029
Figure 13: Global Malted Barley Flour Market Value Y-o-Y Growth and Forecast, by Sale Channel, 2014-2029
Figure 14: Global Malted Barley Flour Market Incremental $ Opportunity, by Sale Channel, 2019-2029
Figure 15: Global Malted Barley Flour Market Value Y-o-Y Growth and Forecast, by Sale Channel, 2014-2029
Figure 16: Global Malted Barley Flour Market Value Y-o-Y Growth and Forecast, by End-Use, 2014-2029
Figure 17: Global Malted Barley Flour Market Incremental $ Opportunity, by End-Use, 2019-2029
Figure 18: Global Malted Barley Flour Market Value Y-o-Y Growth and Forecast, by End-Use, 2014-2029
Figure 19: North America Malted Barley Flour Market Value Y-o-Y Growth and Forecast, by Country, 2014-2029
Figure 20: North America Malted Barley Flour Market Incremental $ Opportunity, by Country, 2019-2029
Figure 21: North America Malted Barley Flour Market Attractiveness Index, by Country, 2019-2029
Figure 22: North America Malted Barley Flour Market Value Y-o-Y Growth and Forecast, by Nature, 2014-2029
Figure 23: North America Malted Barley Flour Market Incremental $ Opportunity, by Nature, 2019-2029
Figure 24: North America Malted Barley Flour Market Value Y-o-Y Growth and Forecast, by Nature, 2014-2029
Figure 25: North America Malted Barley Flour Market Value Y-o-Y Growth and Forecast, by Product Type, 2014-2029
Figure 26: North America Malted Barley Flour Market Incremental $ Opportunity, by Product Type, 2019-2029
Figure 27: North America Malted Barley Flour Market Value Y-o-Y Growth and Forecast, by Product Type, 2014-2029
Figure 28: North America Malted Barley Flour Market Value Y-o-Y Growth and Forecast, by Sale Channel, 2014-2029
Figure 29: North America Malted Barley Flour Market Incremental $ Opportunity, by Sale Channel, 2019-2029
Figure 30: North America Malted Barley Flour Market Value Y-o-Y Growth and Forecast, by Sale Channel, 2014-2029
Figure 31: North America Malted Barley Flour Market Value Y-o-Y Growth and Forecast, by End-Use, 2014-2029
Figure 32: North America Malted Barley Flour Market Incremental $ Opportunity, by End-Use, 2019-2029
Figure 33: North America Malted Barley Flour Market Value Y-o-Y Growth and Forecast, by End-Use, 2014-2029
Figure 34: North America Malted Barley Flour Market Value Y-o-Y Growth and Forecast, by Country, 2014-2029
Figure 35: North America Malted Barley Flour Market Incremental $ Opportunity, by Country, 2019-2029
Figure 36: North America Malted Barley Flour Market Attractiveness Index, by Country, 2019-2029
Figure 37: Latin America Malted Barley Flour Market Value Y-o-Y Growth and Forecast, by Nature, 2014-2029
Figure 38: Latin America Malted Barley Flour Market Incremental $ Opportunity, by Nature, 2019-2029
Figure 39: Latin America Malted Barley Flour Market Value Y-o-Y Growth and Forecast, by Nature, 2014-2029
Figure 40: Latin America Malted Barley Flour Market Value Y-o-Y Growth and Forecast, by Product Type, 2014-2029
Figure 41: Latin America Malted Barley Flour Market Incremental $ Opportunity, by Product Type, 2019-2029
Figure 42: Latin America Malted Barley Flour Market Value Y-o-Y Growth and Forecast, by Product Type, 2014-2029
Figure 43: Latin America Malted Barley Flour Market Value Y-o-Y Growth and Forecast, by Sale Channel, 2014-2029
Figure 44: Latin America Malted Barley Flour Market Incremental $ Opportunity, by Sale Channel, 2019-2029
Figure 45: Latin America Malted Barley Flour Market Value Y-o-Y Growth and Forecast, by Sale Channel, 2014-2029
Figure 46: Latin America Malted Barley Flour Market Value Y-o-Y Growth and Forecast, by End-Use, 2014-2029
Figure 47: Latin America Malted Barley Flour Market Incremental $ Opportunity, by End-Use, 2019-2029
Figure 48: Latin America Malted Barley Flour Market Value Y-o-Y Growth and Forecast, by End-Use, 2014-2029
Figure 49: Latin America Malted Barley Flour Market Value Y-o-Y Growth and Forecast, by Country, 2014-2029
Figure 50: Latin America Malted Barley Flour Market Incremental $ Opportunity, by Country, 2019-2029
Figure 51: Latin America Malted Barley Flour Market Attractiveness Index, by Country, 2019-2029
Figure 52: Europe Malted Barley Flour Market Value Y-o-Y Growth and Forecast, by Nature, 2014-2029
Figure 53: Europe Malted Barley Flour Market Incremental $ Opportunity, by Nature, 2019-2029
Figure 54: Europe Malted Barley Flour Market Value Y-o-Y Growth and Forecast, by Nature, 2014-2029
Figure 55: Europe Malted Barley Flour Market Value Y-o-Y Growth and Forecast, by Product Type, 2014-2029
Figure 56: Europe Malted Barley Flour Market Incremental $ Opportunity, by Product Type, 2019-2029
Figure 57: Europe Malted Barley Flour Market Value Y-o-Y Growth and Forecast, by Product Type, 2014-2029
Figure 58: Europe Malted Barley Flour Market Value Y-o-Y Growth and Forecast, by Sale Channel, 2014-2029
Figure 59: Europe Malted Barley Flour Market Incremental $ Opportunity, by Sale Channel, 2019-2029
Figure 60: Europe Malted Barley Flour Market Value Y-o-Y Growth and Forecast, by Sale Channel, 2014-2029
Figure 61: Europe Malted Barley Flour Market Value Y-o-Y Growth and Forecast, by End-Use, 2014-2029
Figure 62: Europe Malted Barley Flour Market Incremental $ Opportunity, by End-Use, 2019-2029
Figure 63: Europe Malted Barley Flour Market Value Y-o-Y Growth and Forecast, by End-Use, 2014-2029
Figure 64: Europe Malted Barley Flour Market Value Y-o-Y Growth and Forecast, by Country, 2014-2029
Figure 65: Europe Malted Barley Flour Market Incremental $ Opportunity, by Country, 2019-2029
Figure 66: Europe Malted Barley Flour Market Attractiveness Index, by Country, 2019-2029
Figure 67: East Asia Malted Barley Flour Market Value Y-o-Y Growth and Forecast, by Nature, 2014-2029
Figure 68: East Asia Malted Barley Flour Market Incremental $ Opportunity, by Nature, 2019-2029
Figure 69: East Asia Malted Barley Flour Market Value Y-o-Y Growth and Forecast, by Nature, 2014-2029
Figure 70: East Asia Malted Barley Flour Market Value Y-o-Y Growth and Forecast, by Product Type, 2014-2029
Figure 71: East Asia Malted Barley Flour Market Incremental $ Opportunity, by Product Type, 2019-2029
Figure 72: East Asia Malted Barley Flour Market Value Y-o-Y Growth and Forecast, by Product Type, 2014-2029
Figure 73: East Asia Malted Barley Flour Market Value Y-o-Y Growth and Forecast, by Sale Channel, 2014-2029
Figure 74: East Asia Malted Barley Flour Market Incremental $ Opportunity, by Sale Channel, 2019-2029
Figure 75: East Asia Malted Barley Flour Market Value Y-o-Y Growth and Forecast, by Sale Channel, 2014-2029
Figure 76: East Asia Malted Barley Flour Market Value Y-o-Y Growth and Forecast, by End-Use, 2014-2029
Figure 77: East Asia Malted Barley Flour Market Incremental $ Opportunity, by End-Use, 2019-2029
Figure 78: East Asia Malted Barley Flour Market Value Y-o-Y Growth and Forecast, by End-Use, 2014-2029
Figure 79: East Asia Malted Barley Flour Market Value Y-o-Y Growth and Forecast, by Country, 2014-2029
Figure 80: East Asia Malted Barley Flour Market Incremental $ Opportunity, by Country, 2019-2029
Figure 81: East Asia Malted Barley Flour Market Attractiveness Index, by Country, 2019-2029
Figure 82: South Asia Malted Barley Flour Market Value Y-o-Y Growth and Forecast, by Nature, 2014-2029
Figure 83: South Asia Malted Barley Flour Market Incremental $ Opportunity, by Nature, 2019-2029
Figure 84: South Asia Malted Barley Flour Market Value Y-o-Y Growth and Forecast, by Nature, 2014-2029
Figure 85: South Asia Malted Barley Flour Market Value Y-o-Y Growth and Forecast, by Product Type, 2014-2029
Figure 86: South Asia Malted Barley Flour Market Incremental $ Opportunity, by Product Type, 2019-2029
Figure 87: South Asia Malted Barley Flour Market Value Y-o-Y Growth and Forecast, by Product Type, 2014-2029
Figure 88: South Asia Malted Barley Flour Market Value Y-o-Y Growth and Forecast, by Sale Channel, 2014-2029
Figure 89: South Asia Malted Barley Flour Market Incremental $ Opportunity, by Sale Channel, 2019-2029
Figure 90: South Asia Malted Barley Flour Market Value Y-o-Y Growth and Forecast, by Sale Channel, 2014-2029
Figure 91: South Asia Malted Barley Flour Market Value Y-o-Y Growth and Forecast, by End-Use, 2014-2029
Figure 92: South Asia Malted Barley Flour Market Incremental $ Opportunity, by End-Use, 2019-2029
Figure 93: South Asia Malted Barley Flour Market Value Y-o-Y Growth and Forecast, by End-Use, 2014-2029
Figure 94: South Asia Malted Barley Flour Market Value Y-o-Y Growth and Forecast, by Country, 2014-2029
Figure 95: South Asia Malted Barley Flour Market Incremental $ Opportunity, by Country, 2019-2029
Figure 96: South Asia Malted Barley Flour Market Attractiveness Index, by Country, 2019-2029
Figure 97: Oceania Malted Barley Flour Market Value Y-o-Y Growth and Forecast, by Nature, 2014-2029
Figure 98: Oceania Malted Barley Flour Market Incremental $ Opportunity, by Nature, 2019-2029
Figure 99: Oceania Malted Barley Flour Market Value Y-o-Y Growth and Forecast, by Nature, 2014-2029
Figure 100: Oceania Malted Barley Flour Market Value Y-o-Y Growth and Forecast, by Product Type, 2014-2029
Figure 101: Oceania Malted Barley Flour Market Incremental $ Opportunity, by Product Type, 2019-2029
Figure 102: Oceania Malted Barley Flour Market Value Y-o-Y Growth and Forecast, by Product Type, 2014-2029
Figure 103: Oceania Malted Barley Flour Market Value Y-o-Y Growth and Forecast, by Sale Channel, 2014-2029
Figure 104: Oceania Malted Barley Flour Market Incremental $ Opportunity, by Sale Channel, 2019-2029
Figure 105: Oceania Malted Barley Flour Market Value Y-o-Y Growth and Forecast, by Sale Channel, 2014-2029
Figure 106: Oceania Malted Barley Flour Market Value Y-o-Y Growth and Forecast, by End-Use, 2014-2029
Figure 107: Oceania Malted Barley Flour Market Incremental $ Opportunity, by End-Use, 2019-2029
Figure 108: Oceania Malted Barley Flour Market Value Y-o-Y Growth and Forecast, by End-Use, 2014-2029
Figure 109: Oceania Malted Barley Flour Market Value Y-o-Y Growth and Forecast, by Country, 2014-2029
Figure 110: Oceania Malted Barley Flour Market Incremental $ Opportunity, by Country, 2019-2029
Figure 111: Oceania Malted Barley Flour Market Attractiveness Index, by Country, 2019-2029
Figure 112: MEA Malted Barley Flour Market Value Y-o-Y Growth and Forecast, by Nature, 2014-2029
Figure 113: MEA Malted Barley Flour Market Incremental $ Opportunity, by Nature, 2019-2029
Figure 114: MEA Malted Barley Flour Market Value Y-o-Y Growth and Forecast, by Nature, 2014-2029
Figure 115: MEA Malted Barley Flour Market Value Y-o-Y Growth and Forecast, by Product Type, 2014-2029
Figure 116: MEA Malted Barley Flour Market Incremental $ Opportunity, by Product Type, 2019-2029
Figure 117: MEA Malted Barley Flour Market Value Y-o-Y Growth and Forecast, by Product Type, 2014-2029
Figure 118: MEA Malted Barley Flour Market Value Y-o-Y Growth and Forecast, by Sale Channel, 2014-2029
Figure 119: MEA Malted Barley Flour Market Incremental $ Opportunity, by Sale Channel, 2019-2029
Figure 120: MEA Malted Barley Flour Market Value Y-o-Y Growth and Forecast, by Sale Channel, 2014-2029
Figure 121: MEA Malted Barley Flour Market Value Y-o-Y Growth and Forecast, by End-Use, 2014-2029
Figure 122: MEA Malted Barley Flour Market Incremental $ Opportunity, by End-Use, 2019-2029
Figure 123: MEA Malted Barley Flour Market Value Y-o-Y Growth and Forecast, by End-Use, 2014-2029
Figure 124: MEA Malted Barley Flour Market Value Y-o-Y Growth and Forecast, by Country, 2014-2029
Figure 125: MEA Malted Barley Flour Market Incremental $ Opportunity, by Country, 2019-2029
Figure 126: MEA Malted Barley Flour Market Attractiveness Index, by Country, 2019-2029
Copyright © Transparency Market Research, Inc. All Rights reserved
Trust Online

Malted Barley Flour Market