
Reports
Reports
The global liquid crystal tunable filters market is prophesized to witness substantial growth over the period of projection. Expansion of the market is mainly due to the rise in its demand and its wide use across several applications. These filters provide multiple advantages such as low cost, outstanding quality of image, controllability, and quick tenability. All these features make it suitable for use in several applications in the medical industry, thereby boosting the global liquid crystal tunable filters market in years to come.
The global liquid crystal tunable filters market is likely to register a double-digit growth rate of 11% CAGR over the projection period, from 2019 to 2027.
Some of the key players in the global liquid crystal tunable filters market comprise Perkinelmer Inc., ChemImage Corporation, Kent Optronics, Inc., Channel Systems, Inc., Semrock, Inc. and Meadowlark Optics, Inc.
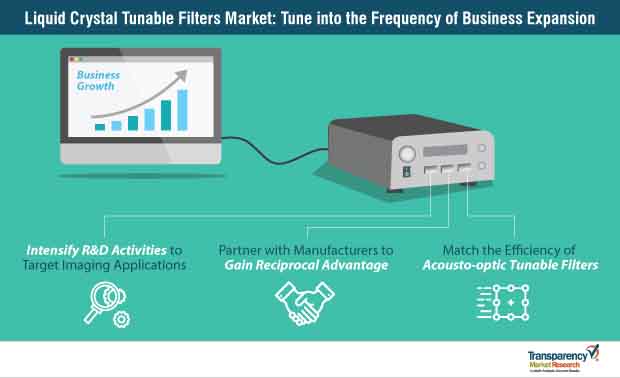
Extensive Use in Imaging Applications Pave Way for Rapid Growth of the Market
An astral rise in the demand for liquid crystal tunable filters is mainly due to the increased use various imaging applications and spectroscopy. Liquid crystal tunable filters find increased use in hyperspectral imaging systems for obtaining many spectral elements of scenes successively by adjusting the center wavelength of the said filter.
Exact transmission prototype of liquid crystal tunable filters is utilized increasingly for correct indication of the effects of band pass filtering on the spectra. This factor is expected to add to the growth of the global liquid crystal tunable filters market over the projection tenure, from 2019 to 2027. Besides, randomly coded apertures are placed behind these filters for controlling the shadowy images of the spatial domain.
The global liquid crystal tunable filters market is anticipated to be influenced by its ability to make the spatial and spectral resolution of existing spectral imager better. This can be achieved without even changing the structure of the detector and filter. It is possible to capture several images at a speed of 14 images per second with the help of this system. Such advantages are likely to work in favor of the expansion of the global liquid crystal tunable filters market in near future.
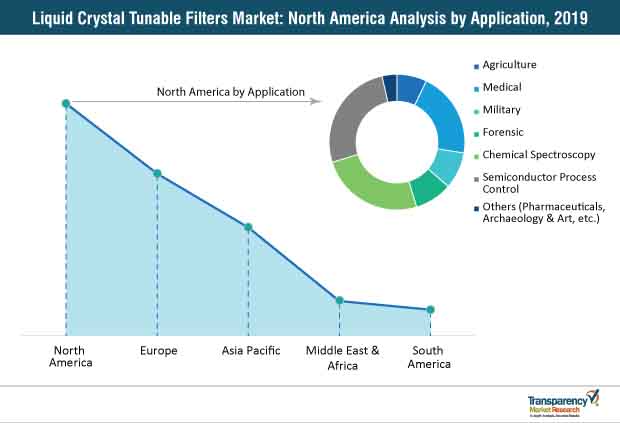
North America to Market Dominance over the Projection period, from 2019 to 2027
In a bid to provide a deeper insight of the market, experts at TMR have split the global liquid crystal tunable filters market into five key territories. North America, Latin America, Asia Pacific, Middle East and Africa, and Europe are the major territories in the global liquid crystal tunable filters market.
In terms of both value and volume, North America is likely to play a dominant role in the global liquid crystal tunable filters market during the projection period. Increased uptake of near-IR imaging solutions and visible imaging solutions is estimated to offer copious growth opportunities for the global liquid crystal tunable filters market.
Extensive research and development activities pertaining to these filters are likely to make Asia Pacific a promising region for the market stakeholders in the years to come. It is estimated that Asia Pacific region will observe rapid growth over the next few years to come.
Analysts’ Take on the Prospects of the Liquid Crystal Tunable Filters Market
Authors of the study are sanguine about the future of the liquid crystal tunable filters market through to 2027. North America, followed by Europe, is likely to remain a lucrative region, with a majority of sales driven by semiconductor process control and chemical spectroscopy industries. Countries such as the U.S., China, and the U.K. will witness high demand for liquid crystal tunable filters, on the back of their intense research and development activities.
Investments directed towards the development of new technologies will surface novel end-use applications of liquid crystal tunable filters, thereby boding lucrative future growth. With machine vision and imaging being key applications, manufacturers can entail efforts in the direction of enhancing their product efficiency to position them in distinguished light and increase their marketability. Industry 2.0, engendering the trend of miniaturization, will account for significant sales of liquid crystal tunable filters in the future. The only hurdle that market pacers need to overcome remains in the form of high research and development cost.
Liquid Crystal Tunable Filters: Definition/Overview
Global Liquid Crystal Tunable Filters Market: Regional Overview
Global Liquid Crystal Tunable Filters Market: Trends
Global Liquid Crystal Tunable Filters Market: Drivers, Opportunities, and Restraints
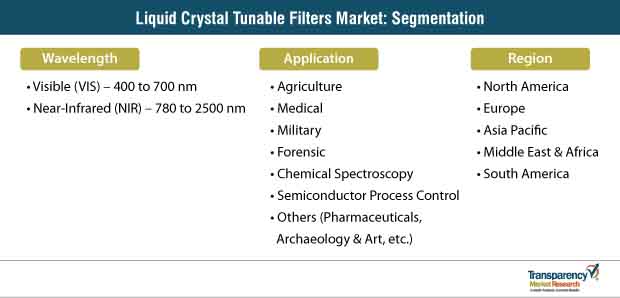
Global Liquid Crystal Tunable Filters Market: Key Segments
The global liquid crystal tunable filters market has been segmented based on wavelength, application, and region.
Global Liquid Crystal Tunable Filters Market: Competition Landscape
Attracted by the anticipated growth of the global liquid crystal tunable filters market and underlying latent demand, several players are expanding their businesses through strategic mergers and acquisitions, as well as partnerships. Some of the prominent players operating in the global liquid crystal tunable filters market are
1. Preface
1.1. Market Definition and Scope
1.2. Market Segmentation
1.3. Key Research Objectives
1.4. Research Highlights
2. Assumptions and Research Methodology
3. Executive Summary: Global Liquid Crystal Tunable Filters Market
4. Market Overview
4.1. Introduction
4.2. Market Dynamics
4.2.1. Drivers
4.2.2. Restraints
4.2.3. Opportunities
4.3. Key Trends
4.4. Global Liquid Crystal Tunable Filters Market Analysis and Forecast, 2017–2027
4.4.1. Market Revenue Projection (US$ Mn)
4.4.2. Market Volume Projection (Million Units)
4.5. Porter’s Five Forces Analysis - Global Liquid Crystal Tunable Filters Market
4.6. Value Chain Analysis - Global Liquid Crystal Tunable Filters Market
4.7. Market Outlook
5. Global Liquid Crystal Tunable Filters Market Analysis and Forecast, by Wavelength
5.1. Overview & Definitions
5.2. Global Liquid Crystal Tunable Filters Market Size (US$ Mn and Million Units) Forecast, by Wavelength, 2017–2027
5.2.1. Visible (VIS) – 400 to 700 nm
5.2.2. Near-infrared (NIR) – 780 to 2500 nm
5.3. Wavelength Comparison Matrix
5.4. Global Liquid Crystal Tunable Filters Market Attractiveness, by Wavelength
6. Global Liquid Crystal Tunable Filters Market Analysis and Forecast, by Application
6.1. Overview & Definitions
6.2. Global Liquid Crystal Tunable Filters Market Revenue (US$ Mn) Forecast, by Application, 2017–2027
6.2.1. Agriculture
6.2.2. Medical
6.2.3. Military
6.2.4. Forensic
6.2.5. Chemical Spectroscopy
6.2.6. Semiconductor Process Control
6.2.7. Others (Pharmaceutical, Archaeology & Art, etc.)
6.3. Application Comparison Matrix
6.4. Global Liquid Crystal Tunable Filters Market Attractiveness, by Application
7. Global Liquid Crystal Tunable Filters Market Analysis and Forecast, by Region
7.1. Key Findings
7.2. Global Liquid Crystal Tunable Filters Market Size (US$ Mn and Million Units) Forecast, by Region, 2017–2027
7.2.1. North America
7.2.2. Europe
7.2.3. Asia Pacific
7.2.4. Middle East & Africa
7.2.5. South America
7.3. Global Liquid Crystal Tunable Filters Market Attractiveness, by Region
8. North America Liquid Crystal Tunable Filters Market Analysis and Forecast
8.1. Key Findings
8.2. Key Trends
8.3. North America Liquid Crystal Tunable Filters Market Size (US$ Mn and Million Units) Forecast, by Wavelength, 2017–2027
8.3.1. Visible (VIS) – 400 to 700 nm
8.3.2. Near-infrared (NIR) – 780 to 2500 nm
8.4. North America Liquid Crystal Tunable Filters Market Revenue (US$ Mn) Forecast, by Application, 2017–2027
8.4.1. Agriculture
8.4.2. Medical
8.4.3. Military
8.4.4. Forensic
8.4.5. Chemical Spectroscopy
8.4.6. Semiconductor Process Control
8.4.7. Others (Pharmaceutical, Archaeology & Art, etc.)
8.5. North America Liquid Crystal Tunable Filters Market Size (US$ Mn and Million Units) Forecast, by Country/Sub-region, 2017–2027
8.5.1. U.S.
8.5.2. Canada
8.5.3. Rest of North America
8.6. North America Liquid Crystal Tunable Filters Market Attractiveness Analysis
8.6.1. By Wavelength
8.6.2. By Application
8.6.3. By Country/Sub-region
9. Europe Liquid Crystal Tunable Filters Market Analysis and Forecast
9.1. Key Findings
9.2. Key Trends
9.3. Europe Liquid Crystal Tunable Filters Market Size (US$ Mn and Million Units) Forecast, by Wavelength, 2017–2027
9.3.1. Visible (VIS) – 400 to 700 nm
9.3.2. Near-infrared (NIR) – 780 to 2500 nm
9.4. Europe Liquid Crystal Tunable Filters Market Revenue (US$ Mn) Forecast, by Application, 2017–2027
9.4.1. Agriculture
9.4.2. Medical
9.4.3. Military
9.4.4. Forensic
9.4.5. Chemical Spectroscopy
9.4.6. Semiconductor Process Control
9.4.7. Others (Pharmaceutical, Archaeology & Art, etc.)
9.5. Europe Liquid Crystal Tunable Filters Market Size (US$ Mn and Million Units) Forecast, by Country/Sub-region, 2017–2027
9.5.1. Germany
9.5.2. U.K.
9.5.3. France
9.5.4. Rest of Europe
9.6. Europe Liquid Crystal Tunable Filters Market Attractiveness Analysis
9.6.1. By Wavelength
9.6.2. By Application
9.6.3. By Country/Sub-region
10. Asia Pacific Liquid Crystal Tunable Filters Market Analysis and Forecast
10.1. Key Findings
10.2. Key Trends
10.3. Asia Pacific Liquid Crystal Tunable Filters Market Size (US$ Mn and Million Units) Forecast, by Wavelength, 2017–2027
10.3.1. Visible (VIS) – 400 to 700 nm
10.3.2. Near-infrared (NIR) – 780 to 2500 nm
10.4. Asia Pacific Liquid Crystal Tunable Filters Market Revenue (US$ Mn) Forecast, by Application, 2017–2027
10.4.1. Agriculture
10.4.2. Medical
10.4.3. Military
10.4.4. Forensic
10.4.5. Chemical Spectroscopy
10.4.6. Semiconductor Process Control
10.4.7. Others (Pharmaceutical, Archaeology & Art, etc.)
10.5. Asia Pacific Liquid Crystal Tunable Filters Market Size (US$ Mn and Million Units) Forecast, by Country/Sub-region, 2017–2027
10.5.1. China
10.5.2. India
10.5.3. Japan
10.5.4. Rest of Asia Pacific
10.6. Asia Pacific Liquid Crystal Tunable Filters Market Attractiveness Analysis
10.6.1. By Wavelength
10.6.2. By Application
10.6.3. By Country/Sub-region
11. Middle East & Africa Liquid Crystal Tunable Filters Market Analysis and Forecast
11.1. Key Findings
11.2. Key Trends
11.3. Middle East & Africa Liquid Crystal Tunable Filters Market Size (US$ Mn and Million Units) Forecast, by Wavelength, 2017–2027
11.3.1. Visible (VIS) – 400 to 700 nm
11.3.2. Near-infrared (NIR) – 780 to 2500 nm
11.4. Middle East & Africa Liquid Crystal Tunable Filters Market Revenue (US$ Mn) Forecast, by Application, 2017–2027
11.4.1. Agriculture
11.4.2. Medical
11.4.3. Military
11.4.4. Forensic
11.4.5. Chemical Spectroscopy
11.4.6. Semiconductor Process Control
11.4.7. Others (Pharmaceutical, Archaeology & Art, etc.)
11.5. Middle East & Africa Liquid Crystal Tunable Filters Market Size (US$ Mn and Million Units) Forecast, by Country/Sub-region, 2017–2027
11.5.1. GCC
11.5.2. South Africa
11.5.3. Rest of Middle East & Africa
11.6. Middle East & Africa Liquid Crystal Tunable Filters Market Attractiveness Analysis
11.6.1. By Wavelength
11.6.2. By Application
11.6.3. By Country/Sub-region
12. South America Liquid Crystal Tunable Filters Market Analysis and Forecast
12.1. Key Findings
12.2. Key Trends
12.3. South America Liquid Crystal Tunable Filters Market Size (US$ Mn and Million Units) Forecast, by Wavelength, 2017–2027
12.3.1. Visible (VIS) – 400 to 700 nm
12.3.2. Near-infrared (NIR) – 780 to 2500 nm
12.4. South America Liquid Crystal Tunable Filters Market Revenue (US$ Mn) Forecast, by Application, 2017–2027
12.4.1. Agriculture
12.4.2. Medical
12.4.3. Military
12.4.4. Forensic
12.4.5. Chemical Spectroscopy
12.4.6. Semiconductor Process Control
12.4.7. Others (Pharmaceutical, Archaeology & Art, etc.)
12.5. South America Liquid Crystal Tunable Filters Market Size (US$ Mn and Million Units) Forecast, by Country/Sub-region, 2017–2027
12.5.1. Brazil
12.5.2. Rest of South America
12.6. South America Liquid Crystal Tunable Filters Market Attractiveness Analysis
12.6.1. By Wavelength
12.6.2. By Application
12.6.3. By Country/Sub-region
13. Competition Landscape
13.1. Market Players – Competition Matrix
13.2. Global Liquid Crystal Tunable Filters Market Share Analysis, by Company (2018)
13.3. Company Profiles (Details – Overview, Financials, SWOT Analysis, Strategy)
13.3.1. Channel Systems, Inc.
13.3.1.1. Overview
13.3.1.2. Financials
13.3.1.3. SWOT Analysis
13.3.1.4. Strategy
13.3.2. Perkinelmer Inc.
13.3.2.1. Overview
13.3.2.2. Financials
13.3.2.3. SWOT Analysis
13.3.2.4. Strategy
13.3.3. Thorlabs, Inc.
13.3.3.1. Overview
13.3.3.2. Financials
13.3.3.3. SWOT Analysis
13.3.3.4. Strategy
13.3.4. Santec Corporation
13.3.4.1. Overview
13.3.4.2. Financials
13.3.4.3. SWOT Analysis
13.3.4.4. Strategy
13.3.5. Kent Optronics, Inc.
13.3.5.1. Overview
13.3.5.2. Financials
13.3.5.3. SWOT Analysis
13.3.5.4. Strategy
13.3.6. Semrock, Inc.
13.3.6.1. Overview
13.3.6.2. Financials
13.3.6.3. SWOT Analysis
13.3.6.4. Strategy
13.3.7. Meadowlark Optics, Inc.
13.3.7.1. Overview
13.3.7.2. Financials
13.3.7.3. SWOT Analysis
13.3.7.4. Strategy
13.3.8. ChemImage
13.3.8.1. Overview
13.3.8.2. Financials
13.3.8.3. SWOT Analysis
13.3.8.4. Strategy
14. Key Takeaways
List of Tables
Table 1: Global Liquid Crystal Tunable Filters Market Revenue (US$ Mn), by Wavelength, 2017–2027
Table 2: Global Liquid Crystal Tunable Filters Market Volume (Million Units), by Wavelength, 2017–2027
Table 3: Global Liquid Crystal Tunable Filters Market Revenue (US$ Mn), by Application, 2017–2027
Table 4: Global Liquid Crystal Tunable Filters Market Revenue (US$ Mn), by Region, 2017–2027
Table 5: Global Liquid Crystal Tunable Filters Market Volume (Million Units), by Region, 2017–2027
Table 6: North America Liquid Crystal Tunable Filters Market Revenue (US$ Mn), by Wavelength, 2017–2027
Table 7: North America Liquid Crystal Tunable Filters Market Volume (Million Units), by Wavelength, 2017–2027
Table 8: North America Liquid Crystal Tunable Filters Market Revenue (US$ Mn), by Application, 2017–2027
Table 9: North America Liquid Crystal Tunable Filters Market Revenue (US$ Mn), by Country/Sub-region, 2017–2027
Table 10: North America Liquid Crystal Tunable Filters Market Volume (Million Units), by Country/Sub-region, 2017–2027
Table 11: Europe Liquid Crystal Tunable Filters Market Revenue (US$ Mn), by Wavelength, 2017–2027
Table 12: Europe Liquid Crystal Tunable Filters Market Volume (Million Units), by Wavelength, 2017–2027
Table 13: Europe Liquid Crystal Tunable Filters Market Revenue (US$ Mn), by Application, 2017–2027
Table 14: Europe Liquid Crystal Tunable Filters Market Revenue (US$ Mn), by Country/Sub-region, 2017–2027
Table 15: Europe Liquid Crystal Tunable Filters Market Volume (Million Units), by Country/Sub-region, 2017–2027
Table 16: APAC Liquid Crystal Tunable Filters Market Revenue (US$ Mn), by Wavelength, 2017–2027
Table 17: APAC Liquid Crystal Tunable Filters Market Volume (Million Units), by Wavelength, 2017–2027
Table 18: APAC Liquid Crystal Tunable Filters Market Revenue (US$ Mn), by Application, 2017–2027
Table 19: APAC Liquid Crystal Tunable Filters Market Revenue (US$ Mn), by Country/Sub-region, 2017–2027
Table 20: APAC Liquid Crystal Tunable Filters Market Volume (Million Units), by Country/Sub-region, 2017–2027
Table 21: MEA Liquid Crystal Tunable Filters Market Revenue (US$ Mn), by Wavelength, 2017–2027
Table 22: MEA Liquid Crystal Tunable Filters Market Volume (Million Units), by Wavelength, 2017–2027
Table 23: MEA Liquid Crystal Tunable Filters Market Revenue (US$ Mn), by Application, 2017–2027
Table 24: MEA Liquid Crystal Tunable Filters Market Revenue (US$ Mn), by Country/Sub-region, 2017–2027
Table 25: MEA Liquid Crystal Tunable Filters Market Volume (Million Units), by Country/Sub-region, 2017–2027
Table 26: South America Liquid Crystal Tunable Filters Market Revenue (US$ Mn), by Wavelength, 2017–2027
Table 27: South America Liquid Crystal Tunable Filters Market Volume (Million Units), by Wavelength, 2017–2027
Table 28: South America Liquid Crystal Tunable Filters Market Revenue (US$ Mn), by Application, 2017–2027
Table 29: South America Liquid Crystal Tunable Filters Market Revenue (US$ Mn), by Country/Sub-region, 2017–2027
Table 30: South America Liquid Crystal Tunable Filters Market Volume (Million Units), by Country/Sub-region, 2017–2027
List of Figures
Figure 1: Global Liquid Crystal Tunable Filters Market Revenue (US$ Mn) Forecast, 2017–2027
Figure 2: Global Liquid Crystal Tunable Filters Market Revenue (US$ Mn), 2017–2027
Figure 3: Global Liquid Crystal Tunable Filters Market Volume (Million Units), 2017–2027
Figure 4: Liquid Crystal Tunable Filters Market Value Share (Revenue), by Wavelength (2018)
Figure 5: Liquid Crystal Tunable Filters Market Value Share (Revenue), by Application (2018)
Figure 6: Liquid Crystal Tunable Filters Market Value Share (Revenue), by Region (2018)
Figure 7: Global Liquid Crystal Tunable Filters Market, by Wavelength, Visible (VIS) – 400 to 700 nm
Figure 8: Global Liquid Crystal Tunable Filters Market, by Wavelength, Near-infrared (NIR) – 780 to 2500 nm
Figure 9: Global Liquid Crystal Tunable Filters Market Comparison Matrix, by Wavelength
Figure 10: Global Liquid Crystal Tunable Filters Market Attractiveness Analysis, by Wavelength**
Figure 11: Global Liquid Crystal Tunable Filters Market, by Application, Agriculture
Figure 12: Global Liquid Crystal Tunable Filters Market, by Application, Medical
Figure 13: Global Liquid Crystal Tunable Filters Market, by Application, Military
Figure 14: Global Liquid Crystal Tunable Filters Market, by Application, Forensic
Figure 15: Global Liquid Crystal Tunable Filters Market, by Application, Chemical Spectroscopy
Figure 16: Global Liquid Crystal Tunable Filters Market, by Application, Semiconductor Process Control
Figure 17: Global Liquid Crystal Tunable Filters Market, by Application, Others
Figure 18: Global Liquid Crystal Tunable Filters Market Comparison Matrix, by Application
Figure 19: Global Liquid Crystal Tunable Filters Market Attractiveness Analysis, by Application**
Figure 20: Global Liquid Crystal Tunable Filters Market, by Region, North America
Figure 21: Global Liquid Crystal Tunable Filters Market, by Region, Europe
Figure 22: Global Liquid Crystal Tunable Filters Market, by Region, APAC
Figure 23: Global Liquid Crystal Tunable Filters Market, by Region, MEA
Figure 24: Global Liquid Crystal Tunable Filters Market, by Region, South America
Figure 25: Global Liquid Crystal Tunable Filters Market Attractiveness Analysis, by Region**
Figure 26: North America Market: Key Trend Impact Analysis
Figure 27: North America Liquid Crystal Tunable Filters Market Revenue (US$ Mn), 2017–2027
Figure 28: North America Liquid Crystal Tunable Filters Market Volume (Million Units), 2017–2027
Figure 29: North America Liquid Crystal Tunable Filters Market Attractiveness Analysis, by Wavelength**
Figure 30: North America Liquid Crystal Tunable Filters Market Revenue Share Analysis, by Wavelength
Figure 31: North America Liquid Crystal Tunable Filters Market Attractiveness Analysis, by Application**
Figure 32: North America Liquid Crystal Tunable Filters Market Revenue Share Analysis, by Application
Figure 33: North America Liquid Crystal Tunable Filters Market Attractiveness Analysis, by Country/Sub-region**
Figure 34: North America Liquid Crystal Tunable Filters Market Revenue Share Analysis, by Country/Sub-region
Figure 35: Europe Market: Key Trend Impact Analysis
Figure 36: Europe Liquid Crystal Tunable Filters Market Revenue (US$ Mn), 2017–2027
Figure 37: Europe Liquid Crystal Tunable Filters Market Volume (Million Units), 2017–2027
Figure 38: Europe Liquid Crystal Tunable Filters Market Attractiveness Analysis, by Wavelength**
Figure 39: Europe Liquid Crystal Tunable Filters Market Revenue Share Analysis, by Wavelength
Figure 40: Europe Liquid Crystal Tunable Filters Market Attractiveness Analysis, by Application**
Figure 41: Europe Liquid Crystal Tunable Filters Market Revenue Share Analysis, by Application
Figure 42: Europe Liquid Crystal Tunable Filters Market Attractiveness Analysis, by Country/Sub-region**
Figure 43: Europe Liquid Crystal Tunable Filters Market Revenue Share Analysis, by Country/Sub-region
Figure 44: Asia Pacific Market: Key Trend Impact Analysis
Figure 45: Asia Pacific Liquid Crystal Tunable Filters Market Revenue (US$ Mn), 2017–2027
Figure 46: Asia Pacific Liquid Crystal Tunable Filters Market Volume (Million Units), 2017–2027
Figure 47: Asia Pacific Liquid Crystal Tunable Filters Market Attractiveness Analysis, by Wavelength**
Figure 48: Asia Pacific Liquid Crystal Tunable Filters Market Revenue Share Analysis, by Wavelength
Figure 49: Asia Pacific Liquid Crystal Tunable Filters Market Attractiveness Analysis, by Application**
Figure 50: Asia Pacific Liquid Crystal Tunable Filters Market Revenue Share Analysis, by Application
Figure 51: Asia Pacific Liquid Crystal Tunable Filters Market Attractiveness Analysis, by Country/Sub-region**
Figure 52: Asia Pacific Liquid Crystal Tunable Filters Market Revenue Share Analysis, by Country/Sub-region
Figure 53: Middle East and Africa Market: Key Trend Impact Analysis
Figure 54: Middle East & Africa Liquid Crystal Tunable Filters Market Revenue (US$ Mn), 2017–2027
Figure 55: Middle East & Africa Liquid Crystal Tunable Filters Market Volume (Million Units), 2017–2027
Figure 56: Middle East & Africa Liquid Crystal Tunable Filters Market Attractiveness Analysis, by Wavelength**
Figure 57: Middle East & Africa Liquid Crystal Tunable Filters Market Revenue Share Analysis, by Wavelength
Figure 58: Middle East & Africa Liquid Crystal Tunable Filters Market Attractiveness Analysis, by Application**
Figure 59: Middle East & Africa Liquid Crystal Tunable Filters Market Revenue Share Analysis, by Application
Figure 60: Middle East & Africa Liquid Crystal Tunable Filters Market Attractiveness Analysis, by Country/Sub-region**
Figure 61: Middle East & Africa Liquid Crystal Tunable Filters Market Revenue Share Analysis, by Country/Sub-region
Figure 62: South America Market: Key Trend Impact Analysis
Figure 63: South America Liquid Crystal Tunable Filters Market Revenue (US$ Mn), 2017–2027
Figure 64: South America Liquid Crystal Tunable Filters Market Volume (Million Units), 2017–2027
Figure 65: South America Liquid Crystal Tunable Filters Market Attractiveness Analysis, by Wavelength**
Figure 66: South America Liquid Crystal Tunable Filters Market Revenue Share Analysis, by Wavelength
Figure 67: South America Liquid Crystal Tunable Filters Market Attractiveness Analysis, by Application**
Figure 68: South America Liquid Crystal Tunable Filters Market Revenue Share Analysis, by Application
Figure 69: South America Liquid Crystal Tunable Filters Market Attractiveness Analysis, by Country/Sub-region**
Figure 70: South America Liquid Crystal Tunable Filters Market Revenue Share Analysis, by Country/Sub-region
Copyright © Transparency Market Research, Inc. All Rights reserved
Trust Online

Liquid Crystal Tunable Filters Market