
Reports
Reports
Limestone is a sedimentary rock comprising calcium carbonate or the double carbonate of magnesium and calcium. A TMR study stated that the global limestone market is expected to grow at a compound annual growth rate (CAGR) of 6.1% during the forecast period 2017-2025. The valuation of the limestone market stood at US $ 321.5 Mn in 2016 and is estimated to reach US $ 545.7 Mn by 2025-end.
Iron and steel production are the primary end-uses of limestone. 2020 witnessed a steep decline in iron and steel production, but it is expected to rise in future and that, in turn, is likely to propel the limestone market worldwide. The rising infrastructural development worldwide has led to the construction industry becoming a key end-use segment for limestone and it is expected to be the leader in future, as well. Some of the uses of limestone in the construction segment include concrete, road base, and cement.
Limestone is extensively used as a building material as it provides aesthetics and strength and has become a desired option among architects and builders over time. Limestone is available in a number of finishes for usage in the construction industry such as red, brown, gold, and pink. Pure limestone, however, is white in color.
In agriculture, limestone helps to negate the extra acidity in soil, which could be caused by acid rain and thus make the conditions promising for crops or plants growth.
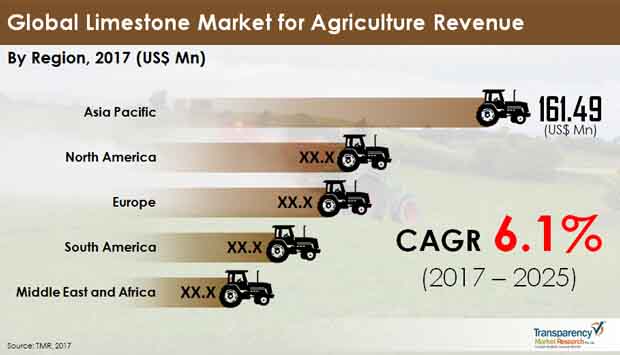
Asia Pacific has been the leader in the global limestone market for agriculture.
The massive arable land space and the increasing knowledge about utilizing non-toxic compounds have also played a crucial role in the growth of the limestone market in Asia Pacific. In addition to this, manufacturers, especially in the Southeast Asia region, have emphasized on expanding their business to this part of Asia Pacific, to explore the substantial business opportunities, which it offers. In 2017, Asia Pacific accounted for a total revenue of US $ 161.49 Mn.
To gain a competitive edge, limestone market players are increasing their production capabilities, especially in India and China, where land and labor are easily available and there is high demand.
North America is behind Asia Pacific, in terms of market share. Limestone utilization in agriculture is estimated to increase in Asia Pacific and North America because of its low price, as well as non-toxic nature of limestone
The limestone market is anticipated to increase at a CAGR of 5.6% during the forecast period in North America and is expected to generate a revenue of US $ 104.98 Mn by 2025. The limestone market in Europe is expected to grow at a CAGR of 4.2% and generate US $ 82.71 Mn, in terms of revenue, by 2025.
The global limestone market for agriculture is extremely fragmented. Based on product type, the limestone market for agriculture is classified into powdered and granular. The powdered limestone has dominated the market share because of the several benefits it offers such as being easily decomposable, leading to a faster pace of neutralization.
The powdered limestone can spread more efficiently on soil, in comparison to the granular variety that is applied to a restricted amount of space and is not easily decomposable owing to its rigid size and shape. Powdered limestone is also cheaper in comparison to granular limestone.
The limestone demand is anticipated to increase in future because of the improved infrastructure development worldwide. However, the emergence of the COVID-19 pandemic has severely impacted the globe and the limestone demand is also expected to be affected by the effects of the pandemic.
However, once global markets do try and resume normal operations, it is expected that demand would rise again and that could fuel growth in the limestone market in future.
Limestone Market for Agriculture is expected to reach US$545.7 mn by 2025
Limestone Market for Agriculture is estimated to rise at a CAGR of 6.1% during forecast period
Increased Awareness Regarding Benefits Of Limestone is expected to drive the Limestone Market for Agriculture
Asia Pacific is more attractive for vendors in the Limestone Market for Agriculture
Key players of Limestone Market for Agriculture are Leiths (Scotland) Ltd., Minerals Technologies Inc., Nordkalk Corporation, and Sibelco
1. Preface
1.1. Report Scope and Market Segmentation
1.2. Research Highlights
2. Assumptions and Research Methodology
2.1. Assumptions
2.2. Research Methodology
3. Executive Summary
3.1. Market Size, Global Limestone Market for Agriculture (US$ Mn)
3.2. Key Trends
4. Market Overview
4.1. Product Overview
4.2. Market Indicators
4.3. Market Dynamics
4.3.1. Drivers
4.3.2. Restraints
4.3.3. Opportunities
4.4. Porter’s Five Forces Analysis
4.4.1. Threat of Substitutes
4.4.2. Bargaining Power of Buyers
4.4.3. Bargaining Power of Suppliers
4.4.4. Threat of New Entrants
4.4.5. Degree of Competition
4.5. Value Chain Analysis
4.6. SWOT Analysis
4.7. List of Suppliers
5. Global Limestone Market for Agriculture Analysis, by Product
5.1. Key Findings
5.2. Introduction
5.3. Global Limestone Market for Agriculture Value Share Analysis, by Product
5.4. Global Limestone Market for Agriculture Market Attractiveness Analysis, by Product
6. Global Limestone Market for Agriculture Analysis by Region
6.1. Global Limestone Market for Agriculture Value Share Analysis, by Region
6.2. Global Limestone Market for Agriculture Market Attractiveness Analysis, by Region
7. North America Global Limestone Market for Agriculture Analysis
7.1. Key Findings
7.2. North America Limestone Market for Agriculture Overview
7.3. North America Limestone Market for Agriculture Size (US$ Mn) and Volume (Kilo Tons) Forecast, by Product , 2016–2025
7.4. North America Limestone Market for Agriculture Size (US$ Mn) and Volume (Kilo Tons) Forecast, by Country , 2015–2024
7.4.1. U.S. Limestone Market for Agriculture Forecast, by Product
7.4.2. Canada Limestone Market for Agriculture Forecast, by Product
7.4.3. Mexico Limestone Market for Agriculture Forecast, by Product
7.5. North America Limestone Market for Agriculture Attractiveness Overview
7.6. PEST Analysis
8. Europe Limestone Market for Agriculture Analysis
8.1. Key Findings
8.2. Europe Limestone Market for Agriculture Overview
8.3. Europe Limestone Market for Agriculture Size (US$ Mn) and Volume (Kilo Tons) Forecast, by Product , 2016–2025
8.4. Europe Limestone Market for Agriculture Size (US$ Mn) and Volume (Kilo Tons) Forecast, by Sub-Region , 2015–2024
8.4.1. Western Europe Limestone Market for Agriculture Forecast, by Product
8.4.2. Eastern Europe Limestone Market for Agriculture Forecast, by Product
8.5. Europe Limestone Market for Agriculture Attractiveness Overview
8.6. PEST Analysis
9. Southeast Asia Limestone Market for Agriculture Analysis
9.1. Key Findings
9.2. Southeast Asia Limestone Market for Agriculture Overview
9.3. Southeast Asia Limestone Market for Agriculture Size (US$ Mn) and Volume (Kilo Tons) Forecast, by Product , 2016–2025
9.4. Southeast Asia Limestone Market for Agriculture Size (US$ Mn) and Volume (Kilo Tons) Forecast, by Country , 2015–2024
9.4.1. India Limestone Market for Agriculture Forecast, by Product
9.4.2. Indonesia Limestone Market for Agriculture Forecast, by Product
9.4.3. Malaysia Limestone Market for Agriculture Forecast, by Product
9.4.4. Thailand Limestone Market for Agriculture Forecast, by Product
9.4.5. Vietnam Limestone Market for Agriculture Forecast, by Product
9.4.6. Myanmar Limestone Market for Agriculture Forecast, by Product
9.4.7. Philippines Limestone Market for Agriculture Forecast, by Product
9.5. Southeast Asia Limestone Market for Agriculture Attractiveness Overview
9.6. PEST Analysis
10. South America Limestone Market for Agriculture Analysis
10.1. Key Findings
10.2. South America Limestone Market for Agriculture Overview
10.3. South America Limestone Market for Agriculture Size (US$ Mn) and Volume (Kilo Tons) Forecast, by Product , 2016–2025
10.4. South America Limestone Market for Agriculture Size (US$ Mn) and Volume (Kilo Tons) Forecast, by Country , 2015–2024
10.4.1. Brazil Limestone Market for Agriculture Forecast, by Product
10.4.2. Columbia Limestone Market for Agriculture Forecast, by Product
10.4.3. Argentina Limestone Market for Agriculture Forecast, by Product
10.4.4. Chile Limestone Market for Agriculture Forecast, by Product
10.4.5. Peru Limestone Market for Agriculture Forecast, by Product
10.5. South America Limestone Market for Agriculture Attractiveness Overview
10.6. PEST Analysis
11. Competition Landscape
11.1. Market Share Analysis, by Company (2016)
11.2. Company Competition Matrix
11.3. Product Mapping
11.4. Company Profiles
11.4.1. Graymont Limited
11.4.1.1. Company Description
11.4.1.2. Business Overview
11.4.1.3. Strategic Overview
11.4.2. CALSPAR INDIA
11.4.2.1. Company Description
11.4.2.2. Business Overview
11.4.3. Lhoist
11.4.3.1. Company Description
11.4.3.2. Business Overview
11.4.3.3. Strategic Overview
11.4.4. Nordkalk Corporation
11.4.4.1. Company Description
11.4.4.2. Business Overview
11.4.4.3. Strategic Overview
11.4.5. Raw Edge Industrial Solutions Pvt. Ltd
11.4.5.1. Company Description
11.4.5.2. Business Overview
11.4.6. Sibelco
11.4.6.1. Company Description
11.4.6.2. Business Overview
11.4.7. ACG Materials
11.4.7.1. Company Description
11.4.7.2. Business Overview
11.4.8. Leiths (Scotland) Ltd
11.4.8.1. Company Description
11.4.8.2. Business Overview
11.4.9. Nittetsu Mining Co., Ltd.
11.4.9.1. Company Description
11.4.9.2. Business Overview
11.4.9.3. Strategic Overview
11.4.10. Minerals Technologies Inc.
11.4.10.1. Company Description
11.4.10.2. Business Overview
11.4.10.3. Strategic Overview
12. Key Insights
List of Tables
Table 01: Global Limestone Market for Agriculture Size (US$ Mn) Forecast, by Product , 2016–2025
Table 02: Global Limestone Market for Agriculture Volume (Kilo Tons) Forecast, by Product , 2016–2025
Table 03: Global Limestone Market for Agriculture Size (US$ Mn) Forecast, by Region, 2016–2025
Table 04: Global Limestone Market for Agriculture Volume (Kilo Tons) Forecast, by Region, 2016–2025
Table 05: North America Limestone Market for Agriculture Size (US$ Mn) Forecast, by Product , 2016–2025
Table 06: North America Limestone Market for Agriculture Volume (Kilo Tons) Forecast, by Product , 2016–2025
Table 07: North America Limestone Market for Agriculture Size (US$ Mn) Forecast, by Country, 2016–2025
Table 08: North America Limestone Market for Agriculture Volume (Kilo Tons) Forecast, by Country, 2016–2025
Table 09: U.S. Limestone Market for Agriculture Size (US$ Mn) Forecast, by Product , 2016–2025
Table 10: U.S. Limestone Market for Agriculture Volume (Kilo Tons) Forecast, by Product , 2016–2025
Table 11: U.S. Limestone Price Analysis (US$/Tons) (2016–2025)
Table 12: Canada Limestone Market for Agriculture Size (US$ Mn) Forecast, by Product , 2016–2025
Table 13: Canada Limestone Market for Agriculture Volume (Kilo Tons) Forecast, by Product , 2016–2025
Table 14: Canada Limestone Price Analysis (US$/Tons) (2016–2025)
Table 15: Mexico Limestone Market for Agriculture Size (US$ Mn) Forecast, by Product , 2016–2025
Table 16: Mexico Limestone Market for Agriculture Volume (Kilo Tons) Forecast, by Product , 2016–2025
Table 17: Mexico Limestone Price Analysis (US$/Tons) (2016-2025)
Table 18: Europe Limestone Market for Agriculture Size (US$ Mn) Forecast, by Product, 2016–2025
Table 19: Europe Limestone Market for Agriculture Size (US$ Mn) Forecast, by Product, 2016–2025
Table 20: Europe Limestone Market for Agriculture Size (US$ Mn) Forecast, by Sub-Region, 2016–2025
Table 21: Europe Limestone Market for Agriculture Volume (Kilo Tons) Forecast, by Sub-Region, 2016–2025
Table 22: Western Europe Limestone Market for Agriculture Size (US$ Mn) Forecast, by Product , 2016–2025
Table 23: Western Europe Limestone Market for Agriculture Volume (Kilo Tons) Forecast, by Product , 2016–2025
Table 24: Western Europe Limestone Price Analysis (US$/Tons) (2016–2025)
Table 25: Eastern Europe Limestone Market for Agriculture Size (US$ Mn) Forecast, by Product , 2016–2025
Table 26: Eastern Europe Limestone Market for Agriculture Volume (Kilo Tons) Forecast, by Product , 2016–2025
Table 27: Eastern Europe Limestone Price Analysis (US$/Tons) (2016–2025)
Table 28: Southeast Asia Limestone Market for Agriculture Size (US$ Mn) Forecast, by Product, 2016–2025
Table 29: Southeast Asia Limestone Market for Agriculture Size (Kilo Tons) Forecast, by Product, 2016–2025
Table 30: Southeast Asia Limestone Market for Agriculture Size (US$ Mn) & (Kilo Tons) Forecast, by Country, 2016–2025
Table 31: India Limestone Market for Agriculture Size (US$ Mn) Forecast, by Product, 2016–2025
Table 32: India Limestone Market for Agriculture Volume (Kilo Tons) Forecast, by Product, 2016–2025
Table 33: India Limestone Price Analysis (US$/Ton) (2016–2025)
Table 34: Indonesia Limestone Market for Agriculture Size (US$ Mn) Forecast, by Product, 2016–2025
Table 35: Indonesia Market for Agriculture Volume (Kilo Tons) Forecast, by Product, 2016–2025
Table 36: Indonesia Limestone Price Analysis (US$/Ton) (2016–2025)
Table 37: Malaysia Limestone Market for Agriculture Size (US$ Mn) Forecast, by Product, 2016–2025
Table 38: Malaysia Limestone Market for Agriculture Volume (Kilo Tons) Forecast, by Product, 2016–2025
Table 39: Malaysia Limestone Price Analysis (US$/Ton) (2016–2025)
Table 40: Thailand Limestone Market for Agriculture Size (US$ Mn) Forecast, by Product, 2016–2025
Table 41: Thailand Limestone Market for Agriculture Volume (Kilo Tons) Forecast, by Product, 2016–2025
Table 42: Thailand Limestone Price Analysis (US$/Ton) (2016–2025)
Table 43: Vietnam Limestone Market for Agriculture Size (US$ Mn) Forecast, by Product, 2016–2025
Table 44: Vietnam Limestone Market for Agriculture Volume (Kilo Tons) Forecast, by Product, 2016–2025
Table 45: Vietnam Limestone Price Analysis (US$/Ton) (2016–2025)
Table 46: Myanmar Limestone Market for Agriculture Size (US$ Mn) Forecast, by Product, 2016–2025
Table 47: Myanmar Limestone Market for Agriculture Volume (Kilo Tons) Forecast, by Product, 2016–2025
Table 48: Myanmar Limestone Price Analysis (US$/Ton) (2016–2025)
Table 49: Philippines Limestone Market for Agriculture Size (US$ Mn) Forecast, by Product, 2016–2025
Table 50: Philippines Limestone Market for Agriculture Volume (Kilo Tons) Forecast, by Product, 2016–2025
Table 51: Philippines Limestone Price Analysis (US$/Ton) (2016–2025)
Table 52: South America Limestone Market for Agriculture Size (US$ Mn) Forecast, by Product, 2016–2025
Table 53: South America Limestone Market for Agriculture Size (US$ Mn) Forecast, by Product, 2016–2025
Table 54: South America Limestone Market for Agriculture Size (US$ Mn) Forecast, by Country, 2016–2025
Table 55: South America Limestone Market for Agriculture (Kilo Tons) Forecast, by Country, 2016–2025
Table 56: Brazil Limestone Market for Agriculture Size (US$ Mn) Forecast, by Product, 2016–2025
Table 57: Brazil Limestone Market for Agriculture Volume (Kilo Tons) Forecast, by Product, 2016–2025
Table 58: Brazil Limestone Price Analysis (US$/Tons) (2016–2025)
Table 59: Colombia Limestone Market for Agriculture Size (US$ Mn) Forecast, by Product, 2016–2025
Table 60: Colombia Limestone Market for Agriculture Volume (Kilo Tons) Forecast, by Product, 2016–20250
Table 61: Colombia Limestone Price Analysis (US$/Tons) (2016–2025)
Table 62: Argentina Limestone Market for Agriculture Size (US$ Mn) Forecast, by Product, 2016–2025
Table 63: Argentina Limestone Market for Agriculture Volume (Kilo Tons) Forecast, by Product, 2016–2025
Table 64: Argentina Limestone Price Analysis (US$/Tons) (2016–2025)
Table 65: Chile Limestone Market for Agriculture Size (US$ Mn) Forecast, by Product, 2016–2025
Table 66: Chile Limestone Market for Agriculture Volume (Kilo Tons) Forecast, by Product, 2016–2025
Table 67: Chile Limestone Price Analysis (US$/Tons) (2016–2025)
Table 68: Peru Limestone Market for Agriculture Size (US$ Mn) Forecast, by Product, 2016–2025
Table 69: Peru Limestone Market for Agriculture Volume (Kilo Tons) Forecast, by Product, 2016–2025
Table 70: Peru Limestone Price Analysis (US$/Ton) (2016–2025)
List of Figures
Figure 01 : Global Limestone Market for Agriculture, Revenue (US$ Mn), 2016–2025
Figure 02: Global Limestone Market for Agriculture Value Share Analysis, by Product, 2016 and 2025
Figure 03: Global Limestone Market for Agriculture Attractiveness Analysis, by Product, 2016
Figure 04: Global Limestone Market for Agriculture Size (US$ Mn) and Market Volume (Kilo Tons) Analysis, by Normal, 2016–2025
Figure 05: Global Limestone Market for Agriculture Size (US$ Mn) and Market Volume (Kilo Tons) Analysis, by Granulized/Palletized, 2016–2025
Figure 06: Global Limestone for Agriculture Market Value Share Analysis, by Region, 2016 and 2025
Figure 07: Global Limestone Market for Agriculture Attractiveness Analysis, by Region, 2016
Figure 08: North America Limestone Market for Agriculture Size (US$ Mn) and Market Volume (Kilo Tons) Analysis, 2016–2025
Figure 09: North America Market Attractiveness Analysis, by Country, 2016
Figure 10: North America Market Value Share Analysis, by Product, 2016 and 2025
Figure 11: North America Limestone Market for Agriculture Attractiveness Analysis, by Product, 2016
Figure 12: North America Market Value Share Analysis, by Country, 2016 and 2025
Figure 13: U.S. Limestone Market for Agriculture Size (US$ Mn) Forecast, 2016–2025
Figure 14: U.S. Limestone Market for Agriculture Volume (Kilo Tons) Forecast, 2016–2025
Figure 15: Canada Limestone Market for Agriculture Size (US$ Mn) Forecast, 2016–2025
Figure 16: Canada Limestone Market for Agriculture Volume (Kilo Tons) Forecast, 2016–2025
Figure 17: Mexico Limestone Market for Agriculture Size (US$ Mn) Forecast, 2016–2025
Figure 18: Mexico Limestone Market for Agriculture Volume (Kilo Tons) Forecast, 2016–2025
Figure 19: Europe Limestone Market for Agriculture Size (US$ Mn) and Market Volume (Kilo Tons) Analysis, 2016–2025
Figure 20: Europe Market Attractiveness Analysis, by Country, 2016
Figure 21: Europe Market Value Share Analysis, by Product, 2016 and 2025
Figure 22: Europe Limestone Market for Agriculture Attractiveness Analysis, by Product, 2016
Figure 23: Europe Market Value Share Analysis, by Sub-region, 2016 and 2025
Figure 24: Western Europe Limestone Market for Agriculture Size (US$ Mn) Forecast, 2016–2025
Figure 25: Western Europe Limestone Market for Agriculture Volume (Kilo Tons) Forecast, 2016–2025
Figure 26: Eastern Europe Limestone Market for Agriculture Size (US$ Mn) Forecast, 2016–2025
Figure 27: Eastern Europe Limestone Market for Agriculture Volume (Kilo Tons) Forecast, 2016–2025
Figure 28: Southeast Asia Limestone Market for Agriculture Size (US$ Mn) and Market Volume (Kilo Tons) Analysis, 2016–2025
Figure 29: Southeast Asia Market Attractiveness Analysis, by Country, 2016
Figure 30: Southeast Asia Market Value Share Analysis, by Product, 2016 and 2025
Figure 31: Southeast Asia Limestone Market for Agriculture Attractiveness Analysis, by Product, 2016
Figure 32: Southeast Asia Market Value Share Analysis, by Country, 2016 and 2025
Figure 33: India Limestone Market for Agriculture Size (US$ Mn) Forecast, 2016–2025
Figure 34: India Limestone Market for Agriculture Volume (Kilo Tons) Forecast, 2016–2025
Figure 35: Indonesia Limestone Market for Agriculture Size (US$ Mn) Forecast, 2016–2025
Figure 36: Indonesia Limestone Market for Agriculture Volume (Kilo Tons) Forecast, 2016–2025
Figure 37: Malaysia Limestone Market for Agriculture Size (US$ Mn) Forecast, 2016–2025
Figure 38: Malaysia Limestone Market for Agriculture Volume (Kilo Tons) Forecast, 2016–2025
Figure 39: Thailand Limestone Market for Agriculture Size (US$ Mn) Forecast, 2016–2025
Figure 40: Thailand Limestone Market for Agriculture Volume (Kilo Tons) Forecast, 2016–2025
Figure 41: Vietnam Limestone Market for Agriculture Size (US$ Mn) Forecast, 2016–2025
Figure 42: Vietnam Limestone Market for Agriculture Volume (Kilo Tons) Forecast, 2016–2025
Figure 43: Myanmar Limestone Market for Agriculture Size (US$ Mn) Forecast, 2016–2025
Figure 44: Myanmar Limestone Market for Agriculture Volume (Kilo Tons) Forecast, 2016–2025
Figure 45: Philippines Limestone Market for Agriculture Size (US$ Mn) Forecast, 2016–2025
Figure 46: Philippines Limestone Market for Agriculture Volume (Kilo Tons) Forecast, 2016–2025
Figure 47: South America Limestone Market for Agriculture Size (US$ Mn) and Market Volume (Kilo Tons) Analysis, 2016–2025
Figure 48: South America Market Attractiveness Analysis, by Country, 2016
Figure 49: South America Market Value Share Analysis, by Product, 2016 and 2025
Figure 50: South America Limestone Market for Agriculture Attractiveness Analysis, by Product, 2016
Figure 51: South America Market Value Share Analysis, by Country, 2016 and 2025
Figure 52: Brazil Limestone Market for Agriculture Size (US$ Mn) Forecast, 2016–2025
Figure 53: Brazil Limestone Market for Agriculture Volume (Kilo Tons) Forecast, 2016–2025
Figure 54: Colombia Limestone Market for Agriculture Size (US$ Mn) Forecast, 2016–2025
Figure 55: Colombia Limestone Market for Agriculture Volume (Kilo Tons) Forecast, 2016–2025
Figure 56: Argentina Limestone Market for Agriculture Size (US$ Mn) Forecast, 2016–2025
Figure 57: Argentina Limestone Market for Agriculture Volume (Kilo Tons) Forecast, 2016–2025
Figure 58: Chile Limestone Market for Agriculture Size (US$ Mn) Forecast, 2016–2025
Figure 59: Chile Limestone Market for Agriculture Volume (Kilo Tons) Forecast, 2016–2025
Figure 60: Peru Limestone Market for Agriculture Size (US$ Mn) Forecast, 2016–2025
Figure 61: Peru Limestone Market for Agriculture Volume (Kilo Tons) Forecast, 2016–2025
Figure 62: Limestone Market for Agriculture Share Analysis, by Company
Copyright © Transparency Market Research, Inc. All Rights reserved
Trust Online

Limestone Market Analysis, 2017-2025