
Reports
Reports
Analysts’ Viewpoint on Lead-acid Battery Scrap Market Scenario
Lead-acid batteries are the most commonly used large-capacity rechargeable batteries due to their dependable and inexpensive nature. Globally, about 75% of lead is primarily employed in batteries that are used in industrial and automotive applications such as vehicles, uninterruptible power supplies, and solar power storage. Rise in demand for passenger vehicles is expected to propel the global lead-acid battery scrap market during the forecast period. New chemistries in the sealed lead-acid battery scrap landscape are augmenting the reuse of materials derived from lead-acid batteries. However, segregation of lead-acid battery scrap is prone to various health risks; therefore, it must adhere to stringent environmental regulations. These limitations may negatively impact the market growth.
Lead–acid battery scrap are materials extracted from waste/used batteries that are either drained or disposed of after use. More than 95% of lead–acid battery scrap is recyclable and can be reused in the production of new lead–acid batteries and plastics. Various countries in North America and the European Union have achieved about 99%–100% rate of recycling of lead–acid batteries and gel batteries. Drained lead-acid battery scrap is sold in bulk. Lead-acid battery scrap prices fluctuate daily due to various factors such as seasons and region of operation. Fluctuations can be affected by seasonal changes, as some industries may slow down their production in the winter and increase it in the summer. In the U.K., the scrap value of lead-acid batteries is low and anywhere between £300 – £600 per ton due to the wide availability of lead-acid batteries in the region.
Lead is a key raw material used in the manufacture of lead–acid batteries. The metal poses high threat to the environment and human life. Improper disposal of batteries in landfills can cause contamination of groundwater and surface water sources with lead. Thus, players in the global lead-acid battery scrap market are taking initiatives to recycle batteries. The commercial value obtained from recycling of lead–acid batteries is also high, as batteries comprise about 70% to 100% of recyclable lead. Lead is non-renewable; however, it can be recycled indefinite number of times. This results in a constant supply of lead from used batteries.
Non-profit organizations are collaborating with automotive companies to increase awareness about battery recycling, thereby boosting the flow of lead–acid battery scrap for recycling purposes. Thus, growth in awareness about environment and health-related hazards is expected to drive the global lead–acid battery scrap market during the forecast period.
In terms of recovery rate, lead is one of the most recycled materials across the globe. Currently, recycled lead accounts for more than 50% share in terms of production of new lead products. Used lead batteries have 100% recovery rate, while newspapers have 63%; aluminum cans have 55%; tires have 41%; glass containers have 33%; and polyethylene terephthalate (PET) bottles have 32% rate of recovery. Around 75% of lead is employed in the production of lead–acid batteries across the globe; nearly 100% of this is easily recoverable and recyclable.
Recycling and reuse of lead-acid batteries can help reduce carbon dioxide emissions. These batteries can find application in hybrid and electric vehicles, smart grids, and wind and solar farms. Thus, the ability to recover 100% lead and other useful materials from lead–acid batteries is anticipated to fuel the global lead–acid battery scrap market during the forecast period.
Based on source, the motor vehicle segment held major share of 57.62% of the global lead-acid battery scrap market in 2021. The segment is expected to maintain its dominance during the forecast period. Growth of the segment can be ascribed to the increase in the sale of vehicles. The global vehicle sales stood at 82.6 million in 2021.
The motor vehicle segment includes cars, motorcycles, scooters, electric vehicles, and others. Lead-acid batteries power horns, starters, side indicators, and other components of vehicles. Rise in production of automobiles and regular replacement of batteries after every three to five years are likely to generate a large amount of lead-acid battery scrap.
Based on product, the global lead-acid battery scrap market has been segmented into lead, sulfuric acid, and others. The lead segment accounted for 70.2% share of the market in 2021. The segment is expected to grow at a significant pace during the forecast period, as batteries use 85% of the lead produced worldwide.
The sulfuric acid segment is projected to advance at a CAGR of 10.30% during the forecast period. Around 25% of sulfuric acid is used in the construction of lead-acid batteries.
Asia Pacific accounted for the largest share of 44.9% of the global lead-acid battery scrap market in 2021. The market in the region is anticipated to create an incremental opportunity of US$ 4.9 Bn during the forecast period. This can be primarily ascribed to the increase in awareness about environmental pollution and availability of labor at lower cost in the region. The market in Europe is expected to witness significant growth during the forecast period due to the implementation of stringent environmental regulations and rise in adoption of electric vehicles in the region.
The global lead-acid battery scrap market comprises several small and large-scale manufacturers and suppliers that control majority of the share. Most firms are adopting new technologies and strategies with comprehensive research and development activities, primarily to increase flexibility and manufacturing operations. Expansion of product portfolio and mergers & acquisitions are major strategies adopted by key players. Johnson Controls International PLC, Gravita India Ltd., EnerSys, Exide Industries Ltd., Systems Sunlight S.A., Aqua Metals Inc., Battery Solutions LLC, Amidt Group, Duracell Inc., Engitec Technologies SpA, Ecobat Technologies Ltd, Bee'ah Sharjah Environment Company LLC, Madenat Al Nokhba Recycling Services LLC, and EnviroServe are prominent entities operating in the market.
Each of these players has been profiled in the lead-acid battery scrap market report based on parameters such as company overview, financial overview, business strategies, product portfolio, business segments, and recent developments.
|
Attribute |
Detail |
|
Market Size Value in 2021 |
US$ 10.6 Bn |
|
Market Forecast Value in 2031 |
US$ 28.8 Bn |
|
Growth Rate (CAGR) |
10.47% |
|
Forecast Period |
2022–2031 |
|
Historical Data Available for |
2020 |
|
Quantitative Units |
US$ Bn for Value and Kilo Tons for Volume |
|
Market Analysis |
It includes cross-segment analysis at the global as well as country levels. Furthermore, the qualitative analysis includes drivers, restraints, opportunities, key trends, Porter’s Five Forces analysis, value chain analysis, and key trend analysis. |
|
Competition Landscape |
|
|
Format |
Electronic (PDF) + Excel |
|
Market Segmentation |
|
|
Regions Covered |
|
|
Countries Covered |
|
|
Companies Profiled |
|
|
Customization Scope |
Available upon request |
|
Pricing |
Available upon request |
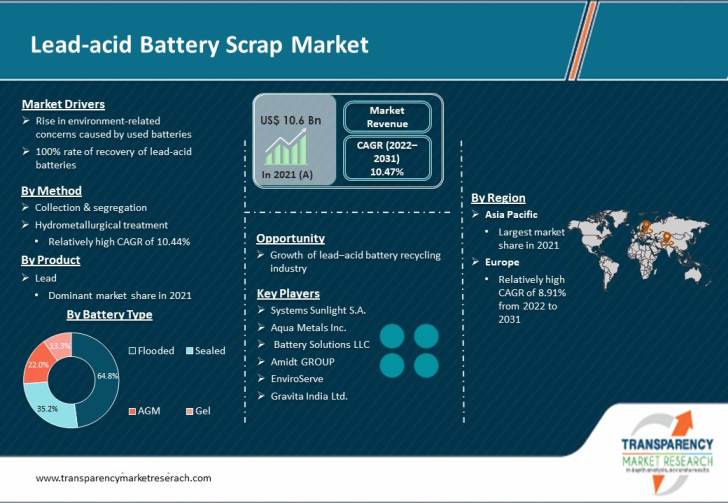
The global lead-acid battery scrap market stood at US$ 10.6 Bn in 2021
The global lead-acid battery scrap market is expected to advance at a CAGR of 10.47% from 2022 to 2031
Rise in environment-related concerns caused by used batteries and 100% rate of recovery of lead-acid batteries
Motor vehicle was the largest source segment that held 57.62% share of the market in 2021
Asia Pacific was the most lucrative region of the lead-acid battery scrap market in 2021
Johnson Controls International PLC, Gravita India Ltd., EnerSys, Exide Industries Ltd., Systems Sunlight S.A., Aqua Metals Inc., Battery Solutions LLC, Amidt Group, Duracell Inc., Engitec Technologies SpA, Ecobat Technologies Ltd, Bee'ah Sharjah Environment Company LLC, Madenat Al Nokhba Recycling Services LLC, and EnviroServe
1. Executive Summary
1.1. Lead-acid Battery Scrap Market Snapshot
1.2. Current Market and Future Potential
2. Market Overview
2.1. Market Segmentation
2.2. Market Trends
2.3. Market Dynamics
2.3.1. Drivers
2.3.2. Restraints
2.3.3. Opportunities
2.4. Porter’s Five Forces Analysis
2.5. Regulatory Analysis
2.6. Value Chain Analysis
2.6.1. List of Raw Battery Type Providers
2.6.2. List of Manufacturers
2.6.3. List of Dealers/Distributors
2.6.4. List of Potential Customers
3. COVID-19 Impact Analysis
4. Production Output Analysis, 2022
5. Price Trend Analysis
6. Global Lead-acid Battery Scrap Market Analysis and Forecast, by Battery Type, 2022–2031
6.1. Introduction and Definitions
6.2. Global Lead-acid Battery Scrap Market Volume (Tons) and Value (US$ Mn) Forecast, by Battery Type, 2022–2031
6.2.1. Flooded
6.2.2. Sealed
6.2.3. AGM
6.2.4. Gel
6.3. Global Lead-acid Battery Scrap Market Attractiveness, by Battery Type
7. Global Lead-acid Battery Scrap Market Analysis and Forecast, by Product, 2022–2031
7.1. Introduction and Definitions
7.2. Global Lead-acid Battery Scrap Market Volume (Tons) and Value (US$ Mn) Forecast, by Product, 2022–2031
7.2.1. Lead
7.2.2. Sulfuric Acid
7.2.3. Others
7.3. Global Lead-acid Battery Scrap Market Attractiveness, by Product
8. Global Lead-acid Battery Scrap Market Analysis and Forecast, by Source, 2022–2031
8.1. Introduction and Definitions
8.2. Global Lead-acid Battery Scrap Market Volume (Tons) and Value (US$ Mn) Forecast, by Source, 2022–2031
8.2.1. Motor Vehicle
8.2.2. UPS
8.2.3. Telecom Station
8.2.4. Electric Power Industry
8.2.5. Watercraft
8.2.6. Aircraft
8.2.7. Military
8.2.8. Oil & Gas Industry
8.2.9. Stand-Alone Systems
8.2.10. Others
8.3. Global Lead-acid Battery Scrap Market Attractiveness, by Source
9. Global Lead-acid Battery Scrap Market Analysis and Forecast, by Method, 2022–2031
9.1. Introduction and Definitions
9.2. Global Lead-acid Battery Scrap Market Value (US$ Mn) Forecast, by Method, 2022–2031
9.2.1. Collection & Segregation
9.2.2. Hydrometallurgical Treatment
9.2.3. Pyrometallurgical Treatment
9.2.4. Neutralization of Acid
9.3. Global Lead-acid Battery Scrap Market Attractiveness, by Method
10. Global Lead-acid Battery Scrap Market Analysis and Forecast, by Region, 2022–2031
10.1. Key Findings
10.2. Global Lead-acid Battery Scrap Market Volume (Tons) and Value (US$ Mn) Forecast, by Region, 2022–2031
10.2.1. North America
10.2.2. Europe
10.2.3. Asia Pacific
10.2.4. Latin America
10.2.5. Middle East and Africa
10.3. Global Lead-acid Battery Scrap Market Attractiveness, by Region
11. North America Lead-acid Battery Scrap Market Analysis and Forecast, 2022–2031
11.1. Key Findings
11.2. North America Lead-acid Battery Scrap Market Volume (Tons) and Value (US$ Mn) Forecast, by Battery Type, 2022–2031
11.3. North America Lead-acid Battery Scrap Market Volume (Tons) and Value (US$ Mn) Forecast, by Product, 2022–2031
11.4. North America Lead-acid Battery Scrap Market Volume (Tons) and Value (US$ Mn) Forecast, by Source, 2022–2031
11.5. North America Lead-acid Battery Scrap Market Value (US$ Mn) Forecast, by Method, 2022–2031
11.6. North America Lead-acid Battery Scrap Market Volume (Tons) and Value (US$ Mn) Forecast, by Country, 2022–2031
11.6.1. U.S. Lead-acid Battery Scrap Market Volume (Tons) and Value (US$ Mn) Forecast, by Battery Type, 2022–2031
11.6.2. U.S. Lead-acid Battery Scrap Market Volume (Tons) and Value (US$ Mn) Forecast, by Product, 2022–2031
11.6.3. U.S. Lead-acid Battery Scrap Market Volume (Tons) and Value (US$ Mn) Forecast, by Source, 2022–2031
11.6.4. U.S. Lead-acid Battery Scrap Market Value (US$ Mn) Forecast, by Method, 2022–2031
11.6.5. Canada Lead-acid Battery Scrap Market Volume (Tons) and Value (US$ Mn) Forecast, by Battery Type, 2022–2031
11.6.6. Canada Lead-acid Battery Scrap Market Volume (Tons) and Value (US$ Mn) Forecast, by Product, 2022–2031
11.6.7. Canada Lead-acid Battery Scrap Market Volume (Tons) and Value (US$ Mn) Forecast, by Source, 2022–2031
11.6.8. Canada Lead-acid Battery Scrap Market Value (US$ Mn) Forecast, by Method, 2022–2031
11.7. North America Lead-acid Battery Scrap Market Attractiveness Analysis
12. Europe Lead-acid Battery Scrap Market Analysis and Forecast, 2022–2031
12.1. Key Findings
12.2. Europe Lead-acid Battery Scrap Market Volume (Tons) and Value (US$ Mn) Forecast, by Battery Type, 2022–2031
12.3. Europe Lead-acid Battery Scrap Market Volume (Tons) and Value (US$ Mn) Forecast, by Product, 2022–2031
12.4. Europe Lead-acid Battery Scrap Market Volume (Tons) and Value (US$ Mn) Forecast, by Source, 2022–2031
12.5. Europe Lead-acid Battery Scrap Market Value (US$ Mn) Forecast, by Method, 2022–2031
12.6. Europe Lead-acid Battery Scrap Market Volume (Tons) and Value (US$ Mn) Forecast, by Country and Sub-region, 2022-2031
12.6.1. Germany Lead-acid Battery Scrap Market Volume (Tons) and Value (US$ Mn) Forecast, by Battery Type, 2022–2031
12.6.2. Germany Lead-acid Battery Scrap Market Volume (Tons) and Value (US$ Mn) Forecast, by Product, 2022–2031
12.6.3. Germany Lead-acid Battery Scrap Market Volume (Tons) and Value (US$ Mn) Forecast, by Source, 2022–2031
12.6.4. Germany Lead-acid Battery Scrap Market Value (US$ Mn) Forecast, by Method, 2022–2031
12.6.5. France Lead-acid Battery Scrap Market Volume (Tons) and Value (US$ Mn) Forecast, by Battery Type, 2022–2031
12.6.6. France Lead-acid Battery Scrap Market Volume (Tons) and Value (US$ Mn) Forecast, by Product, 2022–2031
12.6.7. France Lead-acid Battery Scrap Market Volume (Tons) and Value (US$ Mn) Forecast, by Source, 2022–2031
12.6.8. France Lead-acid Battery Scrap Market Value (US$ Mn) Forecast, by Method, 2022–2031
12.6.9. U.K. Lead-acid Battery Scrap Market Volume (Tons) and Value (US$ Mn) Forecast, by Battery Type, 2022–2031
12.6.10. U.K. Lead-acid Battery Scrap Market Volume (Tons) and Value (US$ Mn) Forecast, by Product, 2022–2031
12.6.11. U.K. Lead-acid Battery Scrap Market Volume (Tons) and Value (US$ Mn) Forecast, by Source, 2022–2031
12.6.12. U.K. Lead-acid Battery Scrap Market Value (US$ Mn) Forecast, by Method, 2022–2031
12.6.13. Italy Lead-acid Battery Scrap Market Volume (Kilo Tons) Forecast, by Battery Type, 2022–2031
12.6.14. Italy Lead-acid Battery Scrap Market Volume (Tons) and Value (US$ Mn) Forecast, by Product, 2022–2031
12.6.15. Italy Lead-acid Battery Scrap Market Volume (Tons) and Value (US$ Mn) Forecast, by Source, 2022–2031
12.6.16. Italy Lead-acid Battery Scrap Market Value (US$ Mn) Forecast, by Method, 2022–2031
12.6.17. Spain Lead-acid Battery Scrap Market Volume (Tons) and Value (US$ Mn) Forecast, by Battery Type, 2022–2031
12.6.18. Spain Lead-acid Battery Scrap Market Volume (Tons) and Value (US$ Mn) Forecast, by Product, 2022–2031
12.6.19. Spain Lead-acid Battery Scrap Market Volume (Tons) and Value (US$ Mn) Forecast, by Source, 2022–2031
12.6.20. Spain Lead-acid Battery Scrap Market Value (US$ Mn) Forecast, by Method, 2022–2031
12.6.21. Russia & CIS Lead-acid Battery Scrap Market Volume (Tons) and Value (US$ Mn) Forecast, by Battery Type, 2022–2031
12.6.22. Russia & CIS Lead-acid Battery Scrap Market Volume (Tons) and Value (US$ Mn) Forecast, by Product, 2022–2031
12.6.23. Russia & CIS Lead-acid Battery Scrap Market Volume (Tons) and Value (US$ Mn) Forecast, by Source, 2022–2031
12.6.24. Russia Lead-acid Battery Scrap Market Value (US$ Mn) Forecast, by Method, 2022–2031
12.6.25. Rest of Europe Lead-acid Battery Scrap Market Volume (Tons) and Value (US$ Mn) Forecast, by Battery Type, 2022–2031
12.6.26. Rest of Europe Lead-acid Battery Scrap Market Volume (Tons) and Value (US$ Mn) Forecast, by Product, 2022–2031
12.6.27. Rest of Europe Lead-acid Battery Scrap Market Volume (Tons) and Value (US$ Mn) Forecast, by Source, 2022–2031
12.6.28. Rest of Europe Lead-acid Battery Scrap Market Value (US$ Mn) Forecast, by Method, 2022–2031
12.7. Europe Lead-acid Battery Scrap Market Attractiveness Analysis
13. Asia Pacific Lead-acid Battery Scrap Market Analysis and Forecast, 2022–2031
13.1. Key Findings
13.2. Asia Pacific Lead-acid Battery Scrap Market Volume (Tons) and Value (US$ Mn) Forecast, by Battery Type
13.3. Asia Pacific Lead-acid Battery Scrap Market Volume (Tons) and Value (US$ Mn) Forecast, by Product, 2022–2031
13.4. Asia Pacific Lead-acid Battery Scrap Market Volume (Tons) and Value (US$ Mn) Forecast, by Source, 2022–2031
13.5. Asia Pacific Lead-acid Battery Scrap Market Value (US$ Mn) Forecast, by Method, 2022–2031
13.6. Asia Pacific Lead-acid Battery Scrap Market Volume (Tons) and Value (US$ Mn) Forecast, by Country and Sub-region, 2022-2031
13.6.1. China Lead-acid Battery Scrap Market Volume (Tons) and Value (US$ Mn) Forecast, by Battery Type, 2022–2031
13.6.2. China Lead-acid Battery Scrap Market Volume (Tons) and Value (US$ Mn) Forecast, by Product, 2022–2031
13.6.3. China Lead-acid Battery Scrap Market Volume (Tons) and Value (US$ Mn) Forecast, by Source, 2022–2031
13.6.4. China Lead-acid Battery Scrap Market Value (US$ Mn) Forecast, by Method, 2022–2031
13.6.5. Japan Lead-acid Battery Scrap Market Volume (Tons) and Value (US$ Mn) Forecast, by Battery Type, 2022–2031
13.6.6. Japan Lead-acid Battery Scrap Market Volume (Tons) and Value (US$ Mn) Forecast, by Product, 2022–2031
13.6.7. Japan Lead-acid Battery Scrap Market Volume (Tons) and Value (US$ Mn) Forecast, by Source, 2022–2031
13.6.8. Japan Lead-acid Battery Scrap Market Value (US$ Mn) Forecast, by Method, 2022–2031
13.6.9. India Lead-acid Battery Scrap Market Volume (Tons) and Value (US$ Mn) Forecast, by Battery Type, 2022–2031
13.6.10. India Lead-acid Battery Scrap Market Volume (Tons) and Value (US$ Mn) Forecast, by Product, 2022–2031
13.6.11. India Lead-acid Battery Scrap Market Volume (Tons) and Value (US$ Mn) Forecast, by Source, 2022–2031
13.6.12. India Lead-acid Battery Scrap Market Value (US$ Mn) Forecast, by Method, 2022–2031
13.6.13. ASEAN Lead-acid Battery Scrap Market Volume (Tons) and Value (US$ Mn) Forecast, by Battery Type, 2022–2031
13.6.14. ASEAN Lead-acid Battery Scrap Market Volume (Tons) and Value (US$ Mn) Forecast, by Product, 2022–2031
13.6.15. ASEAN Lead-acid Battery Scrap Market and Volume (Tons) and Value (US$ Mn) Forecast, by Source, 2022–2031
13.6.16. ASEAN Lead-acid Battery Scrap Market Value (US$ Mn) Forecast, by Method, 2022–2031
13.6.17. Rest of Asia Pacific Lead-acid Battery Scrap Market Volume (Tons) and Value (US$ Mn) Forecast, by Battery Type, 2022–2031
13.6.18. Rest of Asia Pacific Lead-acid Battery Scrap Market Volume (Tons) and Value (US$ Mn) Forecast, by Product, 2022–2031
13.6.19. Rest of Asia Pacific Lead-acid Battery Scrap Market Volume (Tons) and Value (US$ Mn) Forecast, by Source, 2022–2031
13.6.20. Rest of Asia Pacific Lead-acid Battery Scrap Market Value (US$ Mn) Forecast, by Method, 2022–2031
13.7. Asia Pacific Lead-acid Battery Scrap Market Attractiveness Analysis
14. Middle East & Africa Lead-acid Battery Scrap Market Analysis and Forecast, 2022–2031
14.1. Key Findings
14.2. Middle East & Africa Lead-acid Battery Scrap Market Volume (Tons) and Value (US$ Mn) Forecast, by Battery Type, 2022–2031
14.3. Middle East & Africa Lead-acid Battery Scrap Market Volume (Tons) and Value (US$ Mn) Forecast, by Product, 2022–2031
14.4. Middle East & Africa Lead-acid Battery Scrap Market Volume (Tons) and Value (US$ Mn) Forecast, by Source, 2022–2031
14.5. Middle East & Africa Lead-acid Battery Scrap Market Value (US$ Mn) Forecast, by Method, 2022–2031
14.6. Middle East & Africa Lead-acid Battery Scrap Market Volume (Tons) and Value (US$ Mn) Forecast, by Country and Sub-region, 2022-2031
14.6.1. Saudi Arabia Lead-acid Battery Scrap Market Volume (Tons) and Value (US$ Mn) Forecast, by Battery Type, 2022–2031
14.6.2. Saudi Arabia Lead-acid Battery Scrap Market Volume (Tons) and Value (US$ Mn) Forecast, by Product, 2022–2031
14.6.3. Saudi Arabia Lead-acid Battery Scrap Market Volume (Tons) and Value (US$ Mn) Forecast, by Source, 2022–2031
14.6.4. Saudi Arabia Lead-acid Battery Scrap Market Value (US$ Mn) Forecast, by Method, 2022–2031
14.6.5. UAE Lead-acid Battery Scrap Market Volume (Tons) and Value (US$ Mn) Forecast, by Battery Type, 2022–2031
14.6.6. UAE Lead-acid Battery Scrap Market Volume (Tons) and Value (US$ Mn) Forecast, by Product, 2022–2031
14.6.7. UAE Lead-acid Battery Scrap Market Volume (Tons) and Value (US$ Mn) Forecast, by Source, 2022–2031
14.6.8. UAE Lead-acid Battery Scrap Market Value (US$ Mn) Forecast, by Method, 2022–2031
14.6.9. South Africa Lead-acid Battery Scrap Market Volume (Tons) and Value (US$ Mn) Forecast, by Battery Type, 2022–2031
14.6.10. South Africa Lead-acid Battery Scrap Market Volume (Tons) and Value (US$ Mn) Forecast, by Product, 2022–2031
14.6.11. South Africa Lead-acid Battery Scrap Market Volume (Tons) and Value (US$ Mn) Forecast, by Source, 2022–2031
14.6.12. South Africa Lead-acid Battery Scrap Market Value (US$ Mn) Forecast, by Method, 2022–2031
14.6.13. Nigeria Lead-acid Battery Scrap Market Volume (Tons) and Value (US$ Mn) Forecast, by Battery Type, 2022–2031
14.6.14. Nigeria Lead-acid Battery Scrap Market Volume (Tons) and Value (US$ Mn) Forecast, by Product, 2022–2031
14.6.15. Nigeria Lead-acid Battery Scrap Market Volume (Tons) and Value (US$ Mn) Forecast, by Source, 2022–2031
14.6.16. Nigeria Lead-acid Battery Scrap Market Value (US$ Mn) Forecast, by Method, 2022–2031
14.6.17. Rest of Middle East & Africa Lead-acid Battery Scrap Market Volume (Tons) and Value (US$ Mn) Forecast, by Battery Type, 2022–2031
14.6.18. Rest of Middle East & Africa Lead-acid Battery Scrap Market Volume (Tons) and Value (US$ Mn) Forecast, by Product, 2022–2031
14.6.19. Rest of Middle East & Africa Lead-acid Battery Scrap Market Volume (Tons) and Value (US$ Mn) Forecast, by Source, 2022–2031
14.6.20. Rest of Middle East & Africa Lead-acid Battery Scrap Market Value (US$ Mn) Forecast, by Method, 2022–2031
14.7. Middle East & Africa Pacific Lead-acid Battery Scrap Market Attractiveness Analysis
15. Latin America Lead-acid Battery Scrap Market Analysis and Forecast, 2022–2031
15.1. Key Findings
15.2. Latin America Lead-acid Battery Scrap Market Volume (Tons) and Value (US$ Mn) Forecast, by Battery Type, 2022–2031
15.3. Latin America Lead-acid Battery Scrap Market Volume (Tons) and Value (US$ Mn) Forecast, by Product, 2022–2031
15.4. Latin America Lead-acid Battery Scrap Market Volume (Tons) and Value (US$ Mn) Forecast, by Source, 2022–2031
15.5. Latin America Lead-acid Battery Scrap Market Value (US$ Mn) Forecast, by Method, 2022–2031
15.6. Latin America Lead-acid Battery Scrap Market Volume (Tons) and Value (US$ Mn) Forecast, by Country and Sub-region, 2022-2031
15.6.1. Brazil Lead-acid Battery Scrap Market Volume (Tons) and Value (US$ Mn) Forecast, by Battery Type, 2022–2031
15.6.2. Brazil Lead-acid Battery Scrap Market Volume (Tons) and Value (US$ Mn) Forecast, by Product, 2022–2031
15.6.3. Brazil Lead-acid Battery Scrap Market Volume (Tons) and Value (US$ Mn) Forecast, by Source, 2022–2031
15.6.4. Brazil Lead-acid Battery Scrap Market Value (US$ Mn) Forecast, by Method, 2022–2031
15.6.5. Mexico Lead-acid Battery Scrap Market Volume (Tons) and Value (US$ Mn) Forecast, by Battery Type, 2022–2031
15.6.6. Mexico Lead-acid Battery Scrap Market Volume (Tons) and Value (US$ Mn) Forecast, by Product, 2022–2031
15.6.7. Mexico Lead-acid Battery Scrap Market Volume (Tons) and Value (US$ Mn) Forecast, by Source, 2022–2031
15.6.8. Mexico Lead-acid Battery Scrap Market Value (US$ Mn) Forecast, by Method, 2022–2031
15.7. Latin America Lead-acid Battery Scrap Market Attractiveness Analysis
16. Competition Landscape
16.1. Global Lead-acid Battery Scrap Company Market Share Analysis, 2022
16.1.1. Company Profiles (Details – Overview, Financials, Recent Developments, and Strategy)
16.1.1.1. EnerSys
16.1.1.1.1. Company Description
16.1.1.1.2. Business Overview
16.1.1.1.3. Financial Overview
16.1.1.1.4. Strategic Overview
16.1.1.2. Battery Solutions LLC
16.1.1.2.1. Company Description
16.1.1.2.2. Business Overview
16.1.1.2.3. Financial Overview
16.1.1.2.4. Strategic Overview
16.1.1.3. Johnson Controls International PLC
16.1.1.3.1. Company Description
16.1.1.3.2. Business Overview
16.1.1.3.3. Financial Overview
16.1.1.3.4. Strategic Overview
16.1.1.4. Gravita India Ltd.
16.1.1.4.1. Company Description
16.1.1.4.2. Business Overview
16.1.1.4.3. Financial Overview
16.1.1.4.4. Strategic Overview
16.1.1.5. Aqua Metals Inc.
16.1.1.5.1. Company Description
16.1.1.5.2. Business Overview
16.1.1.5.3. Financial Overview
16.1.1.5.4. Strategic Overview
16.1.1.6. Amidt Group
16.1.1.6.1. Company Description
16.1.1.6.2. Business Overview
16.1.1.6.3. Financial Overview
16.1.1.6.4. Strategic Overview
16.1.1.7. Duracell Inc.
16.1.1.7.1. Company Description
16.1.1.7.2. Business Overview
16.1.1.7.3. Financial Overview
16.1.1.7.4. Strategic Overview
16.1.1.8. Engitec Technologies SpA
16.1.1.8.1. Company Description
16.1.1.8.2. Business Overview
16.1.1.8.3. Financial Overview
16.1.1.8.4. Strategic Overview
16.1.1.9. ECOBAT Technologies Ltd.
16.1.1.9.1. Company Description
16.1.1.9.2. Business Overview
16.1.1.9.3. Financial Overview
16.1.1.9.4. Strategic Overview
16.1.1.10. Exide Industries Ltd.
16.1.1.10.1. Company Description
16.1.1.10.2. Business Overview
16.1.1.10.3. Financial Overview
16.1.1.10.4. Strategic Overview
16.1.1.11. Systems Sunlight S.A.
16.1.1.11.1. Company Description
16.1.1.11.2. Business Overview
16.1.1.11.3. Financial Overview
16.1.1.11.4. Strategic Overview
16.1.1.12. Bee'ah Sharjah Environment Company LLC
16.1.1.12.1. Company Description
16.1.1.12.2. Business Overview
16.1.1.12.3. Financial Overview
16.1.1.12.4. Strategic Overview
16.1.1.13. Madenat Al Nokhba Recycling Services LLC
16.1.1.13.1. Company Description
16.1.1.13.2. Business Overview
16.1.1.13.3. Financial Overview
16.1.1.13.4. Strategic Overview
16.1.1.14. EnviroServe
16.1.1.14. Company Description
16.1.1.14. Business Overview
16.1.1.14. Financial Overview
16.1.1.14. Strategic Overview
17. Primary Research: Key Insights
18. Appendix
List of Tables
Table 1: Average lifetime of lead-acid Battery, by Industry
Table 2: Capital Investment Analysis, Lead Smelting Plant
Table 3: OPEX Analysis of 36,000 Ton Lead Smelting Plant with Utilization rate at 47%
Table 4: Global Lead-acid Battery Scrap Market Analysis and Forecast, by Method, 2022–2031
Table 5: Global Lead-acid Battery Scrap Market Analysis and Forecast, by Region, 2022–2031
Table 6: Global Lead-acid Battery Scrap Market Volume (Tons) and Value (US$ Mn) Forecast, by Region, 2022–2031
Table 7: North America Lead-acid Battery Scrap Market Analysis and Forecast, 2022–2031
Table 8: North America Lead-acid Battery Scrap Market Volume (Tons) and Value (US$ Mn) Forecast, by Battery Type, 2022–2031
Table 9: North America Lead-acid Battery Scrap Market Volume (Tons) and Value (US$ Mn) Forecast, by Product, 2022–2031
Table 10: North America Lead-acid Battery Scrap Market Volume (Tons) and Value (US$ Mn) Forecast, by Source, 2022–2031
Table 11: North America Lead-acid Battery Scrap Market Value (US$ Mn) Forecast, by Method, 2022–2031
Table 12: North America Lead-acid Battery Scrap Market Volume (Tons) and Value (US$ Mn) Forecast, by Country, 2022–2031
Table 13: U.S. Lead-acid Battery Scrap Market Volume (Tons) and Value (US$ Mn) Forecast, by Battery Type, 2022–2031
Table 14: U.S. Lead-acid Battery Scrap Market Volume (Tons) and Value (US$ Mn) Forecast, by Product, 2022–2031
Table 15: U.S. Lead-acid Battery Scrap Market Volume (Tons) and Value (US$ Mn) Forecast, by Source, 2022–2031
Table 16: U.S. Lead-acid Battery Scrap Market Value (US$ Mn) Forecast, by Method, 2022–2031
Table 17: Canada Lead-acid Battery Scrap Market Volume (Tons) and Value (US$ Mn) Forecast, by Battery Type, 2022–2031
Table 18:Canada Lead-acid Battery Scrap Market Volume (Tons) and Value (US$ Mn) Forecast, by Product, 2022–2031
Table 19: Canada Lead-acid Battery Scrap Market Volume (Tons) and Value (US$ Mn) Forecast, by Source, 2022–2031
Table 20: Canada Lead-acid Battery Scrap Market Value (US$ Mn) Forecast, by Method, 2022–2031
Table 21: Europe Lead-acid Battery Scrap Market Analysis and Forecast, 2022–2031
Table 22: Europe Lead-acid Battery Scrap Market Volume (Tons) and Value (US$ Mn) Forecast, by Battery Type, 2022–2031
Table 23: Europe Lead-acid Battery Scrap Market Volume (Tons) and Value (US$ Mn) Forecast, by Product, 2022–2031
Table 24: Europe Lead-acid Battery Scrap Market Volume (Tons) and Value (US$ Mn) Forecast, by Source, 2022–2031
Table 25: Europe Lead-acid Battery Scrap Market Value (US$ Mn) Forecast, by Method, 2022–2031
Table 26: Europe Lead-acid Battery Scrap Market Volume (Tons) and Value (US$ Mn) Forecast, by Country and Sub-region, 2022-2031
Table 27: Germany Lead-acid Battery Scrap Market Volume (Tons) and Value (US$ Mn) Forecast, byBattery Type, 2022–2031
Table 28: Germany Lead-acid Battery Scrap Market Volume (Tons) and Value (US$ Mn) Forecast, by Product, 2022–2031
Table 29: Germany Lead-acid Battery Scrap Market Volume (Tons) and Value (US$ Mn) Forecast, by Source, 2022–2031
Table 30: Germany Lead-acid Battery Scrap Market Value (US$ Mn) Forecast, by Method, 2022–2031
Table 31: France Lead-acid Battery Scrap Market Volume (Tons) and Value (US$ Mn) Forecast, by Battery Type, 2022–2031
Table 32: France Lead-acid Battery Scrap Market Volume (Tons) and Value (US$ Mn) Forecast, by Product, 2022–2031
Table 33: France Lead-acid Battery Scrap Market Volume (Tons) and Value (US$ Mn) Forecast, by Source, 2022–2031
Table 34: France Lead-acid Battery Scrap Market Value (US$ Mn) Forecast, by Method, 2022–2031
Table 35: U.K. Lead-acid Battery Scrap Market Volume (Tons) and Value (US$ Mn) Forecast, by Battery Type, 2022–2031
Table 36: U.K. Lead-acid Battery Scrap Market Volume (Tons) and Value (US$ Mn) Forecast, by Product, 2022–2031
Table 37: U.K. Lead-acid Battery Scrap Market Volume (Tons) and Value (US$ Mn) Forecast, by Source, 2022–2031
Table 38: U.K. Lead-acid Battery Scrap Market Value (US$ Mn) Forecast, by Method, 2022–2031
Table 39: Italy Lead-acid Battery Scrap Market Volume (Tons) and Value (US$ Mn) Forecast, byBattery Type, 2022–2031
Table 40: Italy Lead-acid Battery Scrap Market Volume (Tons) and Value (US$ Mn) Forecast, by Product, 2022–2031
Table 41: Italy Lead-acid Battery Scrap Market Volume (Tons) and Value (US$ Mn) Forecast, by Source, 2022–2031
Table 42: Italy Lead-acid Battery Scrap Market Value (US$ Mn) Forecast, by Method, 2022–2031
Table 43: Spain Lead-acid Battery Scrap Market Volume (Tons) and Value (US$ Mn) Forecast, by Battery Type, 2022–2031
Table 44: Spain Lead-acid Battery Scrap Market Volume (Tons) and Value (US$ Mn) Forecast, by Product, 2022–2031
Table 45: Spain Lead-acid Battery Scrap Market Volume (Tons) and Value (US$ Mn) Forecast, by Source, 2022–2031
Table 46: Spain Lead-acid Battery Scrap Market Value (US$ Mn) Forecast, by Method, 2022–2031
Table 47: Russia & CIS Lead-acid Battery Scrap Market Volume (Tons) and Value (US$ Mn) Forecast, by Battery Type, 2022–2031
Table 48: Russia & CIS Lead-acid Battery Scrap Market Volume (Tons) and Value (US$ Mn) Forecast, by Product, 2022–2031
Table 49: Russia & CIS Lead-acid Battery Scrap Market Volume (Tons) and Value (US$ Mn) Forecast, by Source, 2022–2031
Table 50: Russia Lead-acid Battery Scrap Market Value (US$ Mn) Forecast, by Method, 2022–2031
Table 51: Rest of Europe Lead-acid Battery Scrap Market Volume (Tons) and Value (US$ Mn) Forecast, by Battery Type, 2022–2031
Table 52: Rest of Europe Lead-acid Battery Scrap Market Volume (Tons) and Value (US$ Mn) Forecast, by Product, 2022–2031
Table 53: Rest of Europe Lead-acid Battery Scrap Market Volume (Tons) and Value (US$ Mn) Forecast, by Source, 2022–2031
Table 54: Rest of Europe Lead-acid Battery Scrap Market Value (US$ Mn) Forecast, by Method, 2022–2031
Table 55: Asia Pacific Lead-acid Battery Scrap Market Analysis and Forecast, 2022–2031
Table 56: Asia Pacific Lead-acid Battery Scrap Market Volume (Tons) and Value (US$ Mn) Forecast, by Battery Type
Table 57: Asia Pacific Lead-acid Battery Scrap Market Volume (Tons) and Value (US$ Mn) Forecast, by Product, 2022–2031
Table 58: Asia Pacific Lead-acid Battery Scrap Market Volume (Tons) and Value (US$ Mn) Forecast, by Source, 2022–2031
Table 59: Asia Pacific Lead-acid Battery Scrap Market Value (US$ Mn) Forecast, by Method, 2022–2031
Table 60: Asia Pacific Lead-acid Battery Scrap Market Volume (Tons) and Value (US$ Mn) Forecast, by Country and Sub-region, 2022-2031
Table 61: China Lead-acid Battery Scrap Market Volume (Tons) and Value (US$ Mn) Forecast, by Battery Type, 2022–2031
Table 62: China Lead-acid Battery Scrap Market Volume (Tons) and Value (US$ Mn) Forecast, by Product, 2022–2031
Table 63: China Lead-acid Battery Scrap Market Volume (Tons) and Value (US$ Mn) Forecast, by Source, 2022–2031
Table 64: China Lead-acid Battery Scrap Market Value (US$ Mn) Forecast, by Method, 2022–2031
Table 65: Japan Lead-acid Battery Scrap Market Volume (Tons) and Value (US$ Mn) Forecast, by Battery Type, 2022–2031
Table 66: Japan Lead-acid Battery Scrap Market Volume (Tons) and Value (US$ Mn) Forecast, by Product, 2022–2031
Table 67: Japan Lead-acid Battery Scrap Market Volume (Tons) and Value (US$ Mn) Forecast, by Source, 2022–2031
Table 68: Japan Lead-acid Battery Scrap Market Value (US$ Mn) Forecast, by Method, 2022–2031
Table 69: India Lead-acid Battery Scrap Market Volume (Tons) and Value (US$ Mn) Forecast, by Battery Type, 2022–2031
Table 70: India Lead-acid Battery Scrap Market Volume (Tons) and Value (US$ Mn) Forecast, by Product, 2022–2031
Table 71: India Lead-acid Battery Scrap Market Volume (Tons) and Value (US$ Mn) Forecast, by Source, 2022–2031
Table 72: India Lead-acid Battery Scrap Market Value (US$ Mn) Forecast, by Method, 2022–2031
Table 73: ASEAN Lead-acid Battery Scrap Market Volume (Tons) and Value (US$ Mn) Forecast, by Battery Type, 2022–2031
Table 74: ASEAN Lead-acid Battery Scrap Market Volume (Tons) and Value (US$ Mn) Forecast, by Product, 2022–2031
Table 75: ASEAN Lead-acid Battery Scrap Market and Volume (Tons) and Value (US$ Mn) Forecast, by Source, 2022–2031
Table 76: ASEAN Lead-acid Battery Scrap Market Value (US$ Mn) Forecast, by Method, 2022–2031
Table 77: Rest of Asia Pacific Lead-acid Battery Scrap Market Volume (Tons) and Value (US$ Mn) Forecast, by Battery Type, 2022–2031
Table 78: Rest of Asia Pacific Lead-acid Battery Scrap Market Volume (Tons) and Value (US$ Mn) Forecast, by Product, 2022–2031
Table 79: Rest of Asia Pacific Lead-acid Battery Scrap Market Volume (Tons) and Value (US$ Mn) Forecast, by Source, 2022–2031
Table 80: Rest of Asia Pacific Lead-acid Battery Scrap Market Value (US$ Mn) Forecast, by Method, 2022–2031
Table 81: Middle East & Africa Lead-acid Battery Scrap Market Analysis and Forecast, 2022–2031
Table 82: Middle East & Africa Lead-acid Battery Scrap Market Volume (Tons) and Value (US$ Mn) Forecast, by Battery Type, 2022–2031
Table 83: Middle East & Africa Lead-acid Battery Scrap Market Volume (Tons) and Value (US$ Mn) Forecast, by Product, 2022–2031
Table 84: Middle East & Africa Lead-acid Battery Scrap Market Volume (Tons) and Value (US$ Mn) Forecast, by Source, 2022–2031
Table 85: Middle East & Africa Lead-acid Battery Scrap Market Value (US$ Mn) Forecast, by Method, 2022–2031
Table 86: Middle East & Africa Lead-acid Battery Scrap Market Volume (Tons) and Value (US$ Mn) Forecast, by Country and Sub-region, 2022-2031
Table 87: Saudi Arabia Lead-acid Battery Scrap Market Volume (Tons) and Value (US$ Mn) Forecast, by Battery Type, 2022–2031
Table 88: Saudi Arabia Lead-acid Battery Scrap Market Volume (Tons) and Value (US$ Mn) Forecast, by Product, 2022–2031
Table 89: Saudi Arabia Lead-acid Battery Scrap Market Volume (Tons) and Value (US$ Mn) Forecast, by Source, 2022–2031
Table 90: Saudi Arabia Lead-acid Battery Scrap Market Value (US$ Mn) Forecast, by Method, 2022–2031
Table 91: UAE Lead-acid Battery Scrap Market Volume (Tons) and Value (US$ Mn) Forecast, by Battery Type, 2022–2031
Table 92: UAE Lead-acid Battery Scrap Market Volume (Tons) and Value (US$ Mn) Forecast, by Product, 2022–2031
Table 93: UAE Lead-acid Battery Scrap Market Volume (Tons) and Value (US$ Mn) Forecast, by Source, 2022–2031
Table 94: UAE Lead-acid Battery Scrap Market Value (US$ Mn) Forecast, by Method, 2022–2031
Table 95: South Africa Lead-acid Battery Scrap Market Volume (Tons) and Value (US$ Mn) Forecast, by Battery Type, 2022–2031
Table 96: South Africa Lead-acid Battery Scrap Market Volume (Tons) and Value (US$ Mn) Forecast, by Product, 2022–2031
Table 97: South Africa Lead-acid Battery Scrap Market Volume (Tons) and Value (US$ Mn) Forecast, by Source, 2022–2031
Table 98: South Africa Lead-acid Battery Scrap Market Value (US$ Mn) Forecast, by Method, 2022–2031
Table 99: Nigeria Lead-acid Battery Scrap Market Volume (Tons) and Value (US$ Mn) Forecast, by Battery Type, 2022–2031
Table 100: Nigeria Lead-acid Battery Scrap Market Volume (Tons) and Value (US$ Mn) Forecast, by Product, 2022–2031
Table 101: Nigeria Lead-acid Battery Scrap Market Volume (Tons) and Value (US$ Mn) Forecast, by Source, 2022–2031
Table 102: Nigeria Lead-acid Battery Scrap Market Value (US$ Mn) Forecast, by Method, 2022–2031
Table 103: Rest of Middle East & Africa Lead-acid Battery Scrap Market Volume (Tons) and Value (US$ Mn) Forecast, by Battery Type, 2022–2031
Table 104: Rest of Middle East & Africa Lead-acid Battery Scrap Market Volume (Tons) and Value (US$ Mn) Forecast, by Product, 2022–2031
Table 105: Rest of Middle East & Africa Lead-acid Battery Scrap Market Volume (Tons) and Value (US$ Mn) Forecast, by Source, 2022–2031
Table 106: Rest of Middle East & Africa Lead-acid Battery Scrap Market Value (US$ Mn) Forecast, by Method, 2022–2031
Table 107: Latin America Lead-acid Battery Scrap Market Analysis and Forecast, 2022–2031
Table 108: Latin America Lead-acid Battery Scrap Market Volume (Tons) and Value (US$ Mn) Forecast, by Battery Type, 2022–2031
Table 109: Latin America Lead-acid Battery Scrap Market Volume (Tons) and Value (US$ Mn) Forecast, by Product, 2022–2031
Table 110: Latin America Lead-acid Battery Scrap Market Volume (Tons) and Value (US$ Mn) Forecast, by Source, 2022–2031
Table 111: Latin America Lead-acid Battery Scrap Market Value (US$ Mn) Forecast, by Method, 2022–2031
Table 112: Latin America Lead-acid Battery Scrap Market Volume (Tons) and Value (US$ Mn) Forecast, by Country and Sub-region, 2022-2031
Table 113: Brazil Lead-acid Battery Scrap Market Volume (Tons) and Value (US$ Mn) Forecast, by Battery Type, 2022–2031
Table 114: Brazil Lead-acid Battery Scrap Market Volume (Tons) and Value (US$ Mn) Forecast, by Product, 2022–2031
Table 115: Brazil Lead-acid Battery Scrap Market Volume (Tons) and Value (US$ Mn) Forecast, by Source, 2022–2031
Table 116: Brazil Lead-acid Battery Scrap Market Value (US$ Mn) Forecast, by Method, 2022–2031
Table 117: Mexico Lead-acid Battery Scrap Market Volume (Tons) and Value (US$ Mn) Forecast, by Battery Type, 2022–2031
Table 118: Mexico Lead-acid Battery Scrap Market Volume (Tons) and Value (US$ Mn) Forecast, by Product, 2022–2031
Table 119: Mexico Lead-acid Battery Scrap Market Volume (Tons) and Value (US$ Mn) Forecast, by Source, 2022–2031
Table 120: Mexico Lead-acid Battery Scrap Market Value (US$ Mn) Forecast, by Method, 2022–2031
List of Figures
Figure 01: Lead-acid Batteries Recycling Supply Chain
Figure 02: Global Lead–Acid Battery Scrap Market Value (US$ Mn) & Volume (Kilo Tons) Forecast, 2022–2031
Figure 03: Capital Investment for Lead Smelting
Figure 04: Global Lead-acid Battery Scrap Market Value Share Analysis, by Battery Type, 2021 and 2031
Figure 05: Global Lead-acid Batteries Market Value Share Analysis, by Sealed Battery Type, 2021 and 2031
Figure 06: Global Lead-acid Battery Scrap Market Attractiveness Analysis, by Battery Type
Figure 07: Global Lead-acid Battery Scrap Market Attractiveness Analysis, by Sealed Battery Type
Figure 08: Global Lead-acid Battery Scrap Market Value Share Analysis by Product, 2021 and 2031
Figure 09: Global Lead-acid Battery Scrap Market Attractiveness Analysis, by Product, 2022—2031
Figure 10: Global Lead-acid Battery Scrap Market Value Share Analysis by Method, 2021 and 2031
Figure 11: Global Lead-acid Battery Scrap Market Attractiveness, by Method, 2022--2031
Figure 12: Global Lead-acid Battery Scrap Market Value Share Analysis, by Source, 2021 and 2031
Figure 13: Global Lead-acid Battery Scrap Market Attractiveness, by Source, 2022-2031
Figure 14: Global Lead-acid Battery Scrap Market Value Share, by Region, 2021 and 2031
Figure 15: Global Lead-acid Battery Scrap Market Attractiveness, by Region, 2022—2031
Figure 16: North America Lead-acid Battery Scrap Market Value Share Analysis, by Battery Type, 2021 and 2031
Figure 17: North America Lead-acid Battery Scrap Market Value Share Analysis, by Product, 2021 and 2031
Figure 18: North America Lead-acid Battery Scrap Market Value Share Analysis, by Source, 2021 and 2031
Figure 19: North America Lead-acid Battery Scrap Market Value Share Analysis, by Method, 2021 and 2031
Figure 20: North America Lead-acid Battery Scrap Market Value Share Analysis, by Country, 2021 and 2031
Figure 21: North America Lead-acid Battery Scrap Market Attractiveness Analysis, by Battery Type, 2022—2031
Figure 22: North America Lead-acid Battery Scrap Market Attractiveness Analysis, by Product, 2022—2031
Figure 23: North America Lead-acid Battery Scrap Market Attractiveness Analysis, by Method, 2022—2031
Figure 24: North America Lead-acid Battery Scrap Market Attractiveness Analysis, by Source, 2022—2031
Figure 25: North America Lead-acid Battery Scrap Attractiveness Analysis, by Region, 2022—2031
Figure 26: Europe Lead-acid Battery Scrap Market Value Share Analysis, by Battery Type, 2021 and 2031
Figure 27: Europe Lead-acid Battery Scrap Market Value Share Analysis, by Product, 2021 and 2031
Figure 28: Europe Lead-acid Battery Scrap Market Value Share Analysis, by Source, 2021 and 2031
Figure 29: Europe Lead-acid Battery Scrap Market Value Share Analysis, by Method, 2021 and 2031
Figure 30: Europe Lead-acid Battery Scrap Market Value Share Analysis, by Country and Sub-region, 2021 and 2031
Figure 31: Europe Lead-acid Battery Scrap Market Attractiveness Analysis, by Battery Type, 2022–2031
Figure 32: Europe Lead-acid Battery Scrap Market Attractiveness Analysis, by Product, 2022–2031
Figure 33: Europe Lead-acid Battery Scrap Market Attractiveness Analysis, by Method, 2022–2031
Figure 34: Europe Lead-acid Battery Scrap Market Attractiveness Analysis, by Source, 2022–2031
Figure 35: Europe Lead-acid Battery Scrap Market Attractiveness Analysis, by Country and Sub-region, 2022–2031
Figure 36: Asia Pacific Lead-acid Battery Scrap Market Value Share Analysis, by Battery Type, 2021 and 2031
Figure 37: Asia Pacific Lead-acid Battery Scrap Market Value Share Analysis, by Product, 2021 and 2031
Figure 38: Asia Pacific Lead-acid Battery Scrap Market Value Share Analysis, by Source, 2021 and 2031
Figure 39: Asia Pacific Lead-acid Battery Scrap Market Value Share Analysis, by Method, 2021 and 2031
Figure 40: Asia Pacific Lead-acid Battery Scrap Market Value Share Analysis, by Country and Sub-region, 2021 and 2031
Figure 41: Asia Pacific Lead-acid Battery Scrap Market Attractiveness Analysis, by Battery Type, 2022–2031
Figure 42: Asia Pacific Lead-acid Battery Scrap Market Attractiveness Analysis, by Product, 2022–2031
Figure 43: Asia Pacific Lead-acid Battery Scrap Market Attractiveness Analysis, by Method, 2022–2031
Figure 44: Asia Pacific Lead-acid Battery Scrap Market Attractiveness Analysis, by Source, 2022–2031
Figure 45: Asia Pacific Lead-acid Battery Scrap Market Attractiveness Analysis, by Country and Sub-region, 2022–2031
Figure 46: Middle East & Africa Lead-acid Battery Scrap Market Value Share Analysis, by Battery Type, 2021 and 2031
Figure 47: Middle East & Africa Lead-acid Battery Scrap Market Value Share Analysis, by Product, 2021 and 2031
Figure 48: Middle East & Africa Lead-acid Battery Scrap Market Value Share Analysis, by Source, 2021 and 2031
Figure 49: Middle East & Africa Lead-acid Battery Scrap Market Value Share Analysis, by Method, 2021 and 2031
Figure 50: Middle East & Africa Lead-acid Battery Scrap Market Value Share Analysis, by Country and Sub-region, 2021 and 2031
Figure 51: Middle East & Africa Lead-acid Battery Scrap Market Attractiveness Analysis, by Battery Type, 2022—2031
Figure 52: Middle East & Africa Lead-acid Battery Scrap Market Attractiveness Analysis, by Product, 2022—2031
Figure 53: Middle East & Africa Lead-acid Battery Scrap Market Attractiveness Analysis, by Method, 2022—2031
Figure 54: Middle East & Africa Lead-acid Battery Scrap Attractiveness Analysis, by Source, 2022—2031
Figure 55: Middle East & Africa Lead-acid Battery Scrap Market Attractiveness Analysis, by Region, 2022—2031
Figure 56: Latin America Lead-Acid Battery Scrap Market Value Share Analysis, by Battery Type, 2021 and 2031
Figure 57: Latin America Lead-Acid Battery Scrap Market Value Share Analysis, by Product, 2021 and 2031
Figure 58: Latin America Lead-Acid Battery Scrap Market Value Share Analysis, by Source, 2021 and 2031
Figure 59: Latin America Lead-Acid Battery Scrap Market Value Share Analysis, by Method, 2021 and 2031
Figure 60: Latin America Lead-Acid Battery Scrap Market Value Share Analysis, by Country and Sub-region, 2021 and 2031
Figure 61: Latin America Lead-Acid Battery Scrap Market Attractiveness Analysis, by Battery Type, 2022–2031
Figure 62: Latin America Lead-Acid Battery Scrap Market Attractiveness Analysis, by Product, 2022–2031
Figure 63: Latin America Lead-Acid Battery Scrap Market Attractiveness Analysis, by Method, 2022–2031
Figure 64: Latin America Lead-Acid Battery Scrap Market Attractiveness Analysis, by Source, 2022–2031
Figure 65: Latin America Lead-Acid Battery Scrap Market Attractiveness Analysis, by Country and Sub-region, 2022–2031
Figure 66: Global Lead-acid Battery Scrap Market Share Analysis, by Company (2021)
Copyright © Transparency Market Research, Inc. All Rights reserved
Trust Online

Lead-acid Battery Scrap Market