
Reports
Reports
Global Iron oxide Pigments Market: Snapshot
Iron oxide pigments improve the physical and mechanical properties of substrates. They offer properties such as good color strength, heat & light stability, opacity, weather & chemical resistance, and durability to substrates. Iron oxide pigments provides colors to varieties of end user applications and are employed in numerous industries around the globe to provide permanent and stable coloring effects to the substrates. Pigments are also known as colorants, which are insoluble products that can be employed to impart colors to construction materials, paints, inks, plastics, papers, cosmetics, rubbers, concrete blocks, tiles, etc. Pigment molecules contain electrons that can occupy different energy levels when exposed to light. Pigments possess the ability to reflect or absorb light of specific wavelengths. This results in the appearance of colors.
Demand for Synthetic Iron Oxide Pigments to Remain High Due to Their Low Cost
Iron oxide pigments are found in various colors and textures to impart coloring and tinting effects to majority of substrates. On the basis of consumption iron oxide pigments are sub-divided into red, yellow, and black colors. Red color iron oxide pigments are consumed in majority followed by yellow and black pigments. These are the basic color pigments and are used in combinations to produce other colors. The most commonly used methods of manufacturing iron oxide pigments includes the Laux process. This process can produce black, red, and yellow colored pigments of iron oxide. Red iron oxide pigments can also be prepared using the copperas process, which entails the calcination of iron sulfate at high temperature. Furthermore, the precipitation process can be implemented to manufacture red iron oxide pigments. Under this process, aqueous precipitation of iron oxide is formed in the presence of caustic soda under oxidative conditions.
Iron oxide pigments can be sub-divided into synthetic and natural iron oxide pigments. Synthetic iron oxide pigments are made from petrochemicals and waste metal ore slurry. Synthetic iron oxide pigments are cheap as compared to organic iron oxide pigments owing to low cost of raw material as well as synthetic iron oxide pigments have good dispersibility, high tinting strength, UV stability, excellent color intensity, and non-toxic properties. Natural iron oxide pigments are costly as compared with its synthetic counterpart owing to high cost of raw material. Natural iron oxide pigments are more durable and have excellent tinting strength as compared with synthetic pigments. Most of the natural iron oxide pigments are employed in paints & coatings and other automotive applications. Consumption of synthetic iron oxide pigments is much higher as compared with natural iron oxide pigments owing to low cost and high flexibility in varieties of applications in concretes, mortar, render, paving stones, tiles, laminate flooring, cosmetics, rubber, corrosion paints, industrial paints, architectural paints, and plastic materials. Growing construction activities, recovering economy in developed countries, and expanding infrastructure programs in combination with growing urbanization in developing economies, are the prime factors responsible for the growing consumption of iron oxide pigments around the globe.
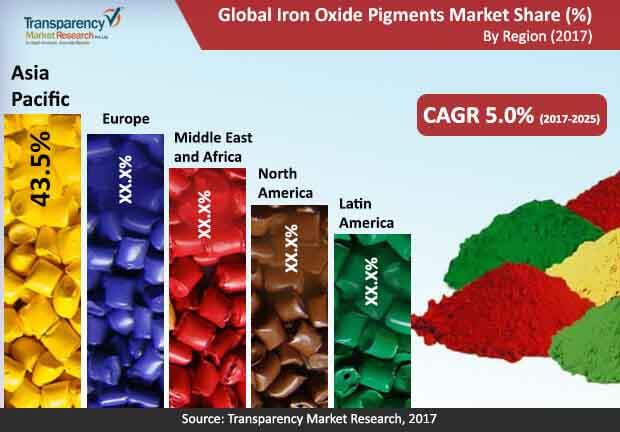
Asia Pacific to Showcase Lucrative Prospects through Forecast Period
Among the key regional markets, Asia Pacific showcases significantly high lucrative prospects. Meanwhile, the market witnessed decline in its shares for Latin America and Europe. In Asia Pacific, the market will benefit from rapid urbanization and the consequently rising demand from the construction and automotive industries. Besides these, various other factors are favoring the market’s growth in Asia Pacific. For instance, the market has considerably gained from easy availability of raw materials in the region. In addition, the manufacturing cost incurred in Asia Pacific is relatively lower as industries often find support of a growing economy and expanding construction and automotive sectors.
Some of the key market players of iron oxide pigments market are Lanxess AG, BASF SE, Huntsman Corporation., E.I. du Pont de Nemours and Company, Heubach GmbH, Kronos Worldwide, Inc., Cathay Industries, Hunan Three-ring Pigments Co., Ltd., Tronox Ltd., Applied Minerals Inc., The Earth Pigments Company LLC., Tata Pigments Limited, NUBIOLA, and Titan Kogyo, Ltd.
High Demand from the Construction Industry to Drive Iron oxide Pigments Market
Iron oxide pigments could be either synthetic or natural and they have traditionally been utilized for the purpose of coloring since the dawns of human civilization, since human beings started painting in the caves. Natural pigments are extracted from many iron oxide minerals. Plentiful availability of such pigments in the nature is likely to propel growth of the global iron oxide pigments market in the years to come.
The following are some of the colors and the minerals that they are extracted from
Micaceous iron oxide refers to a special type of hematite that is found in thin metallic gray flakes or platelets. Synthetic pigments are made under regulated conditions so that the shape, distribution, and size of the particle can be replicated accurately and without any hassle. This is likely to result in the improved chemical purity, color quality, and uniformity. These pigments are therefore expected to fuel growth of the global iron oxide pigments market in the near future.
Multiple Benefits of the Product to Shape Contours of the Market in the Near Future
Iron oxide pigments are well known for their low toxicity, excellent tinting strength, high temperature stability, and low reactivity. These properties of the product make it suitable for use in many applications. In terms of end user, construction sector across the globe account for a sizeable chunk of the global iron oxide pigments market. Such dominance of the construction sector is owing to the increased spending on various infrastructural projects in developing parts of the world, such as Asia Pacific.
In addition, paints industry also play an important role in the global iron oxide pigments market and the industry is likely to retain its regional dominance in the years to come. Such dominance of the paints industry is mainly due to rising demand for blends of pigments.
Table of Contents
1. Preface
1.1. Market Definition and Scope
1.2. Market Segmentation
1.3. Key Research Objectives
1.4. Research Highlights
2. Assumptions and Research Methodology
3. Executive Summary : Global Iron Oxide Pigments Market
3.1. Global Iron Oxide Pigments Market Size, US$ Mn, 2016-2025
4. Market Overview
4.1. Introduction
4.1.1. Iron Oxide Pigments Market Definition
4.1.2. Industry Developments
4.2. Key Market Indicators
4.3. Market Dynamics
4.3.1. Drivers
4.3.2. Restraints
4.3.3. Opportunity
4.4. Porter’s Five Force Analysis
4.5. Value Chain Analysis
4.5.1. List of Key Raw Material Suppliers
4.5.2. List of Key Manufacturers
4.5.3. Pigments Production Process Analysis
4.5.4. List of Customers
4.5.5. Level of Integration
4.6. Raw Material Analysis – Manufacturing/Extraction Process
4.7. Regulatory Scenario
4.8. SWOT Analysis
4.9. List of Key Customers
5. Global Iron Oxide Pigments – Supply Demand Scenario
5.1. Overview
5.2. Global Import/Export Scenario (HS Code 2821)
5.3. Global Production Output, by Region
5.3.1. North America
5.3.2. Latin America
5.3.3. Europe
5.3.4. Asia Pacific
5.3.4.1. China
5.3.5. Middle East & Africa
6. Global Iron Oxide Pigments Market Analysis and Forecasts, by Color Type Segment
6.1. Introduction & Definition
6.2. Key Findings
6.3. Market Size (Kilo Tons) (US$ Mn) Forecast by Color Type Segment, 2016-2025
6.3.1. Red
6.3.2. Yellow
6.3.3. Black
6.3.4. Others
6.4. Color Type Segment Comparison Matrix
6.5. Market Attractiveness By Color Type Segment
7. Global Iron Oxide Pigments Market Analysis and Forecasts, by Type Segment
7.1. Introduction & Definition
7.2. Key Findings
7.3. Market Size (Kilo Tons) (US$ Mn) Forecast by Type Segment, 2016-2025
7.3.1. Synthetic
7.3.2. Natural
7.4. Market Attractiveness By Type Segment
8. Global Iron Oxide Pigments Market Analysis and Forecasts, by End-User Segment
8.1. Introduction & Definition
8.2. Key Findings
8.3. Market Size (Kilo Tons) (US$ Mn) Forecast by End-User Segment, 2016-2025
8.3.1. Construction
8.3.2. Paints & Coatings
8.3.3. Textiles
8.3.4. Inks
8.3.5. Plastics
8.3.6. Others
8.4. Market Attractiveness By End-User Segment
9. Global Iron Oxide Pigments Market Analysis and Forecasts, by Region
9.1. Key Findings
9.2. Market Size (Kilo Tons) (US$ Mn) Forecast by Region, 2016-2025
9.2.1. North America
9.2.2. Latin America
9.2.3. Europe
9.2.4. Asia Pacific
9.2.5. Middle East & Africa
9.3. Market Attractiveness By Region
10. North America Iron Oxide Pigments Market Size and Forecast (Kilo Tons) (US$ Mn), 2016-2025
10.1. Key Findings
10.2. North America Market, by Color Type Segment
10.2.1. Red
10.2.2. Yellow
10.2.3. Black
10.2.4. Others
10.3. North America Market, by Type Segment
10.3.1. Synthetic
10.3.2. Natural
10.4. North America Market, by End-User Segment
10.4.1. Construction
10.4.2. Paints & Coatings
10.4.3. Textiles
10.4.4. Inks
10.4.5. Plastics
10.4.6. Others
10.5. U.S. Market Size & Forecast by Color Type Segment
10.5.1. Red
10.5.2. Yellow
10.5.3. Black
10.5.4. Others
10.6. U.S. Market Size & Forecast by Type Segment
10.6.1. Synthetic
10.6.2. Natural
10.7. U.S. Market Size & Forecast by End-User Segment
10.7.1. Construction
10.7.2. Paints & Coatings
10.7.3. Textiles
10.7.4. Inks
10.7.5. Plastics
10.7.6. Others
10.8. Canada Market Size & Forecast by Color Type Segment
10.8.1. Red
10.8.2. Yellow
10.8.3. Black
10.8.4. Others
10.9. Canada Market Size & Forecast by Type Segment
10.9.1. Synthetic
10.9.2. Natural
10.10. Canada Market Size & Forecast by End-User Segment
10.10.1. Construction
10.10.2. Paints & Coatings
10.10.3. Textiles
10.10.4. Inks
10.10.5. Plastics
10.10.6. Others
10.11. PEST Analysis
11. Latin America Iron Oxide Pigments Market Size and Forecast (Kilo Tons) (US$ Mn), 2016-2025
11.1. Key Findings
11.2. Latin America Market, by Color Type Segment
11.2.1. Red
11.2.2. Yellow
11.2.3. Black
11.2.4. Others
11.3. Latin America Market, by Type Segment
11.3.1. Synthetic
11.3.2. Natural
11.4. Latin America Market, by End-User Segment
11.4.1. Construction
11.4.2. Paints & Coatings
11.4.3. Textiles
11.4.4. Inks
11.4.5. Plastics
11.4.6. Others
11.5. Brazil Market Size & Forecast by Color Type Segment
11.5.1. Red
11.5.2. Yellow
11.5.3. Black
11.5.4. Others
11.6. Brazil Market Size & Forecast by Type Segment
11.6.1. Synthetic
11.6.2. Natural
11.7. Brazil Market Size & Forecast by End-User Segment
11.7.1. Construction
11.7.2. Paints & Coatings
11.7.3. Textiles
11.7.4. Inks
11.7.5. Plastics
11.7.6. Others
11.8. Mexico Market Size & Forecast by Color Type Segment
11.8.1. Red
11.8.2. Yellow
11.8.3. Black
11.8.4. Others
11.9. Mexico Market Size & Forecast by Type Segment
11.9.1. Synthetic
11.9.2. Natural
11.10. Mexico Market Size & Forecast by End-User Segment
11.10.1. Construction
11.10.2. Paints & Coatings
11.10.3. Textiles
11.10.4. Inks
11.10.5. Plastics
11.10.6. Others
11.11. Rest of Latin America Market Size & Forecast by Color Type Segment
11.11.1. Red
11.11.2. Yellow
11.11.3. Black
11.11.4. Others
11.12. Rest of Latin America Market Size & Forecast by Type Segment
11.12.1. Synthetic
11.12.2. Natural
11.13. Rest of Latin America Market Size & Forecast by End-User Segment
11.13.1. Construction
11.13.2. Paints & Coatings
11.13.3. Textiles
11.13.4. Inks
11.13.5. Plastics
11.13.6. Others
11.14. PEST Analysis
12. Europe Iron Oxide Pigments Market Size and Forecast (Kilo Tons) (US$ Mn), 2016-2025
12.1. Key Findings
12.2. Europe Market, by Color Type Segment
12.2.1. Red
12.2.2. Yellow
12.2.3. Black
12.2.4. Others
12.3. Europe Market, by Type Segment
12.3.1. Synthetic
12.3.2. Natural
12.4. Europe Market, by End-User Segment
12.4.1. Construction
12.4.2. Paints & Coatings
12.4.3. Textiles
12.4.4. Inks
12.4.5. Plastics
12.4.6. Others
12.5. Germany Market Size & Forecast by Color Type Segment
12.5.1. Red
12.5.2. Yellow
12.5.3. Black
12.5.4. Others
12.6. Germany Market Size & Forecast by Type Segment
12.6.1. Synthetic
12.6.2. Natural
12.7. Germany Market Size & Forecast by End-User Segment
12.7.1. Construction
12.7.2. Paints & Coatings
12.7.3. Textiles
12.7.4. Inks
12.7.5. Plastics
12.7.6. Others
12.8. France Market Size & Forecast by Color Type Segment
12.8.1. Red
12.8.2. Yellow
12.8.3. Black
12.8.4. Others
12.9. France Market Size & Forecast by Type Segment
12.9.1. Synthetic
12.9.2. Natural
12.10. France Market Size & Forecast by End-User Segment
12.10.1. Construction
12.10.2. Paints & Coatings
12.10.3. Textiles
12.10.4. Inks
12.10.5. Plastics
12.10.6. Others
12.11. U.K. Market Size & Forecast by Color Type Segment
12.11.1. Red
12.11.2. Yellow
12.11.3. Black
12.11.4. Others
12.12. U.K. Market Size & Forecast by Type Segment
12.12.1. Synthetic
12.12.2. Natural
12.13. U.K. Market Size & Forecast by End-User Segment
12.13.1. Construction
12.13.2. Paints & Coatings
12.13.3. Textiles
12.13.4. Inks
12.13.5. Plastics
12.13.6. Others
12.14. Spain Market Size & Forecast by Color Type Segment
12.14.1. Red
12.14.2. Yellow
12.14.3. Black
12.14.4. Others
12.15. Spain Market Size & Forecast by Type Segment
12.15.1. Synthetic
12.15.2. Natural
12.16. Spain Market Size & Forecast by End-User Segment
12.16.1. Construction
12.16.2. Paints & Coatings
12.16.3. Textiles
12.16.4. Inks
12.16.5. Plastics
12.16.6. Others
12.17. Italy Market Size & Forecast by Color Type Segment
12.17.1. Red
12.17.2. Yellow
12.17.3. Black
12.17.4. Others
12.18. Italy Market Size & Forecast by Type Segment
12.18.1. Synthetic
12.18.2. Natural
12.19. Italy Market Size & Forecast by End-User Segment
12.19.1. Construction
12.19.2. Paints & Coatings
12.19.3. Textiles
12.19.4. Inks
12.19.5. Plastics
12.19.6. Others
12.20. Russia Market Size & Forecast by Color Type Segment
12.20.1. Red
12.20.2. Yellow
12.20.3. Black
12.20.4. Others
12.21. Russia Market Size & Forecast by Type Segment
12.21.1. Synthetic
12.21.2. Natural
12.22. Russia Market Size & Forecast by End-User Segment
12.22.1. Construction
12.22.2. Paints & Coatings
12.22.3. Textiles
12.22.4. Inks
12.22.5. Plastics
12.22.6. Others
12.23. CIS Countries Market Size & Forecast by Color Type Segment
12.23.1. Red
12.23.2. Yellow
12.23.3. Black
12.23.4. Others
12.24. CIS Countries Market Size & Forecast by Type Segment
12.24.1. Synthetic
12.24.2. Natural
12.25. CIS Countries Market Size & Forecast by End-User Segment
12.25.1. Construction
12.25.2. Paints & Coatings
12.25.3. Textiles
12.25.4. Inks
12.25.5. Plastics
12.25.6. Others
12.26. Rest of Europe Market Size & Forecast by Color Type Segment
12.26.1. Red
12.26.2. Yellow
12.26.3. Black
12.26.4. Others
12.27. Rest of Europe Market Size & Forecast by Type Segment
12.27.1. Synthetic
12.27.2. Natural
12.28. Rest of Europe Market Size & Forecast by End-User Segment
12.28.1. Construction
12.28.2. Paints & Coatings
12.28.3. Textiles
12.28.4. Inks
12.28.5. Plastics
12.28.6. Others
12.29. PEST Analysis
13. Asia Pacific Iron Oxide Pigments Market Size and Forecast (Kilo Tons) (US$ Mn), 2016-2025
13.1. Key Findings
13.2. Asia Pacific Market, by Color Type Segment
13.2.1. Red
13.2.2. Yellow
13.2.3. Black
13.2.4. Others
13.3. Asia Pacific Market, by Type Segment
13.3.1. Synthetic
13.3.2. Natural
13.4. Asia Pacific Market, by End-User Segment
13.4.1. Construction
13.4.2. Paints & Coatings
13.4.3. Textiles
13.4.4. Inks
13.4.5. Plastics
13.4.6. Other
13.5. China Market Size & Forecast by Color Type Segment
13.5.1. Red
13.5.2. Yellow
13.5.3. Black
13.5.4. Others
13.6. China Market Size & Forecast by Type Segment
13.6.1. Synthetic
13.6.2. Natural
13.7. China Market Size & Forecast by End-User Segment
13.7.1. Construction
13.7.2. Paints & Coatings
13.7.3. Textiles
13.7.4. Inks
13.7.5. Plastics
13.7.6. Others
13.8. Japan Market Size & Forecast by Color Type Segment
13.8.1. Red
13.8.2. Yellow
13.8.3. Black
13.8.4. Others
13.9. Japan Market Size & Forecast by Type Segment
13.9.1. Synthetic
13.9.2. Natural
13.10. Japan Market Size & Forecast by End-User Segment
13.10.1. Construction
13.10.2. Paints & Coatings
13.10.3. Textiles
13.10.4. Inks
13.10.5. Plastics
13.10.6. Others
13.11. India Market Size & Forecast by Color Type Segment
13.11.1. Red
13.11.2. Yellow
13.11.3. Black
13.11.4. Others
13.12. India Market Size & Forecast by Type Segment
13.12.1. Synthetic
13.12.2. Natural
13.13. India Market Size & Forecast by End-User Segment
13.13.1. Construction
13.13.2. Paints & Coatings
13.13.3. Textiles
13.13.4. Inks
13.13.5. Plastics
13.13.6. Others
13.14. ASEAN Market Size & Forecast by Color Type Segment
13.14.1. Red
13.14.2. Yellow
13.14.3. Black
13.14.4. Others
13.15. ASEAN Market Size & Forecast by Type Segment
13.15.1. Synthetic
13.15.2. Natural
13.16. ASEAN Market Size & Forecast by End-User Segment
13.16.1. Construction
13.16.2. Paints & Coatings
13.16.3. Textiles
13.16.4. Inks
13.16.5. Plastics
13.16.6. Others
13.17. Rest of Asia Pacific Market Size & Forecast by Color Type Segment
13.17.1. Red
13.17.2. Yellow
13.17.3. Black
13.17.4. Others
13.18. Rest of Asia Pacific Market Size & Forecast by Type Segment
13.18.1. Synthetic
13.18.2. Natural
13.19. Rest of Asia Pacific Market Size & Forecast by End-User Segment
13.19.1. Construction
13.19.2. Paints & Coatings
13.19.3. Textiles
13.19.4. Inks
13.19.5. Plastics
13.19.6. Others
13.20. PEST Analysis
14. Middle East & Africa Iron Oxide Pigments Market Size and Forecast (Kilo Tons) (US$ Mn), 2016-2025
14.1. Key Findings
14.2. Middle East & Africa Market, by Color Type Segment
14.2.1. Red
14.2.2. Yellow
14.2.3. Black
14.2.4. Others
14.3. Middle East & Africa Market, by Type Segment
14.3.1. Synthetic
14.3.2. Natural
14.4. Middle East & Africa Market, by End-User Segment
14.4.1. Construction
14.4.2. Paints & Coatings
14.4.3. Textiles
14.4.4. Inks
14.4.5. Plastics
14.4.6. Others
14.5. GCC Market Size & Forecast by Color Type Segment
14.5.1. Red
14.5.2. Yellow
14.5.3. Black
14.5.4. Others
14.6. GCC Market Size & Forecast by Type Segment
14.6.1. Synthetic
14.6.2. Natural
14.7. GCC Market Size & Forecast by End-User Segment
14.7.1. Construction
14.7.2. Paints & Coatings
14.7.3. Textiles
14.7.4. Inks
14.7.5. Plastics
14.7.6. Others
14.8. South Africa Market Size & Forecast by Color Type Segment
14.8.1. Red
14.8.2. Yellow
14.8.3. Black
14.8.4. Others
14.9. South Africa Market Size & Forecast by Type Segment
14.9.1. Synthetic
14.9.2. Natural
14.10. South Africa Market Size & Forecast by End-User Segment
14.10.1. Construction
14.10.2. Paints & Coatings
14.10.3. Textiles
14.10.4. Inks
14.10.5. Plastics
14.10.6. Others
14.11. Rest of Middle East & Africa Market Size & Forecast by Color Type Segment
14.11.1. Red
14.11.2. Yellow
14.11.3. Black
14.11.4. Others
14.12. Rest of Middle East & Africa Market Size & Forecast by Type Segment
14.12.1. Synthetic
14.12.2. Natural
14.13. Rest of Middle East & Africa Market Size & Forecast by End-User Segment
14.13.1. Construction
14.13.2. Paints & Coatings
14.13.3. Textiles
14.13.4. Inks
14.13.5. Plastics
14.13.6. Others
14.14. PEST Analysis
15. Competition Landscape
15.1. Market Share Analysis By Company (2016)
15.2. Market Player – Competition Matrix (By Tier and Size of companies)
15.3. Product Mapping
15.4. Key Market Players (Details – Overview, Overall Revenue, Recent Developments, Strategy)
15.4.1. Lanxess AG
15.4.1.1. Company Description
15.4.1.2. Business Overview
15.4.1.3. Strategic Overview
15.4.2. BASF SE
15.4.2.1. Company Description
15.4.2.2. Business Overview
15.4.2.3. Strategic Overview
15.4.3. Huntsman Corporation
15.4.3.1. Company Description
15.4.3.2. Business Overview
15.4.3.3. Strategic Overview
15.4.4. E.I. du Pont de Nemours and Company
15.4.4.1. Company Description
15.4.4.2. Business Overview
15.4.4.3. Strategic Overview
15.4.5. Heubach GmbH
15.4.5.1. Company Description
15.4.5.2. Business Overview
15.4.6. CATHAY INDUSTRIES
15.4.6.1. Company Description
15.4.6.2. Business Overview
15.4.7. Hunan Three-ring Pigments Co., Ltd.
15.4.7.1. Company Description
15.4.7.2. Business Overview
15.4.8. Ferro Corporation
15.4.8.1. Company Description
15.4.8.2. Business Overview
15.4.8.3. Strategic Overview
15.4.9. Jiangsu Yuxing Industry and Trade Co., Ltd
15.4.9.1. Company Description
15.4.9.2. Business Overview
15.4.10. Applied Minerals Inc.
15.4.10.1. Company Description
15.4.10.2. Business Overview
15.4.10.3. Strategic Overview
15.4.11. Tata Pigments Limited
15.4.11.1. Company Description
15.4.11.2. Business Overview
15.4.12. Titan Kogyo, Ltd.
15.4.12.1. Company Description
15.4.12.2. Business Overview
16. Primary Research – Key Insights
List of Tables
Table 01 : Potential Customers for Iron Oxide Pigments
Table 02 : Potential Customers for Iron Oxide Pigments
Table 03 : Potential Customers for Iron Oxide Pigments
Table 04 : Potential Customers for Iron Oxide Pigments
Table 05 : Global Import-Export Scenario (KT), Iron oxide Pigments, 2016
Table 06 : Estimated Production of Iron oxide Pigments at Regional Level (2016)
Table 07 : Global Iron Oxide Pigments Market Size (US$ Mn) Forecast, by Color Type , 2016–2025
Table 08 : Global Iron Oxide Pigments Market Volume (Kilo Tons) Forecast, by Color Type , 2016–2025
Table 09 : Global Iron Oxide Pigments Market Size (US$ Mn) Forecast, by Type, 2016–2025
Table 10 : Global Iron Oxide Pigments Market Volume (Kilo Tons) Forecast, by Type, 2016–2025
Table 11 : Global Iron Oxide Pigments Market Size (US$ Mn) Forecast, by End-user, 2016–2025
Table 12 : Global Iron Oxide Pigments Market Volume (Kilo Tons) Forecast, by End-user, 2016–2025
Table 13 : Global Iron Oxide Pigments Market Size (US$ Mn) Forecast, by Region, 2016–2025
Table 14 : Global Iron Oxide Pigments Market Volume (Kilo Tons) Forecast, by Region, 2016–2025
Table 15 : North America Iron Oxide Pigments Market Size (US$ Mn) Forecast, by Color Type, 2016–2025
Table 16 : North America Iron Oxide Pigments Market Volume (Kilo Tons) Forecast, by Color Type, 2016–2025
Table 17 : North America Iron Oxide Pigments Market Size (US$ Mn) Forecast, by Type, 2016–2025
Table 18 : North America Iron Oxide Pigments Market Volume (Kilo Tons) Forecast, by Type, 2016–2025
Table 19 : North America Iron Oxide Pigments Market Size (US$ Mn) Forecast, by End-use, 2016–2025
Table 20 : North America Iron Oxide Pigments Market Volume (Kilo Tons) Forecast, by End-use, 2016–2025
Table 21 : North America Iron Oxide Pigments Market Size (US$ Mn) Forecast, by Country, 2016–2025
Table 22 : North America Iron Oxide Pigments Market Volume (Kilo Tons) Forecast, by Country, 2016–2025
Table 23 : U.S. Iron Oxide Pigments Market Size (US$ Mn) Forecast, by Color Type, 2016–2025
Table 24 : U.S. Iron Oxide Pigments Market Volume (Kilo Tons) Forecast, by Color Type, 2016–2025
Table 25 : U.S. Iron Oxide Pigments Market Size (US$ Mn) Forecast, by Type, 2016–2025
Table 26 : U.S. Iron Oxide Pigments Market Volume (Kilo Tons) Forecast, by Type, 2016–2025
Table 27 : U.S. Iron Oxide Pigments Market Size (US$ Mn) Forecast, by End-use, 2016–2025
Table 28 : U.S. Iron Oxide Pigments Market Volume (Kilo Tons) Forecast, by End-use, 2016–2025
Table 29 : Canada Iron Oxide Pigments Market Size (US$ Mn) Forecast, by Color Type, 2016–2025
Table 30 : Canada Iron Oxide Pigments Market Volume (Kilo Tons) Forecast, by Color Type, 2016–2025
Table 31 : Canada Iron Oxide Pigments Market Size (US$ Mn) Forecast, by Type, 2016–2025
Table 32 : Canada Iron Oxide Pigments Market Volume (Kilo Tons) Forecast, by Type, 2016–2025
Table 33 : Canada Iron Oxide Pigments Market Size (US$ Mn) Forecast, by End-use, 2016–2025
Table 34 : Canada Iron Oxide Pigments Market Volume (Kilo Tons) Forecast, by End-use, 2016–2025
Table 35 : Latin America Iron Oxide Pigments Market Size (US$ Mn) Forecast, by Color Type, 2016–2025
Table 36 : Latin America Iron Oxide Pigments Market Volume (Kilo Tons) Forecast, by Color Type, 2016–2025
Table 37 : Latin America Iron Oxide Pigments Market Size (US$ Mn) Forecast, by Type, 2016–2025
Table 38 : Latin America Iron Oxide Pigments Market Volume (Kilo Tons) Forecast, by Type, 2016–2025
Table 39 : Latin America Iron Oxide Pigments Market Size (US$ Mn) Forecast, by End-use, 2016–2025
Table 40 : Latin America Iron Oxide Pigments Market Volume (Kilo Tons) Forecast, by End-use, 2016–2025
Table 41 : Latin Iron Oxide Pigments Market Size (US$ Mn) and Volume (Kilo Tons) Forecast, by Country, 2016–2025
Table 42 : Brazil Iron Oxide Pigments Market Size (US$ Mn) Forecast, by Color Type, 2016–2025
Table 43 : Brazil Iron Oxide Pigments Market Volume (Kilo Tons) Forecast, by Color Type, 2016–2025
Table 44 : Brazil Iron Oxide Pigments Market Size (US$ Mn) Forecast, by Type, 2016–2025
Table 45 : Brazil Iron Oxide Pigments Market Volume (Kilo Tons) Forecast, by Type, 2016–2025
Table 46 : Brazil Iron Oxide Pigments Market Size (US$ Mn) Forecast, by End-use, 2016–2025
Table 47 : Brazil Iron Oxide Pigments Market Volume (Kilo Tons) Forecast, by End-use, 2016–2025
Table 48 : Mexico Iron Oxide Pigments Market Size (US$ Mn) Forecast, by Color Type, 2016–2025
Table 49 : Mexico Iron Oxide Pigments Market Volume (Kilo Tons) Forecast, by Color Type, 2016–2025
Table 50 : Mexico Iron Oxide Pigments Market Size (US$ Mn) Forecast, by Type, 2016–2025
Table 51 : Mexico Iron Oxide Pigments Market Volume (Kilo Tons) Forecast, by Type, 2016–2025
Table 52 : Mexico Iron Oxide Pigments Market Size (US$ Mn) Forecast, by End-use, 2016–2025
Table 53 : Brazil Iron Oxide Pigments Market Volume (Kilo Tons) Forecast, by End-use, 2016–2025
Table 54 : Rest of Latin America Iron Oxide Pigments Market Size (US$ Mn) Forecast, by Color Type, 2016–2025
Table 55 : Rest of Latin America Iron Oxide Pigments Market Volume (Kilo Tons) Forecast, by Color Type, 2016–2025
Table 56 : Rest of Latin America Iron Oxide Pigments Market Size (US$ Mn) Forecast, by Type, 2016–2025
Table 57 : Rest of Latin America Iron Oxide Pigments Market Volume (Kilo Tons) Forecast, by Type, 2016–2025
Table 58 : Rest of Latin America Iron Oxide Pigments Market Size (US$ Mn) Forecast, by End-use, 2016–2025
Table 59 : Rest of Latin America Iron Oxide Pigments Market Volume (Kilo Tons) Forecast, by End-use, 2016–2025
Table 60 : Europe Iron Oxide Pigments Market Size (US$ Mn) Forecast, by Color Type, 2016–2025
Table 61 : Europe Iron Oxide Pigments Market Volume (Kilo Tons) Forecast, by Color Type, 2016–2025
Table 62 : Europe Iron Oxide Pigments Market Size (US$ Mn) Forecast, by Type, 2016–2025
Table 63 : Europe Iron Oxide Pigments Market Volume (Kilo Tons) Forecast, by Type, 2016–2025
Table 64 : Europe Iron Oxide Pigments Market Size (US$ Mn) Forecast, by End-use, 2016–2025
Table 65 : Europe Iron Oxide Pigments Market Volume (Kilo Tons) Forecast, by End-use, 2016–2025
Table 66 : Europe Iron Oxide Pigments Market Size (US$ Mn) and Volume (Kilo Tons) Forecast, by Country, 2016–2025
Table 67 : Europe Iron Oxide Pigments Market Size (US$ Mn) and Volume (Kilo Tons) Forecast, by Country, 2016–2025
Table 68 : Germany Iron Oxide Pigments Market Size (US$ Mn) Forecast, by Color Type, 2016–2025
Table 69 : Germany Iron Oxide Pigments Market Volume (Kilo Tons) Forecast, by Color Type, 2016–2025
Table 70 : Germany Iron Oxide Pigments Market Size (US$ Mn) Forecast, by Type, 2016–2025
Table 71 : Germany Iron Oxide Pigments Market Volume (Kilo Tons) Forecast, by Type, 2016–2025
Table 72 : Germany Iron Oxide Pigments Market Size (US$ Mn) Forecast, by End-use, 2016–2025
Table 73 : Germany Iron Oxide Pigments Market Volume (Kilo Tons) Forecast, by End-use, 2016–2025
Table 74 : France Iron Oxide Pigments Market Size (US$ Mn) Forecast, by Color Type, 2016–2025
Table 75 : France Iron Oxide Pigments Market Volume (Kilo Tons) Forecast, by Color Type, 2016–2025
Table 76 : France Iron Oxide Pigments Market Size (US$ Mn) Forecast, by Type, 2016–2025
Table 77 : France Iron Oxide Pigments Market Volume (Kilo Tons) Forecast, by Type, 2016–2025
Table 78 : France Iron Oxide Pigments Market Size (US$ Mn) Forecast, by End-use, 2016–2025
Table 79 : France Iron Oxide Pigments Market Volume (Kilo Tons) Forecast, by End-use, 2016–2025
Table 80 : Italy Iron Oxide Pigments Market Size (US$ Mn) Forecast, by Color Type, 2016–2025
Table 81 : Italy Iron Oxide Pigments Market Volume (Kilo Tons) Forecast, by Color Type, 2016–2025
Table 82 : Italy Iron Oxide Pigments Market Size (US$ Mn) Forecast, by Type, 2016–2025
Table 83 : Italy Iron Oxide Pigments Market Volume (Kilo Tons) Forecast, by Type, 2016–2025
Table 84 : Italy Iron Oxide Pigments Market Size (US$ Mn) Forecast, by End-use, 2016–2025
Table 85 : Italy Iron Oxide Pigments Market Volume (Kilo Tons) Forecast, by End-use, 2016–2025
Table 86 : U.K. Iron Oxide Pigments Market Size (US$ Mn) Forecast, by Color Type, 2016–2025
Table 87 : U.K. Iron Oxide Pigments Market Volume (Kilo Tons) Forecast, by Color Type, 2016–2025
Table 88 : U.K. Iron Oxide Pigments Market Size (US$ Mn) Forecast, by Type, 2016–2025
Table 89 : U.K. Iron Oxide Pigments Market Volume (Kilo Tons) Forecast, by Type, 2016–2025
Table 90 : U.K. Iron Oxide Pigments Market Size (US$ Mn) Forecast, by End-use, 2016–2025
Table 91: U.K. Iron Oxide Pigments Market Volume (Kilo Tons) Forecast, by End-use, 2016–2025
Table 92 : Spain Iron Oxide Pigments Market Size (US$ Mn) Forecast, by Color Type, 2016–2025
Table 93 : Spain Iron Oxide Pigments Market Volume (Kilo Tons) Forecast, by Color Type, 2016–2025
Table 94 : Spain Iron Oxide Pigments Market Size (US$ Mn) Forecast, by Type, 2016–2025
Table 95 : Spain Iron Oxide Pigments Market Volume (Kilo Tons) Forecast, by Type, 2016–2025
Table 96 : Spain Iron Oxide Pigments Market Size (US$ Mn) Forecast, by End-use, 2016–2025
Table 97 : Spain Iron Oxide Pigments Market Volume (Kilo Tons) Forecast, by End-use, 2016–2025
Table 98 : Russia Iron Oxide Pigments Market Size (US$ Mn) Forecast, by Color Type, 2016–2025
Table 99 : Russia Iron Oxide Pigments Market Volume (Kilo Tons) Forecast, by Color Type, 2016–2025
Table 100 : Russia Iron Oxide Pigments Market Size (US$ Mn) Forecast, by Type, 2016–2025
Table 101 : Russia Iron Oxide Pigments Market Volume (Kilo Tons) Forecast, by Type, 2016–2025
Table 102 : Russia Iron Oxide Pigments Market Size (US$ Mn) Forecast, by End-use, 2016–2025
Table 103 : Russia Iron Oxide Pigments Market Volume (Kilo Tons) Forecast, by End-use, 2016–2025
Table 104 : CIS Countries Iron Oxide Pigments Market Size (US$ Mn) Forecast, by Color Type, 2016–2025
Table 105 : CIS Countries Iron Oxide Pigments Market Volume (Kilo Tons) Forecast, by Color Type, 2016–2025
Table 106 : CIS Countries Iron Oxide Pigments Market Size (US$ Mn) Forecast, by Type, 2016–2025
Table 107 : CIS Countries Iron Oxide Pigments Market Volume (Kilo Tons) Forecast, by Type, 2016–2025
Table 108 : CIS Countries Iron Oxide Pigments Market Size (US$ Mn) Forecast, by End-use, 2016–2025
Table 109 : CIS Countries Iron Oxide Pigments Market Volume (Kilo Tons) Forecast, by End-use, 2016–2025
Table 110 : Rest of Europe Iron Oxide Pigments Market Size (US$ Mn) Forecast, by Color Type, 2016–2025
Table 111 : Rest of Europe Iron Oxide Pigments Market Volume (Kilo Tons) Forecast, by Color Type, 2016–2025
Table 112 : Rest of Europe Iron Oxide Pigments Market Size (US$ Mn) Forecast, by Type, 2016–2025
Table 113 : Rest of Europe Iron Oxide Pigments Market Volume (Kilo Tons) Forecast, by Type, 2016–2025
Table 114 : Rest of Europe Iron Oxide Pigments Market Size (US$ Mn) Forecast, by End-use, 2016–2025
Table 115 : Rest of Europe Iron Oxide Pigments Market Volume (Kilo Tons) Forecast, by End-use, 2016–2025
Table 116 : Asia Pacific Iron Oxide Pigments Market Size (US$ Mn) Forecast, by Color Type, 2016–2025
Table 117 : Asia Pacific Iron Oxide Pigments Market Volume (Kilo Tons) Forecast, by Color Type, 2016–2025
Table 118 : Asia Pacific Iron Oxide Pigments Market Size (US$ Mn) Forecast, by Type, 2016–2025
Table 119 : Asia Pacific Iron Oxide Pigments Market Volume (Kilo Tons) Forecast, by Type, 2016–2025
Table 120 : Asia Pacific Iron Oxide Pigments Market Size (US$ Mn) Forecast, by End-use, 2016–2025
Table 121 : Asia Pacific Iron Oxide Pigments Market Volume (Kilo Tons) Forecast, by End-use, 2016–2025
Table 122 : Asia Pacific Iron Oxide Pigments Market Size (US$ Mn) and Volume (Kilo Tons) Forecast, by Country, 2016–2025
Table 123 : China Iron Oxide Pigments Market Size (US$ Mn) Forecast, by Color Type, 2016–2025
Table 124 : China Iron Oxide Pigments Market Volume (Kilo Tons) Forecast, by Color Type, 2016–2025
Table 125 : China Iron Oxide Pigments Market Size (US$ Mn) Forecast, by Type, 2016–2025
Table 126 : China Iron Oxide Pigments Market Volume (Kilo Tons) Forecast, by Type, 2016–2025
Table 127 : China Iron Oxide Pigments Market Size (US$ Mn) Forecast, by End-use, 2016–2025
Table 128 : China Iron Oxide Pigments Market Volume (Kilo Tons) Forecast, by End-use, 2016–2025
Table 129 : India Iron Oxide Pigments Market Size (US$ Mn) Forecast, by Color Type, 2016–2025
Table 130 : India Iron Oxide Pigments Market Volume (Kilo Tons) Forecast, by Color Type, 2016–2025
Table 131 : India Iron Oxide Pigments Market Size (US$ Mn) Forecast, by Type, 2016–2025
Table 132 : India Iron Oxide Pigments Market Volume (Kilo Tons) Forecast, by Type, 2016–2025
Table 133 : India Iron Oxide Pigments Market Size (US$ Mn) Forecast, by End-use, 2016–2025
Table 134 : India Iron Oxide Pigments Market Volume (Kilo Tons) Forecast, by End-use, 2016–2025
Table 135 : Japan Iron Oxide Pigments Market Size (US$ Mn) Forecast, by Color Type, 2016–2025
Table 136 : Japan Iron Oxide Pigments Market Volume (Kilo Tons) Forecast, by Color Type, 2016–2025
Table 137 : Japan Iron Oxide Pigments Market Size (US$ Mn) Forecast, by Type, 2016–2025
Table 138 : Japan Iron Oxide Pigments Market Volume (Kilo Tons) Forecast, by Type, 2016–2025
Table 139 : Japan Iron Oxide Pigments Market Size (US$ Mn) Forecast, by End-use, 2016–2025
Table 140 : Japan Iron Oxide Pigments Market Volume (Kilo Tons) Forecast, by End-use, 2016–2025
Table 141 : ASEAN Iron Oxide Pigments Market Size (US$ Mn) Forecast, by Color Type, 2016–2025
Table 142 : ASEAN Iron Oxide Pigments Market Volume (Kilo Tons) Forecast, by Color Type, 2016–2025
Table 143 : ASEAN Iron Oxide Pigments Market Size (US$ Mn) Forecast, by Type, 2016–2025
Table 144 : ASEAN Iron Oxide Pigments Market Volume (Kilo Tons) Forecast, by Type, 2016–2025
Table 145 : ASEAN Iron Oxide Pigments Market Size (US$ Mn) Forecast, by End-use, 2016–2025
Table 146 : ASEAN Iron Oxide Pigments Market Volume (Kilo Tons) Forecast, by End-use, 2016–2025
Table 147 : Rest of Asia Pacific Iron Oxide Pigments Market Size (US$ Mn) Forecast, by Color Type, 2016–2025
Table 148 : Rest of Asia Pacific Iron Oxide Pigments Market Volume (Kilo Tons) Forecast, by Color Type, 2016–2025
Table 149 : Rest of Asia Pacific Iron Oxide Pigments Market Size (US$ Mn) Forecast, by Type, 2016–2025
Table 150 : Rest of Asia Pacific Iron Oxide Pigments Market Volume (Kilo Tons) Forecast, by Type, 2016–2025
Table 151 : Rest of Asia Pacific Iron Oxide Pigments Market Size (US$ Mn) Forecast, by End-use, 2016–2025
Table 152 : Rest of Asia Pacific Iron Oxide Pigments Market Volume (Kilo Tons) Forecast, by End-use, 2016–2025
Table 153 : Middle East & Africa Iron Oxide Pigments Market Size (US$ Mn) Forecast, by Color Type, 2016–2025
Table 154 : Middle East & Africa Iron Oxide Pigments Market Volume (Kilo Tons) Forecast, by Color Type, 2016–2025
Table 155 : Middle East & Africa Iron Oxide Pigments Market Size (US$ Mn) Forecast, by Type, 2016–2025
Table 156 : Middle East & Africa Iron Oxide Pigments Market Volume (Kilo Tons) Forecast, by Type, 2016–2025
Table 157 : Middle East & Africa Iron Oxide Pigments Market Size (US$ Mn) Forecast, by End-use, 2016–2025
Table 158 : Middle East & Africa Iron Oxide Pigments Market Volume (Kilo Tons) Forecast, by End-use, 2016–2025
Table 159 : Middle East & Africa Iron Oxide Pigments Market Size (US$ Mn) and Volume (Kilo Tons) Forecast, by Country, 2016–2025
Table 160 : GCC Iron Oxide Pigments Market Size (US$ Mn) Forecast, by Color Type, 2016–2025
Table 161 : GCC Iron Oxide Pigments Market Volume (Kilo Tons) Forecast, by Color Type, 2016–2025
Table 162 : GCC Iron Oxide Pigments Market Size (US$ Mn) Forecast, by Type, 2016–2025
Table 163 : GCC Iron Oxide Pigments Market Volume (Kilo Tons) Forecast, by Type, 2016–2025
Table 164 : GCC Iron Oxide Pigments Market Size (US$ Mn) Forecast, by End-use, 2016–2025
Table 165 : GCC Iron Oxide Pigments Market Volume (Kilo Tons) Forecast, by End-use, 2016–2025
Table 166 : South Africa Iron Oxide Pigments Market Size (US$ Mn) Forecast, by Color Type, 2016–2025
Table 167 : South Africa Iron Oxide Pigments Market Volume (Kilo Tons) Forecast, by Color Type, 2016–2025
Table 168 : South Africa Iron Oxide Pigments Market Size (US$ Mn) Forecast, by Type, 2016–2025
Table 169 : South Africa Iron Oxide Pigments Market Volume (Kilo Tons) Forecast, by Type, 2016–2025
Table 170 : South Africa Iron Oxide Pigments Market Size (US$ Mn) Forecast, by End-use, 2016–2025
Table 171 : South Africa Iron Oxide Pigments Market Volume (Kilo Tons) Forecast, by End-use, 2016–2025
Table 172 : Rest of Middle East & Africa Iron Oxide Pigments Market Size (US$ Mn) Forecast, by Color Type, 2016–2025
Table 173 : Rest of Middle East & Africa Iron Oxide Pigments Market Volume (Kilo Tons) Forecast, by Color Type, 2016–2025
Table 174 : Rest of Middle East & Africa Iron Oxide Pigments Market Size (US$ Mn) Forecast, by Type, 2016–2025
Table 175 : Rest of Middle East & Africa Iron Oxide Pigments Market Volume (Kilo Tons) Forecast, by Type, 2016–2025
Table 176 : Rest of Middle East & Africa Iron Oxide Pigments Market Size (US$ Mn) Forecast, by End-use, 2016–2025
Table 177 : Rest of Middle East & Africa Iron Oxide Pigments Market Volume (Kilo Tons) Forecast, by End-use, 2016–2025
List of Figures
Figure 1: Global Iron Oxide Pigments Market Size (US$ Mn) and Volume (Kilo Tons) Forecast, 2016–2025
Figure 02: Global Iron Oxide Pigments Market Value Share Analysis, by Color Type, 2016 and 2025
Figure 03: Global Iron Oxide Pigments Market Attractiveness Analysis, by Color Type, 2016
Figure 04: Global Iron Oxide Pigments Market Size (US$ Mn) and Volume (Kilo Tons) Analysis, by Color Type Red, 2016–2025
Figure 5: Global Iron Oxide Pigments Market Size (US$ Mn) and Volume (Kilo Tons) Analysis, by Color Type, 2016–2025
Figure 6: Global Iron Oxide Pigments Market Size (US$ Mn) and Volume (Kilo Tons) Analysis, by Color Type, 2016–2025
Figure 7: : Global Iron Oxide Pigments Market Size (US$ Mn) and Volume (Kilo Tons) Analysis, by Color Type, 2016–2025
Figure 8 : Global Iron Oxide Pigments Market Value Share Analysis, by Type, 2016 and 2025
Figure 9 : Global Iron Oxide Pigments Market Attractiveness Analysis, by Type, 2016
Figure 10 : Global Iron Oxide Pigments Market Size (US$ Mn) and Volume (Kilo Tons) Analysis, by Type, 2016–2025
Figure 11 : Global Iron Oxide Pigments Market Size (US$ Mn) and Volume (Kilo Tons) Analysis, by Type, 2016–2025
Figure 12 : Global Iron Oxide Pigments Market Value Share Analysis, by End-user, 2016 and 2025
Figure 13 : Global Iron Oxide Pigments Market Attractiveness Analysis, by End-user
Figure 14 : Global Iron Oxide Pigments Market Size (US$ Mn) and Volume (Kilo Tons) Analysis, by Construction, 2016–2025
Figure 15 : Global Iron Oxide Pigments Market Size (US$ Mn) and Volume (Kilo Tons) Analysis, by Paints & Coatings, 2016–2025
Figure 16 : Global Iron Oxide Pigments Market Size (US$ Mn) and Volume (Kilo Tons) Analysis, by Textiles, 2016–2025
Figure 17 : Global Iron Oxide Pigments Market Size (US$ Mn) and Volume (Kilo Tons) Analysis, by Inks, 2016–2025
Figure 18 : Global Iron Oxide Pigments Market Size (US$ Mn) and Volume (Kilo Tons) Analysis, by Plastics, 2016–2025
Figure 19 : Global Iron Oxide Pigments Market Size (US$ Mn) and Volume (Kilo Tons) Analysis, by Others End-User, 2016–2025
Figure 20 : Global Iron Oxide Pigments Market Value Share Analysis, by Region, 2016 and 2025
Figure 21 : Iron Oxide Pigments Market Attractiveness Analysis, by Region, 2016
Figure 22 : North America Iron Oxide Pigments Market Size (US$ Mn) and Volume (Kilo Tons) Forecast, 2016–2025
Figure 23 : North America Iron Oxide Pigments Market Size and Volume Y-o-Y Growth Projections, 2016–2025
Figure 24 : North America Iron Oxide Pigments Market Attractiveness Analysis, by Country, 2016
Figure 25 : North America Iron Oxide Pigments Market Value Share Analysis, by Color Type, 2016 and 2025
Figure 26 : North America Iron Oxide Pigments Market Value Share Analysis, by Type, 2016 and 2025
Figure 27 : North America Iron Oxide Pigments Market Value Share Analysis, by End-use, 2016 and 2025
Figure 28 : North America Iron Oxide Pigments Market Value Share Analysis, by Country, 2016 and 2025
Figure 29 : U.S. Iron Oxide Pigments Market Size (US$ Mn) Forecast, 2016–2025
Figure 30 : U.S. Iron Oxide Pigments Market Volume (Kilo Tons) Forecast, 2016–2025
Figure 31: U.S. Iron Oxide Pigments Market Attractiveness Analysis, by Color Type, 2016 and 2025
Figure 32 : U.S. Iron Oxide Pigments Market Attractiveness Analysis, by Type, 2016 and 2025
Figure 33 : U.S. Iron Oxide Pigments Market Attractiveness Analysis, by End-User, 2016 and 2025
Figure 34 : U.S. Iron Oxide Pigments Market Attractiveness Analysis, by Color Type, 2016
Figure 35 : U.S. Iron Oxide Pigments Market Attractiveness Analysis, by Type
Figure 36 : U.S. Iron Oxide Pigments Market Attractiveness Analysis, by End-User, 2016
Figure 37 : Canada Iron Oxide Pigments Market Size (US$ Mn) Forecast, 2016–2025
Figure 38 : Canada Iron Oxide Pigments Market Volume (Kilo Tons) Forecast, 2016–2025
Figure 39 : Canada Iron Oxide Pigments Market Attractiveness Analysis, by Color Type, 2016 and 2025
Figure 40 : Canada Iron Oxide Pigments Market Attractiveness Analysis, by Type, 2016 and 2025
Figure 41 : Canada Iron Oxide Pigments Market Attractiveness Analysis, by End-User, 2016 and 2025
Figure 42 : Canada Iron Oxide Pigments Market Attractiveness Analysis, by Color Type, 2016
Figure 43 : Canada Iron Oxide Pigments Market Attractiveness Analysis, by Type
Figure 44 : Canada Iron Oxide Pigments Market Attractiveness Analysis, by End-User, 2016
Figure 45 : North America Iron Oxide Pigments Market Attractiveness Analysis, by Color Type, 2016
Figure 46 : North America Iron Oxide Pigments Market Attractiveness Analysis, by Type, 2016
Figure 47 : North America Iron Oxide Pigments Market Attractiveness Analysis, by End-use, 2016
Figure 48 : Latin America Iron Oxide Pigments Market Size (US$ Mn) and Volume (Kilo Tons) Forecast, 2016–2025
Figure 49 : Latin America Iron Oxide Pigments Market Size and Volume Y-o-Y Growth Projections, 2016–2025
Figure 50 : Latin America Iron Oxide Pigments Market Attractiveness Analysis, by Country, 2016
Figure 51 : Latin America Iron Oxide Pigments Market Value Share Analysis, by Color Type, 2016 and 2025
Figure 52 : Latin America Iron Oxide Pigments Market Value Share Analysis, by Type, 2016 and 2025
Figure 53 : Latin America Iron Oxide Pigments Market Value Share Analysis, by End-use, 2016 and 2025
Figure 54 : Latin America Iron Oxide Pigments Market Value Share Analysis, by Country, 2016 and 2025
Figure 55 : Brazil Iron Oxide Pigments Market Size (US$ Mn) Forecast, 2016–2025
Figure 56 : Brazil Iron Oxide Pigments Market Volume (Kilo Tons) Forecast, 2016–2025
Figure 57 : Brazil Iron Oxide Pigments Market Attractiveness Analysis, by Color Type, 2016 and 2025
Figure 58 : Brazil Iron Oxide Pigments Market Attractiveness Analysis, by Type, 2016 and 2025
Figure 59 : Brazil Iron Oxide Pigments Market Attractiveness Analysis, by End-user, 2016 and 2025
Figure 60 : Brazil Iron Oxide Pigments Market Attractiveness Analysis, by Color Type, 2016
Figure 61 : Brazil Iron Oxide Pigments Market Attractiveness Analysis, by Type
Figure 62 : Brazil Iron Oxide Pigments Market Attractiveness Analysis, by End-user, 2016
Figure 63 : Mexico Iron Oxide Pigments Market Size (US$ Mn) Forecast, 2016–2025
Figure 64 : Mexico Iron Oxide Pigments Market Volume (Kilo Tons) Forecast, 2016–2025
Figure 65 : Mexico Iron Oxide Pigments Market Attractiveness Analysis, by Color Type, 2016 and 2025
Figure 66 : Mexico Iron Oxide Pigments Market Attractiveness Analysis, by Type, 2016 and 2025
Figure 67: Mexico Iron Oxide Pigments Market Attractiveness Analysis, by End-user, 2016 and 2025
Figure 68 : Mexico Iron Oxide Pigments Market Attractiveness Analysis, by Color Type, 2016
Figure 69 : Mexico Iron Oxide Pigments Market Attractiveness Analysis, by Type
Figure 70 : Mexico Iron Oxide Pigments Market Attractiveness Analysis, by End-user, 2016
Figure 71 : Rest of Latin America Iron Oxide Pigments Market Size (US$ Mn) Forecast, 2016–2025
Figure 72 : Rest of Latin America Iron Oxide Pigments Market Volume (Kilo Tons) Forecast, 2016–2025
Figure 73 : Rest of Latin America Iron Oxide Pigments Market Attractiveness Analysis, by Color Type, 2016 and 2025
Figure 74 : Rest of Latin America Iron Oxide Pigments Market Attractiveness Analysis, by Type, 2016 and 2025
Figure 75 : Rest of Latin America Iron Oxide Pigments Market Attractiveness Analysis, by End-user, 2016 and 2025
Figure 76 : Rest of Latin America Iron Oxide Pigments Market Attractiveness Analysis, by Color Type, 2016
Figure 77 : Rest of Latin America Iron Oxide Pigments Market Attractiveness Analysis, by Type
Figure 78 : Rest of Latin America Iron Oxide Pigments Market Attractiveness Analysis, by End-user, 2016
Figure 79 : Latin America Iron Oxide Pigments Market Attractiveness Analysis, by Color Type, 2016
Figure 80 : Latin America Iron Oxide Pigments Market Attractiveness Analysis, by Type, 2016
Figure 81 : Latin America Iron Oxide Pigments Market Attractiveness Analysis, by End-use, 2016
Figure 82 : Europe Iron Oxide Pigments Market Size (US$ Mn) and Volume (Kilo Tons) Forecast, 2016–2025
Figure 83 : Europe Iron Oxide Pigments Market Size and Volume, Y-o-Y Growth Projection, 2016–2025
Figure 84 : Europe Iron Oxide Pigments Market Attractiveness Analysis, by Country, 2016
Figure 85 : Europe Iron Oxide Pigments Market Value Share Analysis, by Color Type, 2016 and 2025
Figure 86 : Europe Iron Oxide Pigments Market Value Share Analysis, by Type, 2016 and 2025
Figure 87 : Europe Iron Oxide Pigments Market Value Share Analysis, by End-use, 2016 and 2025
Figure 88 : Europe Iron Oxide Pigments Market Value Share Analysis, by Country, 2016 and 2025
Figure 89 : Germany Iron Oxide Pigments Market Size (US$ Mn) Forecast, 2016–2025
Figure 90 : Germany Iron Oxide Pigments Market Volume (Kilo Tons) Forecast, 2016–2025
Figure 91 : Germany Iron Oxide Pigments Market Attractiveness Analysis, by Color Type, 2016 and 2025
Figure 92 : Germany Iron Oxide Pigments Market Attractiveness Analysis, by Type, 2016 and 2025
Figure 93 : Germany Iron Oxide Pigments Market Attractiveness Analysis, by End-User, 2016 and 2025
Figure 94 : Germany Iron Oxide Pigments Market Attractiveness Analysis, by Color Type, 2016
Figure 95 : Germany Iron Oxide Pigments Market Attractiveness Analysis, by Type
Figure 96 : Germany Iron Oxide Pigments Market Attractiveness Analysis, by End-user, 2016
Figure 97 : France Iron Oxide Pigments Market Size (US$ Mn) Forecast, 2016–2025
Figure 98 : France Iron Oxide Pigments Market Volume (Kilo Tons) Forecast, 2016–2025
Figure 99 : France Iron Oxide Pigments Market Attractiveness Analysis, by Color Type, 2016 and 2025
Figure 100 : France Iron Oxide Pigments Market Attractiveness Analysis, by Type, 2016 and 2025
Figure 101 : France Iron Oxide Pigments Market Attractiveness Analysis, by End-user, 2016 and 2025
Figure 102 : France Iron Oxide Pigments Market Attractiveness Analysis, by Color Type, 2016
Figure 103 : France Iron Oxide Pigments Market Attractiveness Analysis, by Type
Figure 104 : France Iron Oxide Pigments Market Attractiveness Analysis, by End-user, 2016
Figure 105 : Italy Iron Oxide Pigments Market Size (US$ Mn) Forecast, 2016–2025
Figure 106 : Italy Iron Oxide Pigments Market Volume (Kilo Tons) Forecast, 2016–2025
Figure 107 : Italy Iron Oxide Pigments Market Attractiveness Analysis, by Color Type, 2016 and 2025
Figure 108 : Italy Iron Oxide Pigments Market Attractiveness Analysis, by Type, 2016 and 2025
Figure 109 : Italy Iron Oxide Pigments Market Attractiveness Analysis, by End-User, 2016 and 2025
Figure 110 : Italy Iron Oxide Pigments Market Attractiveness Analysis, by Color Type, 2016
Figure 111 : Italy Iron Oxide Pigments Market Attractiveness Analysis, by Type
Figure 112: Italy Iron Oxide Pigments Market Attractiveness Analysis, by End-user, 2016
Figure 113 : U.K. Iron Oxide Pigments Market Size (US$ Mn) Forecast, 2016–2025
Figure 114 : U.K. Iron Oxide Pigments Market Volume (Kilo Tons) Forecast, 2016–2025
Figure 115 : U.K. Iron Oxide Pigments Market Attractiveness Analysis, by Color Type, 2016 and 2025
Figure 116 : U.K. Iron Oxide Pigments Market Attractiveness Analysis, by Type, 2016 and 2025
Figure 117 : U.K. Iron Oxide Pigments Market Attractiveness Analysis, by End-user, 2016 and 2025
Figure 118 : U.K. Iron Oxide Pigments Market Attractiveness Analysis, by Color Type, 2016
Figure 119 : U.K. Iron Oxide Pigments Market Attractiveness Analysis, by Type
Figure 120 : U.K. Iron Oxide Pigments Market Attractiveness Analysis, by End-user, 2016
Figure 121 : Spain Iron Oxide Pigments Market Size (US$ Mn) Forecast, 2016–2025
Figure 122 : Spain Iron Oxide Pigments Market Volume (Kilo Tons) Forecast, 2016–2025
Figure 123 : Spain Iron Oxide Pigments Market Attractiveness Analysis, by Color Type, 2016 and 2025
Figure 124 : Spain Iron Oxide Pigments Market Attractiveness Analysis, by Type, 2016 and 2025
Figure 125 : Spain Iron Oxide Pigments Market Attractiveness Analysis, by End-user, 2016 and 2025
Figure 126 : Spain Iron Oxide Pigments Market Attractiveness Analysis, by Color Type, 2016
Figure 127 : Spain Iron Oxide Pigments Market Attractiveness Analysis, by Type
Figure 128 : Spain Iron Oxide Pigments Market Attractiveness Analysis, by End-user, 2016
Figure 129 : Russia Iron Oxide Pigments Market Size (US$ Mn) Forecast, 2016–2025
Figure 130 : Russia Iron Oxide Pigments Market Volume (Kilo Tons) Forecast, 2016–2025
Figure 131 : Russia Iron Oxide Pigments Market Attractiveness Analysis, by Color Type, 2016 and 2025
Figure 132 : Russia Iron Oxide Pigments Market Attractiveness Analysis, by Type, 2016 and 2025
Figure 133 : Russia Iron Oxide Pigments Market Attractiveness Analysis, by End-user, 2016 and 2025
Figure 134 : Russia Iron Oxide Pigments Market Attractiveness Analysis, by Color Type, 2016
Figure 135 : Russia Iron Oxide Pigments Market Attractiveness Analysis, by Type
Figure 136 : Russia Iron Oxide Pigments Market Attractiveness Analysis, by End-user, 2016
Figure 137 : CIS Countries Iron Oxide Pigments Market Size (US$ Mn) Forecast, 2016–2025
Figure 138 : CIS Countries Iron Oxide Pigments Market Volume (Kilo Tons) Forecast, 2016–2025
Figure 139 : CIS Countries Iron Oxide Pigments Market Attractiveness Analysis, by Color Type, 2016 and 2025
Figure 140 : CIS Countries Iron Oxide Pigments Market Attractiveness Analysis, by Type, 2016 and 2025
Figure 141 : CIS Countries Iron Oxide Pigments Market Attractiveness Analysis, by End-user, 2016 and 2025
Figure 142 : CIS Countries Iron Oxide Pigments Market Attractiveness Analysis, by Color Type, 2016
Figure 143 : CIS Countries Iron Oxide Pigments Market Attractiveness Analysis, by Type
Figure 144 : CIS Countries Iron Oxide Pigments Market Attractiveness Analysis, by End-user, 2016
Figure 145 : Rest of Europe Iron Oxide Pigments Market Size (US$ Mn) Forecast, 2016–2025
Figure 146 : Rest of Europe Iron Oxide Pigments Market Volume (Kilo Tons) Forecast, 2016–2025
Figure 147 : Rest of Europe Iron Oxide Pigments Market Attractiveness Analysis, by Color Type, 2016 and 2025
Figure 148 : Rest of Europe Iron Oxide Pigments Market Attractiveness Analysis, by Type, 2016 and 2025
Figure 149 : Rest of Europe Iron Oxide Pigments Market Attractiveness Analysis, by End-User, 2016 and 2025
Figure 150 : Rest of Europe Iron Oxide Pigments Market Attractiveness Analysis, by Color Type, 2016
Figure 151 : Rest of Europe Iron Oxide Pigments Market Attractiveness Analysis, by Type
Figure 152 : Rest of Europe Iron Oxide Pigments Market Attractiveness Analysis, by End-User, 2016
Figure 153 : Europe Iron Oxide Pigments Market Attractiveness Analysis, by Color Type, 2016
Figure 154 : Europe Iron Oxide Pigments Market Attractiveness Analysis, by Type, 2016
Figure 155 : Europe Iron Oxide Pigments Market Attractiveness Analysis, by End-use, 2016
Figure 156 : Asia Pacific Iron Oxide Pigments Market Size (US$ Mn) and Volume (Kilo Tons) Forecast, 2016–2025
Figure 157 : Asia Pacific Iron Oxide Pigments Market Size and Volume Y-o-Y Growth Projections, 2016–2025
Figure 158 : Asia Pacific Iron Oxide Pigments Market Attractiveness Analysis, by Country, 2016
Figure 159 : Asia Pacific Iron Oxide Pigments Market Value Share Analysis, by Color Type, 2016 and 2025
Figure 160 : Asia Pacific Iron Oxide Pigments Market Value Share Analysis, by Type, 2016 and 2025
Figure 161 : Asia Pacific Iron Oxide Pigments Market Value Share Analysis, by End-use, 2016 and 2025
Figure 162 : Asia Pacific Iron Oxide Pigments Market Value Share Analysis, by Country, 2016 and 2025
Figure 163 : China Iron Oxide Pigments Market Size (US$ Mn) Forecast, 2016–2025
Figure 164 : China Iron Oxide Pigments Market Volume (Kilo Tons) Forecast, 2016–2025
Figure 165 : China Iron Oxide Pigments Market Attractiveness Analysis, by Color Type, 2016 and 2025
Figure 166 : China Iron Oxide Pigments Market Attractiveness Analysis, by Type, 2016 and 2025
Figure 167 : China Iron Oxide Pigments Market Attractiveness Analysis, by End-use, 2016 and 2025
Figure 168 : China Iron Oxide Pigments Market Attractiveness Analysis, by Color Type, 2016
Figure 169 : China Iron Oxide Pigments Market Attractiveness Analysis, by Type
Figure 170 : China Iron Oxide Pigments Market Attractiveness Analysis, by End-use, 2016
Figure 171 : India Iron Oxide Pigments Market Size (US$ Mn) Forecast, 2016–2025
Figure 172 : India Iron Oxide Pigments Market Volume (Kilo Tons) Forecast, 2016–2025
Figure 173 : India Iron Oxide Pigments Market Attractiveness Analysis, by Color Type, 2016 and 2025
Figure 174 : India Iron Oxide Pigments Market Attractiveness Analysis, by Type, 2016 and 2025
Figure 175 : India Iron Oxide Pigments Market Attractiveness Analysis, by End-use, 2016 and 2025
Figure 176 : India Iron Oxide Pigments Market Attractiveness Analysis, by Color Type, 2016
Figure 177 : India Iron Oxide Pigments Market Attractiveness Analysis, by Type
Figure 178 : India Iron Oxide Pigments Market Attractiveness Analysis, by End-use, 2016
Figure 179 : Japan Iron Oxide Pigments Market Size (US$ Mn) Forecast, 2016–2025
Figure 180 : Japan Iron Oxide Pigments Market Volume (Kilo Tons) Forecast, 2016–2025
Figure 181 : Japan Iron Oxide Pigments Market Attractiveness Analysis, by Color Type, 2016 and 2025
Figure 182 : Japan Iron Oxide Pigments Market Attractiveness Analysis, by Type, 2016 and 2025
Figure 183 : Japan Iron Oxide Pigments Market Attractiveness Analysis, by End-use, 2016 and 2025
Figure 184 : Japan Iron Oxide Pigments Market Attractiveness Analysis, by Color Type, 2016
Figure 185 : Japan Iron Oxide Pigments Market Attractiveness Analysis, by Type
Figure 186 : Japan Iron Oxide Pigments Market Attractiveness Analysis, by End-use, 2016
Figure 187 : ASEAN Iron Oxide Pigments Market Size (US$ Mn) Forecast, 2016–2025
Figure 188 : ASEAN Iron Oxide Pigments Market Volume (Kilo Tons) Forecast, 2016–2025
Figure 189 : ASEAN Iron Oxide Pigments Market Attractiveness Analysis, by Color Type, 2016 and 2025
Figure 190 : ASEAN Iron Oxide Pigments Market Attractiveness Analysis, by Type, 2016 and 2025
Figure 191: ASEAN Iron Oxide Pigments Market Attractiveness Analysis, by End-use, 2016 and 2025
Figure 192 : ASEAN Iron Oxide Pigments Market Attractiveness Analysis, by Color Type, 2016
Figure 193 : ASEAN Iron Oxide Pigments Market Attractiveness Analysis, by Type
Figure 194 : ASEAN Iron Oxide Pigments Market Attractiveness Analysis, by End-use, 2016
Figure 195 : Rest of Asia Pacific Iron Oxide Pigments Market Size (US$ Mn) Forecast, 2016–2025
Figure 196 : Rest of Asia Pacific Iron Oxide Pigments Market Volume (Kilo Tons) Forecast, 2016–2025
Figure 197 : Rest of Asia Pacific Iron Oxide Pigments Market Attractiveness Analysis, by Color Type, 2016 and 2025
Figure 198 : Rest of Asia Pacific Iron Oxide Pigments Market Attractiveness Analysis, by Type, 2016 and 2025
Figure 199 : Rest of Asia Pacific Iron Oxide Pigments Market Attractiveness Analysis, by End-use, 2016 and 2025
Figure 200 : Rest of Asia Pacific Iron Oxide Pigments Market Attractiveness Analysis, by Color Type, 2016
Figure 201 : Rest of Asia Pacific Iron Oxide Pigments Market Attractiveness Analysis, by Type
Figure 202 : Rest of Asia Pacific Iron Oxide Pigments Market Attractiveness Analysis, by End-use, 2016
Figure 203 : Asia Pacific Iron Oxide Pigments Market Attractiveness Analysis, by Color Type, 2016
Figure 204 : Asia Pacific Iron Oxide Pigments Market Attractiveness Analysis, by Type, 2016
Figure 205 : Asia Pacific Iron Oxide Pigments Market Attractiveness Analysis, by End-use, 2016
Figure 206 : Middle East & Africa Iron Oxide Pigments Market Size (US$ Mn) and Volume (Kilo Tons) Forecast, 2016–2025
Figure 207 : Middle East & Africa Iron Oxide Pigments Market Size and Volume Y-o-Y Growth Projections, 2016–2025
Figure 208 : Middle East & Africa Iron Oxide Pigments Market Attractiveness Analysis, by Country, 2016
Figure 209 : Middle East & Africa Iron Oxide Pigments Market Value Share Analysis, by Color Type, 2016 and 2025
Figure 210 : Middle East & Africa Iron Oxide Pigments Market Value Share Analysis, by Type, 2016 and 2025
Figure 211 : Middle East & Africa Iron Oxide Pigments Market Value Share Analysis, by End-use, 2016 and 2025
Figure 212 : Middle East & Africa Iron Oxide Pigments Market Value Share Analysis, by Country, 2016 and 2025
Figure 213 : GCC Iron Oxide Pigments Market Size (US$ Mn) Forecast, 2016–2025
Figure 214 : GCC Iron Oxide Pigments Market Volume (Kilo Tons) Forecast, 2016–2025
Figure 215 : GCC Iron Oxide Pigments Market Attractiveness Analysis, by Color Type, 2016 and 2025
Figure 216 : GCC Iron Oxide Pigments Market Attractiveness Analysis, by Type, 2016 and 2025
Figure 217 : GCC Iron Oxide Pigments Market Attractiveness Analysis, by End-use, 2016 and 2025
Figure 218 : GCC Iron Oxide Pigments Market Attractiveness Analysis, by Color Type, 2016
Figure 219 : GCC Iron Oxide Pigments Market Attractiveness Analysis, by Type
Figure 220 : GCC Iron Oxide Pigments Market Attractiveness Analysis, by End-use, 2016
Figure 221 : South Africa Iron Oxide Pigments Market Size (US$ Mn) Forecast, 2016–2025
Figure 222 : South Africa Iron Oxide Pigments Market Volume (Kilo Tons) Forecast, 2016–2025
Figure 223 : South Africa Iron Oxide Pigments Market Attractiveness Analysis, by Color Type, 2016 and 2025
Figure 224 : South Africa Iron Oxide Pigments Market Attractiveness Analysis, by Type, 2016 and 2025
Figure 225 : South Africa Iron Oxide Pigments Market Attractiveness Analysis, by End-use, 2016 and 2025
Figure 226 : South Africa Iron Oxide Pigments Market Attractiveness Analysis, by Color Type, 2016
Figure 227 : South Africa Iron Oxide Pigments Market Attractiveness Analysis, by Type
Figure 228 : South Africa Iron Oxide Pigments Market Attractiveness Analysis, by End-use, 2016
Figure 229 : Rest of Middle East & Africa Iron Oxide Pigments Market Size (US$ Mn) Forecast, 2016–2025
Figure 230 : Rest of Middle East & Africa Iron Oxide Pigments Market Volume (Kilo Tons) Forecast, 2016–2025
Figure 231 : Rest of Middle East & Africa Iron Oxide Pigments Market Attractiveness Analysis, by Color Type, 2016 and 2025
Figure 232 : Rest of Middle East & Africa Iron Oxide Pigments Market Attractiveness Analysis, by Type, 2016 and 2025
Figure 233 : Rest of Middle East & Africa Iron Oxide Pigments Market Attractiveness Analysis, by End-use, 2016 and 2025
Figure 234 : Rest of Middle East & Africa Iron Oxide Pigments Market Attractiveness Analysis, by Color Type, 2016
Figure 235 : Rest of Middle East & Africa Iron Oxide Pigments Market Attractiveness Analysis, by Type
Figure 236: Rest of Middle East & Africa Iron Oxide Pigments Market Attractiveness Analysis, by End-use, 2016
Figure 237 : Middle East & Africa Iron Oxide Pigments Market Attractiveness Analysis, by Color Type, 2016
Figure 238 : Middle East & Africa Iron Oxide Pigments Market Attractiveness Analysis, by Type, 2016
Figure 239 : Middle East & Africa Iron Oxide Pigments Market Attractiveness Analysis, by End-use, 2016
Figure 240 : Global Iron Oxide Pigments Market Value Share Analysis, by Company, 2016
Copyright © Transparency Market Research, Inc. All Rights reserved
Trust Online

Iron oxide Pigments Market