
Reports
Reports
Whilst many challenges exist due to the COVID-19 crisis, there are opportunities for stakeholders in the InGaAs image sensor market. Companies are catering to mission-critical applications in defense, industrial automation, and healthcare industries to keep economies running during the pandemic. Apart from maintaining stable supply chains, distributors are maintaining optimum service levels with clients, customers, and partners to establish consistent revenue streams.
Companies in the InGaAs image sensor market are updating their sales and demand planning strategies, including assessing changes in customer behavior. Manufacturers are conducting an analysis to understand their high-risk clients and customers where recovery of debt may be an issue. They are restructuring and investing in available sales channels pertaining to online stores and brick & mortar stores.
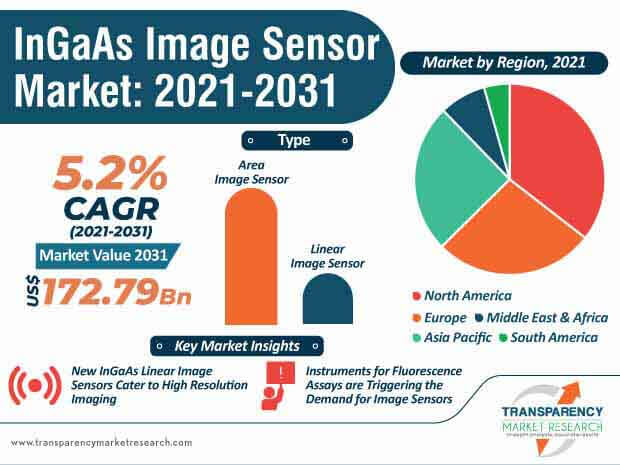
The InGaAs image sensor market is projected to reach US$ 172.79 Mn by 2031. There is a growing demand for InGaAs image sensors in security and surveillance cameras. However, these devices are potentially costly to install and maintain. Such findings are affecting the growth of the market. Nonetheless, advantages such as crime reduction, safety, and remote monitoring are anticipated to bolster market growth.
Hamamatsu Photonics - a global company of light technology and products, is building its portfolio in InGaAs linear image sensors and InGaAs area image sensors to capitalize on incremental opportunities through the demand for surveillance cameras.
Manufacturers in the InGaAs image sensor market are increasing their production capabilities in InGaAs linear image sensors that have low readout noise, low dark current, and high line scan rate. They are increasing the availability of InGaAs linear image sensors that provide high dynamic range, high sensitivity, and high speed in end-use devices.
Companies are developing InGaAs linear image sensors that cater to different needs right from long pixels to high-resolution imaging. Applications including medical imaging, spectrometry, and industrial sorting are creating income sources for stakeholders in the InGaAs image sensor market. On the other hand, InGaAs area image sensors are being publicized in industrial sorting and process inspection applications.
The InGaAs image sensor market is expected to register a CAGR of 5.2% during the forecast period. Manufacturers are developing robust SWIR (short wavelength infrared) cameras in the form of compact designs with the help of InGaAs image sensors. Allied Vision - a provider of high quality industrial cameras, is gaining acknowledgment for its Goldeye G/CL-030 and G/CL-130 cameras integrated with Sony SenSWIR sensors.
On-board image correction functions in SWIR cameras are being preferred by users. Such findings are translating into revenue opportunities for manufacturers in the InGaAs image sensor market, since these functions cater to excellent image quality. New models in SWIR cameras have comprehensive I/O (input/output) control options. Stabilized sensor cooling and fan-less designs are being highly preferred in SWIR cameras.
Healthcare and med-tech applications are creating stable revenue streams for companies in the InGaAs image sensor market. There is a growing demand for InGaAs image sensors, CMOS (Complementary Metal–Oxide–Semiconductor), and NMOS (N-channel Metal-Oxide Semiconductor) sensors in point-of-care devices and blood analyzers. Instruments for in-vitro diagnostics such as fluorescence assays are driving the demand for image sensors.
Manufacturers in the InGaAs image sensor market are developing products that feature a built-in CMOS IC readout circuit to allow easy signal processing. Their ability to operate in-charge integration mode helps to increase their signal output, making them ideal for low-level light detection.
Analysts’ Viewpoint
Companies are taking the advantage of relevant government grants, as many InGaAs image sensors are being used in non-essential applications, which may affect market growth during the COVID-19 crisis. The biggest limitation of InGaAs cameras is their noise level. Hence, these cameras should be deeply cooled to increase signal to noise by reducing dark noise as much as possible. This should be achieved either by cryogenic cooling or thermoelectric cooling, depending on application requirements. Manufacturers are designing SWIR cameras with extended operating temperature range. On the other hand, InGaAs area image sensors are being extensively used in hyperspectral imaging, industrial sorting, and night vision imaging.
|
Attribute |
Detail |
|
Market Size Value in 2020 (Base Year) |
USD 99.88 Mn |
|
Market Forecast Value in 2031 |
USD 172.79 Mn |
|
Growth Rate (CAGR) |
5.2% |
|
Forecast Period |
2021-2031 |
|
Quantitative Units |
US$ Mn for Value & Units for Volume |
|
Market Analysis |
It includes cross segment analysis at global as well as regional level. Further, qualitative analysis includes drivers, restraints, opportunities, key trends, porters five forces analysis, supply chain analysis, parent industry overview, etc. |
|
Competition Landscape |
|
|
Format |
Electronic (PDF) + Excel |
|
Market Segmentation |
|
|
Regions Covered |
|
|
Countries Covered |
|
|
Companies Profiled |
|
|
Customization Scope |
Available upon Request |
|
Pricing |
Available upon Request |
The InGaAs Image Sensor Market is studied from 2021 - 2031.
The InGaAs Image Sensor Market is projected to reach the valuation US$ 172.79 Mn By 2031
The InGaAs Image Sensor Market is expected to grow at a CAGR of 5.2%.
Teledyne FLIR LLC, Hamamatsu Photonics Kk, Lynred, New Imaging Technologies, Sensors Unlimited Inc., are a few of the key vendors in the InGaAs Image Sensor Market.
Rise in Demand for InGaAs Image Sensor for Security, Surveillance: Key Driver
1. Preface
1.1. Market Introduction
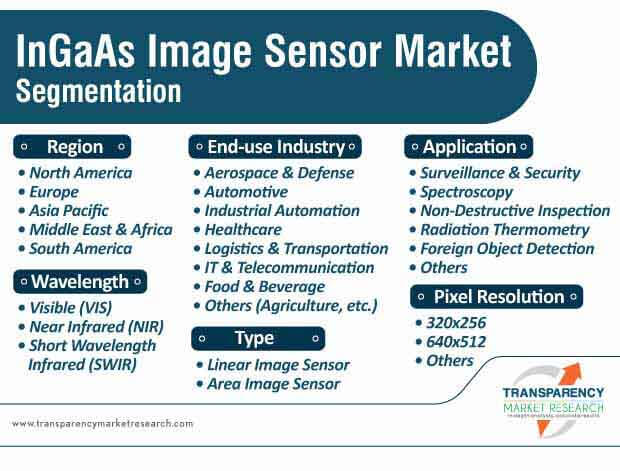
1.2. Market and Segments Definition
1.3. Market Taxonomy
1.4. Research Methodology
1.5. Assumption and Acronyms Used
2. Executive Summary
2.1. Global InGaAs Image Sensor Market Analysis and Forecast
2.2. Regional Outline
2.3. Market Dynamics Snapshot
2.4. Competition Blueprint
3. Market Dynamics
3.1. Macro-economic Factors
3.2. Key Market Indicator
3.3. Drivers
3.3.1. Economic Drivers
3.3.2. Supply Side Drivers
3.3.3. Demand Side Drivers
3.4. Market Restraints and Opportunities
3.5. Market Trends
3.5.1. Demand Side
3.5.2. Supply Side
3.6. Regulatory Framework
4. Associated Industry and Key Indicator Assessment
4.1. Parent Industry Overview – Image Sensor Industry
4.2. Supply Chain Analysis
4.3. Technology Roadmap Analysis
4.4. Industry SWOT Analysis
4.5. Porter Five Forces Analysis
5. Global InGaAs Image Sensor Market Analysis and Forecast
5.1. Market Size Analysis (US$ Mn) and Volume (Million Units) (2017-2020) and Forecast (2021-2031)
6. Global InGaAs Image Sensor Market Analysis, by Type
6.1. InGaAs Image Sensor Market Size (US$ Mn) and Volume (Million Units) Analysis & Forecast, by Type, 2017-2031
6.1.1. Linear Image Sensors
6.1.2. Area Image Sensors
6.2. Market Attractiveness Analysis, by Type
7. Global InGaAs Image Sensor Market Analysis, by Wavelength
7.1. InGaAs Image Sensor Market Size (US$ Mn) Analysis & Forecast, by Wavelength, 2017-2031
7.1.1. Visible (VIS)
7.1.2. Near Infrared (NIR)
7.1.3. Short Wavelength Infrared (SWIR)
7.2. Market Attractiveness Analysis, by Wavelength
8. Global InGaAs Image Sensor Market Analysis, by Application
8.1. InGaAs Image Sensor Market Size (US$ Mn) Analysis & Forecast, by Application, 2017-2031
8.1.1. Surveillance & Security
8.1.2. Spectroscopy
8.1.3. Sorting Inspection
8.1.4. Optical Coherence Tomography
8.1.5. Fiber Optic Communication
8.1.6. Others (Food Inspection, Laboratory Measurements, etc.)
8.2. Market Attractiveness Analysis, by Application
9. Global InGaAs Image Sensor Market Analysis, by Pixel Resolution
9.1. InGaAs Image Sensor Market Size (US$ Mn) Analysis & Forecast, by Pixel Resolution, 2017-2031
9.1.1. 320x256
9.1.2. 640x512
9.2. Market Attractiveness Analysis, by Pixel Resolution
10. Global InGaAs Image Sensor Market Analysis, by End-use Industry
10.1. InGaAs Image Sensor Market Size (US$ Mn) Analysis & Forecast, by End-use Industry, 2017-2031
10.1.1. Aerospace & Defense
10.1.2. Automotive
10.1.3. Industrial Automation
10.1.4. Healthcare
10.1.5. Logistics & Transportation
10.1.6. IT & Telecommunication
10.1.7. Food & Beverage
10.1.8. Others (Agriculture, etc.)
10.2. Market Attractiveness Analysis, by End-use Industry
11. Global InGaAs Image Sensor Market Analysis and Forecast, by Region
11.1. InGaAs Image Sensor Market Size (US$ Mn) and Volume (Million Units) Analysis & Forecast, by Region, 2017-2031
11.1.1. North America
11.1.2. Europe
11.1.3. Asia Pacific
11.1.4. Middle East & Africa
11.1.5. South America
11.2. Market Attractiveness Analysis, by Region
12. North America InGaAs Image Sensor Market Analysis and Forecast
12.1. Market Snapshot
12.2. Key Trends Analysis
12.3. Drivers and Restraints: Impact Analysis
12.4. Pricing Analysis
12.5. Key Regulations
12.6. InGaAs Image Sensor Market Size (US$ Mn) and Volume (Million Units) Analysis & Forecast, by Type, 2017-2031
12.6.1. Linear Image Sensors
12.6.2. Area Image Sensors
12.7. InGaAs Image Sensor Market Size (US$ Mn) Analysis & Forecast, by Wavelength, 2017-2031
12.7.1. Visible (VIS)
12.7.2. Near Infrared (NIR)
12.7.3. Short Wavelength Infrared (SWIR)
12.8. InGaAs Image Sensor Market Size (US$ Mn) Analysis & Forecast, by Application, 2017-2031
12.8.1. Surveillance & Security
12.8.2. Spectroscopy
12.8.3. Sorting Inspection
12.8.4. Optical Coherence Tomography
12.8.5. Fiber Optic Communication
12.8.6. Others (Food Inspection, Laboratory Measurements, etc.)
12.9. InGaAs Image Sensor Market Size (US$ Mn) Analysis & Forecast, by Pixel Resolution, 2017-2031
12.9.1. 320x256 12.9.2. 640x512
12.10. InGaAs Image Sensor Market Size (US$ Mn) Analysis & Forecast, by End-use Industry, 2017-2031
12.10.1. Aerospace & Defense
12.10.2. Automotive
12.10.3. Industrial Automation
12.10.4. Healthcare
12.10.5. Logistics & Transportation
12.10.6. IT & Telecommunication
12.10.7. Food & Beverage
12.10.8. Others (Agriculture, etc.)
12.11. InGaAs Image Sensor Market Size (US$ Mn) and Volume (Million Units) Analysis & Forecast, by Country, 2017-2031
12.11.1. U.S.
12.11.2. Canada
12.11.3. Mexico
12.12. Market Attractiveness Analysis
12.12.1. Type
12.12.2. Wavelength
12.12.3. Application
12.12.4. Pixel Resolution
12.12.5. End-use Industry
12.12.6. Country
13. Europe InGaAs Image Sensor Market Analysis and Forecast
13.1. Market Snapshot
13.2. Key Trends Analysis
13.3. Drivers and Restraints: Impact Analysis
13.4. Pricing Analysis
13.5. Key Regulations
13.6. Europe InGaAs Image Sensor Market Size (US$ Mn) and Volume (Million Units) Analysis & Forecast, by Type, 2017-2031
13.6.1. Linear Image Sensors
13.6.2. Area Image Sensors
13.7. InGaAs Image Sensor Market Size (US$ Mn) Analysis & Forecast, by Wavelength, 2017-2031
13.7.1. Visible (VIS)
13.7.2. Near Infrared (NIR)
13.7.3. Short Wavelength Infrared (SWIR)
13.8. Europe InGaAs Image Sensor Market Size (US$ Mn) Analysis & Forecast, by Application, 2017-2031
13.8.1. Surveillance & Security
13.8.2. Spectroscopy
13.8.3. Sorting Inspection
13.8.4. Optical Coherence Tomography
13.8.5. Fiber Optic Communication
13.8.6. Others (Food Inspection, Laboratory Measurements, etc.)
13.9. Europe InGaAs Image Sensor Market Size (US$ Mn) Analysis & Forecast, by Pixel Resolution, 2017-2031
13.9.1. 320x256
13.9.2. 640x512
13.10. Europe InGaAs Image Sensor Market Size (US$ Mn) Analysis & Forecast, by End-use Industry, 2017-2031
13.10.1. Aerospace & Defense
13.10.2. Automotive
13.10.3. Industrial Automation
13.10.4. Healthcare
13.10.5. Logistics & Transportation
13.10.6. IT & Telecommunication
13.10.7. Food & Beverage
13.10.8. Others (Agriculture, etc.)
13.11. Europe InGaAs Image Sensor Market Size (US$ Mn) and Volume (Million Units) Analysis & Forecast, by Country & Sub-region, 2017-2031
13.11.1. U.K.
13.11.2. Germany
13.11.3. France
13.11.4. Italy
13.11.5. Russia
13.11.6. Rest of Europe
13.12. Europe Market Attractiveness Analysis
13.12.1. Type
13.12.2. Wavelength
13.12.3. Application
13.12.4. Pixel Resolution
13.12.5. End-use Industry
13.12.6. Country
14. Asia Pacific InGaAs Image Sensor Market Analysis and Forecast
14.1. Asia Pacific InGaAs Image Sensor Market Size (US$ Mn) and Volume (Million Units) Analysis & Forecast, by Type, 2017-2031
14.1.1. Linear Image Sensors
14.1.2. Area Image Sensors
14.2. Asia Pacific InGaAs Image Sensor Market Size (US$ Mn) Analysis & Forecast, by Wavelength, 2017-2031
14.2.1. Visible (VIS)
14.2.2. Near Infrared (NIR)
14.2.3. Short Wavelength Infrared (SWIR)
14.3. Asia Pacific InGaAs Image Sensor Market Size (US$ Mn) Analysis & Forecast, by Application, 2017-2031
14.3.1. Surveillance & Security
14.3.2. Spectroscopy
14.3.3. Sorting Inspection
14.3.4. Optical Coherence Tomography
14.3.5. Fiber Optic Communication
14.3.6. Others (Food Inspection, Laboratory Measurements, etc.)
14.4. Asia Pacific InGaAs Image Sensor Market Size (US$ Mn) Analysis & Forecast, by Pixel Resolution, 2017-2031
14.4.1. 320x256
14.4.2. 640x512
14.5. Asia Pacific InGaAs Image Sensor Market Size (US$ Mn) Analysis & Forecast, by End-use Industry, 2017-2031
14.5.1. Aerospace & Defense
14.5.2. Automotive
14.5.3. Industrial Automation
14.5.4. Healthcare
14.5.5. Logistics & Transportation
14.5.6. IT & Telecommunication
14.5.7. Food & Beverage
14.5.8. Others (Agriculture, etc.)
14.6. Asia Pacific InGaAs Image Sensor Market Size (US$ Mn) and Volume (Million Units) Analysis & Forecast, by Country & Sub-region, 2017-2031
14.6.1. China
14.6.2. India
14.6.3. Japan
14.6.4. South Korea
14.6.5. ASEAN
14.6.6. Rest of Asia Pacific
14.7. Asia Pacific Market Attractiveness Analysis
14.7.1. Type
14.7.2. Wavelength
14.7.3. Application
14.7.4. Pixel Resolution
14.7.5. End-use Industry
14.7.6. Country & Sub-region
15. Middle East & Africa (MEA) InGaAs Image Sensor Market Analysis and Forecast
15.1. Middle East & Africa InGaAs Image Sensor Market Size (US$ Mn) and Volume (Million Units) Analysis & Forecast, by Type, 2017-2031
15.1.1. Linear Image Sensors
15.1.2. Area Image Sensors
15.2. Middle East & Africa InGaAs Image Sensor Market Size (US$ Mn) Analysis & Forecast, by Wavelength, 2017-2031
15.2.1. Visible (VIS)
15.2.2. Near Infrared (NIR)
15.2.3. Short Wavelength Infrared (SWIR)
15.3. Middle East & Africa InGaAs Image Sensor Market Size (US$ Mn) Analysis & Forecast, by Application, 2017-2031
15.3.1. Surveillance & Security
15.3.2. Spectroscopy
15.3.3. Sorting Inspection
15.3.4. Optical Coherence Tomography
15.3.5. Fiber Optic Communication
15.3.6. Others (Food Inspection, Laboratory Measurements, etc.)
15.4. Middle East & Africa InGaAs Image Sensor Market Size (US$ Mn) Analysis & Forecast, by Pixel Resolution, 2017-2031
15.4.1. 320x256
15.4.2. 640x512
15.5. Middle East & Africa InGaAs Image Sensor Market Size (US$ Mn) Analysis & Forecast, by End-use Industry, 2017-2031
15.5.1. Aerospace & Defense
15.5.2. Automotive
15.5.3. Industrial Automation
15.5.4. Healthcare
15.5.5. Logistics & Transportation
15.5.6. IT & Telecommunication
15.5.7. Food & Beverage
15.5.8. Others (Agriculture, etc.)
15.6. Middle East & Africa InGaAs Image Sensor Market Size (US$ Mn) and Volume (Million Units) Analysis & Forecast, by Country & Subretopm, 2017-2031
15.6.1. GCC
15.6.2. South Africa
15.6.3. North Africa
15.6.4. Rest of Middle East & Africa
15.7. Middle East & Africa Market Attractiveness Analysis
15.7.1. Type
15.7.2. Wavelength
15.7.3. Application
15.7.4. Pixel Resolution
15.7.5. End-use Industry
15.7.6. Country & Sub-region
16. South America InGaAs Image Sensor Market Analysis and Forecast
16.1. South America InGaAs Image Sensor Market Size (US$ Mn) and Volume (Million Units) Analysis & Forecast, by Type, 2017-2031
16.1.1. Linear Image Sensors
16.1.2. Area Image Sensors
16.2. South America InGaAs Image Sensor Market Size (US$ Mn) Analysis & Forecast, by Wavelength, 2017-2031
16.2.1. Visible (VIS)
16.2.2. Near Infrared (NIR)
16.2.3. Short Wavelength Infrared (SWIR)
16.3. South America InGaAs Image Sensor Market Size (US$ Mn) Analysis & Forecast, by Application, 2017-2031
16.3.1. Surveillance & Security
16.3.2. Spectroscopy
16.3.3. Sorting Inspection
16.3.4. Optical Coherence Tomography
16.3.5. Fiber Optic Communication
16.3.6. Others (Food Inspection, Laboratory Measurements, etc.)
16.4. South America InGaAs Image Sensor Market Size (US$ Mn) Analysis & Forecast, by Pixel Resolution, 2017-2031
16.4.1. 320x256
16.4.2. 640x512
16.5. South America InGaAs Image Sensor Market Size (US$ Mn) Analysis & Forecast, by End-use Industry, 2017-2031
16.5.1. Aerospace & Defense
16.5.2. Automotive
16.5.3. Industrial Automation
16.5.4. Healthcare
16.5.5. Logistics & Transportation
16.5.6. IT & Telecommunication
16.5.7. Food & Beverage
16.5.8. Others (Agriculture, etc.)
16.6. South America InGaAs Image Sensor Market Size (US$ Mn) and Volume (Million Units) Analysis & Forecast, by Country & Sub-region, 2017-2031
16.6.1. Brazil
16.6.2. Argentina
16.6.3. Rest of South America
16.7. South America Market Attractiveness Analysis
16.7.1. Type
16.7.2. Wavelength
16.7.3. Application
16.7.4. Pixel Resolution
16.7.5. End-use Industry
16.7.6. Country & Sub-region
17. Competition Assessment
17.1. Global InGaAs Image Sensor Market Competition Matrix - a Dashboard View
17.1.1. Global InGaAs Image Sensor Market Company Share Analysis, by Value (2020)
17.1.2. Technological Differentiator
18. Company Profiles (Manufacturers/Suppliers)
18.1. FLIR Systems, Inc.
18.1.1. Overview
18.1.2. Product Portfolio
18.1.3. Sales Footprint
18.1.4. Key Subsidiaries or Distributors
18.1.5. Strategy and Recent Developments
18.1.6. Financial Analysis
18.2. Ghopto
18.2.1. Overview
18.2.2. Product Portfolio
18.2.3. Sales Footprint
18.2.4. Key Subsidiaries or Distributors
18.2.5. Strategy and Recent Developments
18.2.6. Financial Analysis
18.3. Hamamatsu Photonics K.K.
18.3.1. Overview
18.3.2. Product Portfolio
18.3.3. Sales Footprint
18.3.4. Key Subsidiaries or Distributors
18.3.5. Strategy and Recent Developments
18.3.6. Financial Analysis
18.4. Lynred
18.4.1. Overview
18.4.2. Product Portfolio
18.4.3. Sales Footprint
18.4.4. Key Subsidiaries or Distributors
18.4.5. Strategy and Recent Developments
18.4.6. Financial Analysis
18.5. New Imaging Technologies
18.5.1. Overview
18.5.2. Product Portfolio
18.5.3. Sales Footprint
18.5.4. Key Subsidiaries or Distributors
18.5.5. Strategy and Recent Developments
18.5.6. Financial Analysis
18.6. Sensors Unlimited
18.6.1. Overview
18.6.2. Product Portfolio
18.6.3. Sales Footprint
18.6.4. Key Subsidiaries or Distributors
18.6.5. Strategy and Recent Developments
18.6.6. Financial Analysis
18.7. Sony Semiconductor Solutions Corporation
18.7.1. Overview
18.7.2. Product Portfolio
18.7.3. Sales Footprint
18.7.4. Key Subsidiaries or Distributors
18.7.5. Strategy and Recent Developments
18.7.6. Financial Analysis
18.8. SYNERGY OPTOSYSTEMS CO., LTD.
18.8.1. Overview
18.8.2. Product Portfolio
18.8.3. Sales Footprint
18.8.4. Key Subsidiaries or Distributors
18.8.5. Strategy and Recent Developments
18.8.6. Financial Analysis
18.9. Teledyne Digital Imaging Inc.
18.9.1. Overview
18.9.2. Product Portfolio
18.9.3. Sales Footprint
18.9.4. Key Subsidiaries or Distributors
18.9.5. Strategy and Recent Developments
18.9.6. Financial Analysis
18.10. Xenics nv
18.10.1. Overview
18.10.2. Product Portfolio
18.10.3. Sales Footprint
18.10.4. Key Subsidiaries or Distributors
18.10.5. Strategy and Recent Developments
18.10.6. Financial Analysis
19. Recommendation
19.1. Opportunity Assessment
19.1.1. By Type
19.1.2. By Wavelength
19.1.3. By Application
19.1.4. By Pixel Resolution
19.1.5. By End-use Industry
19.1.6. By Region
List of Tables
Table 1: Global InGaAs Image Sensor Market Revenue (US$ Mn), by Type , 2017–2031
Table 2: Global InGaAs Image Sensor Market Volume (Units), by Type , 2017–2031
Table 3: Global InGaAs Image Sensor Market Revenue (US$ Mn), by Wavelength, 2017–2031
Table 4: Global InGaAs Image Sensor Market Revenue (US$ Mn), by Application, 2017–2031
Table 5: Global InGaAs Image Sensor Market Revenue (US$ Mn), by Pixel Resolution, 2017–2031
Table 6: Global InGaAs Image Sensor Market Revenue (US$ Mn), by End-use Industry, 2017–2031
Table 7: Global InGaAs Image Sensor Market Revenue (US$ Mn), by Region, 2017–2031
Table 8: Global InGaAs Image Sensor Market Volume (Units), by Region, 2017–2031
Table 9: North America InGaAs Image Sensor Market Revenue (US$ Mn), by Type , 2017–2031
Table 10: North America InGaAs Image Sensor Market Volume (Units), by Type , 2017–2031
Table 11: North America InGaAs Image Sensor Market Revenue (US$ Mn), by Wavelength, 2017–2031
Table 12: North America InGaAs Image Sensor Market Revenue (US$ Mn), by Application, 2017–2031
Table 13: North America InGaAs Image Sensor Market Revenue (US$ Mn), by Pixel resolution, 2017–2031
Table 14: North America InGaAs Image Sensor Market Revenue (US$ Mn), by End-use Industry, 2017–2031
Table 15: North America InGaAs Image Sensor Market Revenue (US$ Mn), by Country, 2017–2031
Table 16: North America InGaAs Image Sensor Market Volume (Units), by Country, 2017–2031
Table 17: Europe InGaAs Image Sensor Market Revenue (US$ Mn), by Type , 2017–2031
Table 18: Europe InGaAs Image Sensor Market Volume (Units), by Type , 2017–2031
Table 19: Europe InGaAs Image Sensor Market Revenue (US$ Mn), by Wavelength, 2017–2031
Table 20: Europe InGaAs Image Sensor Market Revenue (US$ Mn), by Application, 2017–2031
Table 21: Europe InGaAs Image Sensor Market Revenue (US$ Mn), by Pixel resolution, 2017–2031
Table 22: Europe InGaAs Image Sensor Market Revenue (US$ Mn), by End-use Industry, 2017–2031
Table 23: Europe InGaAs Image Sensor Market Revenue (US$ Mn), by Country & Sub-region, 2017–2031
Table 24: Europe InGaAs Image Sensor Market Volume (Units), by Country & Sub-region, 2017–2031
Table 25: Asia Pacific InGaAs Image Sensor Market Revenue (US$ Mn), by Type , 2017–2031
Table 26: Asia Pacific InGaAs Image Sensor Market Volume (Units), by Type , 2017–2031
Table 27: Asia Pacific InGaAs Image Sensor Market Revenue (US$ Mn), by Wavelength, 2017–2031
Table 28: Asia Pacific InGaAs Image Sensor Market Revenue (US$ Mn), by Application, 2017–2031
Table 29: Asia Pacific InGaAs Image Sensor Market Revenue (US$ Mn), by Pixel resolution, 2017–2031
Table 30: Asia Pacific InGaAs Image Sensor Market Revenue (US$ Mn), by End-use Industry, 2017–2031
Table 31: Asia Pacific InGaAs Image Sensor Market Revenue (US$ Mn), by Country & Sub-region, 2017–2031
Table 32: Asia Pacific InGaAs Image Sensor Market Volume (Units), by Country & Sub-region, 2017–2031
Table 33: Middle East & Africa InGaAs Image Sensor Market Revenue (US$ Mn), by Type , 2017–2031
Table 34: Middle East & Africa InGaAs Image Sensor Market Volume (Units), By Type , 2017–2031
Table 35: Middle East & Africa InGaAs Image Sensor Market Revenue (US$ Mn), by Wavelength, 2017–2031
Table 36: Middle East & Africa InGaAs Image Sensor Market Revenue (US$ Mn), by Application, 2017–2031
Table 37: Middle East & Africa InGaAs Image Sensor Market Revenue (US$ Mn), by Pixel resolution, 2017–2031
Table 38: Middle East & Africa InGaAs Image Sensor Market Revenue (US$ Mn), by End-use Industry, 2017–2031
Table 39: Middle East & Africa InGaAs Image Sensor Market Revenue (US$ Mn), by Country & Sub-region, 2017–2031
Table 40: Middle East & Africa InGaAs Image Sensor Market Volume (Units), by Country & Sub-region, 2017–2031
Table 41: South America InGaAs Image Sensor Market Revenue (US$ Mn), by Type , 2017–2031
Table 42: South America InGaAs Image Sensor Market Volume (Units), by Type, 2017–2031
Table 43: South America InGaAs Image Sensor Market Revenue (US$ Mn), by Wavelength, 2017–2031
Table 44: South America InGaAs Image Sensor Market Revenue (US$ Mn), by Application, 2017–2031
Table 45: South America InGaAs Image Sensor Market Revenue (US$ Mn), by Pixel resolution, 2017–2031
Table 46: South America InGaAs Image Sensor Market Revenue (US$ Mn), by End-use Industry, 2017–2031
Table 47: South America InGaAs Image Sensor Market Revenue (US$ Mn), by Country & Sub-region, 2017–2031
Table 48: South America InGaAs Image Sensor Market Volume (Units), by Country & Sub-region, 2017–2031
List of Figures
Figure 1: Global InGaAs Image Sensor Market Value (US$ Mn) Forecast, 2021–2031
Figure 2: Global InGaAs Image Sensor Market Size Analysis (2017-2020) and Forecast (2021-2031)
Figure 3: Global InGaAs Image Sensor Market, by Linear Image Sensor
Figure 4: Global InGaAs Image Sensor Market, by Area Image Sensor
Figure 5: Global InGaAs Image Sensor Market Attractiveness Analysis, by Type
Figure 6: Global InGaAs Image Sensor Market, by Visible (VIS)
Figure 7: Global InGaAs Image Sensor Market, by Near Infrared (NIR)
Figure 8: Global InGaAs Image Sensor Market, by Short Wavelength Infrared (SWIR)
Figure 9: Global InGaAs Image Sensor Market Attractiveness Analysis, by Wavelength
Figure 10: Global InGaAs Image Sensor Market, by Surveillance & Security
Figure 11: Global InGaAs Image Sensor Market, by Spectroscopy and Spectrophotometry
Figure 12: Global InGaAs Image Sensor Market, by Non-Destructive Inspection
Figure 13: Global InGaAs Image Sensor Market, by Radiation Thermometry
Figure 14: Global InGaAs Image Sensor Market, by Foreign Object Detection
Figure 15: Global InGaAs Image Sensor Market, by (Food Inspection, Laboratory Measurements, etc.)
Figure 16: Global InGaAs Image Sensor Market Attractiveness Analysis, by Application
Figure 17: Global InGaAs Image Sensor Market, by 320x256
Figure 18: Global InGaAs Image Sensor Market, by 640x512
Figure 19: Global InGaAs Image Sensor Market, by Others
Figure 20: Global InGaAs Image Sensor Market Attractiveness Analysis, by Pixel resolution
Figure 21: Global InGaAs Image Sensor Market, by Aerospace & Defense
Figure 22: Global InGaAs Image Sensor Market, by Science & Research
Figure 23: Global InGaAs Image Sensor Market, by Industrial Automation
Figure 24: Global InGaAs Image Sensor Market, by Spectroscopy and Spectrophotometry
Figure 25: Global InGaAs Image Sensor Market, by Non-Destructive Inspection
Figure 26: Global InGaAs Image Sensor Market, by Radiation Thermometry
Figure 27: Global InGaAs Image Sensor Market, by Others (Agriculture, Semiconductor Testing, Traffic Monitoring, Logistics & Transportation etc.)
Figure 28: Global InGaAs Image Sensor Market Attractiveness Analysis, by End-use Industry
Figure 29: Global InGaAs Image Sensor Market Value Share Analysis, by Region (2021E)
Figure 30: Global InGaAs Image Sensor Market Value Share Analysis, by Region (2031F)
Figure 31: Global InGaAs Image Sensor Market Value Share Analysis, by Region (2021E)
Figure 32: Global InGaAs Image Sensor Market Value Share Analysis, by Region (2031F)
Figure 33: Global InGaAs Image Sensor Market Attractiveness Analysis, by Region
Figure 34: North America InGaAs Image Sensor Market Revenue (US$ Mn) Forecast, 2017–2031
Figure 35: North America InGaAs Image Sensor Market Y-o-Y Growth Projection, 2021–2031
Figure 36: North America InGaAs Image Sensor Market Volume (Units) Forecast, 2017–2031
Figure 37: North America InGaAs Image Sensor Market Y-o-Y Growth Projection, 2021–2031
Figure 38: North America InGaAs Image Sensor Market Value Share Analysis, by Type (2021)
Figure 39: North America InGaAs Image Sensor Market Value Share Analysis, by Type (2031)
Figure 40: North America InGaAs Image Sensor Market Volume Share Analysis, by Type (2021)
Figure 41: North America InGaAs Image Sensor Market Volume Share Analysis, by Type (2031)
Figure 42: North America InGaAs Image Sensor Market Value Share Analysis, by Wavelength (2021)
Figure 43: North America InGaAs Image Sensor Market Value Share Analysis, by Wavelength (2031)
Figure 44: North America InGaAs Image Sensor Market Value Share Analysis, by Application (2021)
Figure 45: North America InGaAs Image Sensor Market Value Share Analysis, by Application (2031)
Figure 46: North America InGaAs Image Sensor Market Value Share Analysis, by Pixel resolution (2021)
Figure 47: North America InGaAs Image Sensor Market Value Share Analysis, by Pixel resolution (2031)
Figure 48: North America InGaAs Image Sensor Market Value Share Analysis, by End-use Industry (2021)
Figure 49: North America InGaAs Image Sensor Market Value Share Analysis, by End-use Industry (2031)
Figure 50: North America InGaAs Image Sensor Market Value Share Analysis, by Country (2021)
Figure 51: North America InGaAs Image Sensor Market Value Share Analysis, by Country (2031)
Figure 52: North America InGaAs Image Sensor Market Volume Share Analysis, by Country (2021)
Figure 53: North America InGaAs Image Sensor Market Volume Share Analysis, by Country (2031)
Figure 54: North America InGaAs Image Sensor Market Attractiveness Analysis, by Type
Figure 55: North America InGaAs Image Sensor Market Attractiveness Analysis, by Wavelength
Figure 56: North America InGaAs Image Sensor Market Attractiveness Analysis, by Application
Figure 57: North America InGaAs Image Sensor Market Attractiveness Analysis, by Pixel Resolution
Figure 58: North America InGaAs Image Sensor Market Attractiveness Analysis, by End-use Industry
Figure 59: North America InGaAs Image Sensor Market Attractiveness Analysis, by Country
Figure 60: Europe InGaAs Image Sensor Market Revenue (US$ Mn) Forecast, 2017–2031
Figure 61: Europe InGaAs Image Sensor Market Y-o-Y Growth Projection, 2021–2031
Figure 62: Europe InGaAs Image Sensor Market Volume (Units) Forecast, 2017–2031
Figure 63: Europe InGaAs Image Sensor Market Y-o-Y Growth Projection, 2021–2031
Figure 64: Europe InGaAs Image Sensor Market Value Share Analysis, by Type (2021)
Figure 65: Europe InGaAs Image Sensor Market Value Share Analysis, by Type (2031)
Figure 66: Europe InGaAs Image Sensor Market Volume Share Analysis, by Type (2021)
Figure 67: Europe InGaAs Image Sensor Market Volume Share Analysis, by Type (2031)
Figure 68: Europe InGaAs Image Sensor Market Value Share Analysis, by Wavelength (2021)
Figure 69: Europe InGaAs Image Sensor Market Value Share Analysis, by Wavelength (2031)
Figure 70: Europe InGaAs Image Sensor Market Value Share Analysis, by Application (2021)
Figure 71: Europe InGaAs Image Sensor Market Value Share Analysis, by Application (2031)
Figure 72: Europe InGaAs Image Sensor Market Value Share Analysis, by Pixel resolution (2021)
Figure 73: Europe InGaAs Image Sensor Market Value Share Analysis, by Pixel resolution (2031)
Figure 74: Europe InGaAs Image Sensor Market Value Share Analysis, by End-use Industry (2021)
Figure 75: Europe InGaAs Image Sensor Market Value Share Analysis, by End-use Industry (2031)
Figure 76: Europe InGaAs Image Sensor Market Value Share Analysis, by Country & Sub-region (2021)
Figure 77: Europe InGaAs Image Sensor Market Value Share Analysis, by Country & Sub-region (2031)
Figure 78: Europe InGaAs Image Sensor Market Volume Share Analysis, by Country & Sub-region (2021)
Figure 79: Europe InGaAs Image Sensor Market Volume Share Analysis, by Country & Sub-region (2031)
Figure 80: Europe InGaAs Image Sensor Market Attractiveness Analysis, by Type
Figure 81: Europe InGaAs Image Sensor Market Attractiveness Analysis, by Wavelength
Figure 82: Europe InGaAs Image Sensor Market Attractiveness Analysis, by Application
Figure 83: Europe InGaAs Image Sensor Market Attractiveness Analysis, by Pixel Resolution
Figure 84: Europe InGaAs Image Sensor Market Attractiveness Analysis, by End-use Industry
Figure 85: Europe InGaAs Image Sensor Market Attractiveness Analysis, by Country & Sub-region
Figure 86: Asia Pacific InGaAs Image Sensor Market Revenue (US$ Mn) Forecast, 2017–2031
Figure 87: Asia Pacific InGaAs Image Sensor Market Y-o-Y Growth Projection, 2021–2031
Figure 88: Asia Pacific InGaAs Image Sensor Market Volume (Units) Forecast, 2017–2031
Figure 89: Asia Pacific InGaAs Image Sensor Market Y-o-Y Growth Projection, 2021–2031
Figure 90: Asia Pacific InGaAs Image Sensor Market Value Share Analysis, by Type (2021)
Figure 91: Asia Pacific InGaAs Image Sensor Market Value Share Analysis, by Type (2031)
Figure 92: Asia Pacific InGaAs Image Sensor Market Volume Share Analysis, by Type (2021)
Figure 93: Asia Pacific InGaAs Image Sensor Market Volume Share Analysis, by Type (2031)
Figure 94: Asia Pacific InGaAs Image Sensor Market Value Share Analysis, by Wavelength (2021)
Figure 95: Asia Pacific InGaAs Image Sensor Market Value Share Analysis, by Wavelength (2031)
Figure 96: Asia Pacific InGaAs Image Sensor Market Value Share Analysis, by Application (2021)
Figure 97: Asia Pacific InGaAs Image Sensor Market Value Share Analysis, by Application (2031)
Figure 98: Asia Pacific InGaAs Image Sensor Market Value Share Analysis, by Pixel resolution (2021)
Figure 99: Asia Pacific InGaAs Image Sensor Market Value Share Analysis, by Pixel resolution (2031)
Figure 100: Asia Pacific InGaAs Image Sensor Market Value Share Analysis, by End-use Industry (2021)
Figure 101: Asia Pacific InGaAs Image Sensor Market Value Share Analysis, by End-use Industry (2031)
Figure 102: Asia Pacific InGaAs Image Sensor Market Value Share Analysis, by Country & Sub-region (2021)
Figure 103: Asia Pacific InGaAs Image Sensor Market Value Share Analysis, by Country & Sub-region (2031)
Figure 104: Asia Pacific InGaAs Image Sensor Market Volume Share Analysis, by Country & Sub-region (2021)
Figure 105: Asia Pacific InGaAs Image Sensor Market Volume Share Analysis, by Country & Sub-region (2031)
Figure 106: Asia Pacific InGaAs Image Sensor Market Attractiveness Analysis, by Type
Figure 107: Asia Pacific InGaAs Image Sensor Market Attractiveness Analysis, by Wavelength
Figure 108: Asia Pacific InGaAs Image Sensor Market Attractiveness Analysis, by Application
Figure 109: Asia Pacific InGaAs Image Sensor Market Attractiveness Analysis, by Pixel Resolution
Figure 110: Asia Pacific InGaAs Image Sensor Market Attractiveness Analysis, by End-use Industry
Figure 111: Asia Pacific InGaAs Image Sensor Market Attractiveness Analysis, by Country & Sub-region
Figure 112: Middle East & Africa InGaAs Image Sensor Market Revenue (US$ Mn) Forecast, 2017–2031
Figure 113: Middle East & Africa InGaAs Image Sensor Market Y-o-Y Growth Projection, 2021–2031
Figure 114: Middle East & Africa InGaAs Image Sensor Market Volume (Units) Forecast, 2017–2031
Figure 115: Middle East & Africa InGaAs Image Sensor Market Y-o-Y Growth Projection, 2021–2031
Figure 116: Middle East & Africa InGaAs Image Sensor Market Value Share Analysis, by Type (2021)
Figure 117: Middle East & Africa InGaAs Image Sensor Market Value Share Analysis, by Type (2031)
Figure 118: Middle East & Africa InGaAs Image Sensor Market Volume Share Analysis, by Type (2021)
Figure 119: Middle East & Africa InGaAs Image Sensor Market Volume Share Analysis, by Type (2031)
Figure 120: Middle East & Africa InGaAs Image Sensor Market Value Share Analysis, by Wavelength (2021)
Figure 121: Middle East & Africa InGaAs Image Sensor Market Value Share Analysis, by Wavelength (2031)
Figure122: Middle East & Africa InGaAs Image Sensor Market Value Share Analysis, by Application (2021)
Figure 123: Middle East & Africa InGaAs Image Sensor Market Value Share Analysis, by Application (2031)
Figure 124: Middle East & Africa InGaAs Image Sensor Market Value Share Analysis, by Pixel resolution (2021)
Figure 125: Middle East & Africa InGaAs Image Sensor Market Value Share Analysis, by Pixel resolution (2031)
Figure 126: Middle East & Africa InGaAs Image Sensor Market Value Share Analysis, by End-use Industry (2021)
Figure 127: Middle East & Africa InGaAs Image Sensor Market Value Share Analysis, by End-use Industry (2031)
Figure 128: Middle East & Africa InGaAs Image Sensor Market Value Share Analysis, by Country & Sub-region (2021)
Figure 129: Middle East & Africa InGaAs Image Sensor Market Value Share Analysis, by Country & Sub-region (2031)
Figure 130: Middle East & Africa InGaAs Image Sensor Market Volume Share Analysis, by Country & Sub-region (2021)
Figure 131: Middle East & Africa InGaAs Image Sensor Market Volume Share Analysis, by Country & Sub-region (2031)
Figure 132: Middle East & Africa InGaAs Image Sensor Market Attractiveness Analysis, by Type
Figure 133: Middle East & Africa InGaAs Image Sensor Market Attractiveness Analysis, by Wavelength
Figure 134: Middle East & Africa InGaAs Image Sensor Market Attractiveness Analysis, by Application
Figure 135: Middle East & Africa InGaAs Image Sensor Market Attractiveness Analysis, by Pixel Resolution
Figure 136: Middle East & Africa InGaAs Image Sensor Market Attractiveness Analysis, by End-use Industry
Figure 137: Middle East & Africa InGaAs Image Sensor Market Attractiveness Analysis, by Country & Sub-region
Figure 138: South America InGaAs Image Sensor Market Revenue (US$ Mn) Forecast, 2017–2031
Figure 139: South America InGaAs Image Sensor Market Y-o-Y Growth Projection, 2021–2031
Figure 140: South America InGaAs Image Sensor Market Volume (Units) Forecast, 2017–2031
Figure 141: South America InGaAs Image Sensor Market Y-o-Y Growth Projection, 2021–2031
Figure 142: South America InGaAs Image Sensor Market Value Share Analysis, by Type (2021)
Figure 143: South America InGaAs Image Sensor Market Value Share Analysis, by Type (2031)
Figure 144: South America InGaAs Image Sensor Market Volume Share Analysis, by Type (2021)
Figure 145: South America InGaAs Image Sensor Market Volume Share Analysis, by Type (2031)
Figure 146: South America InGaAs Image Sensor Market Value Share Analysis, by Wavelength (2021)
Figure 147: South America InGaAs Image Sensor Market Value Share Analysis, by Wavelength (2031)
Figure 148: South America InGaAs Image Sensor Market Value Share Analysis, by Application (2021)
Figure 149: South America InGaAs Image Sensor Market Value Share Analysis, by Application (2031)
Figure 150: South America InGaAs Image Sensor Market Value Share Analysis, by Pixel resolution (2021)
Figure 151: South America InGaAs Image Sensor Market Value Share Analysis, by Pixel resolution (2031)
Figure 152: South America InGaAs Image Sensor Market Value Share Analysis, by End-use Industry (2021)
Figure 153: South America InGaAs Image Sensor Market Value Share Analysis, by End-use Industry (2031)
Figure 154: South America InGaAs Image Sensor Market Value Share Analysis, by Country & Sub-region (2021)
Figure 155: South America InGaAs Image Sensor Market Value Share Analysis, by Country & Sub-region (2031)
Figure 156: South America InGaAs Image Sensor Market Volume Share Analysis, by Country & Sub-region (2021)
Figure 157: South America InGaAs Image Sensor Market Volume Share Analysis, by Country & Sub-region (2031)
Figure 158: South America InGaAs Image Sensor Market Attractiveness Analysis, by Type
Figure 159: South America InGaAs Image Sensor Market Attractiveness Analysis, by Wavelength
Figure 160: South America InGaAs Image Sensor Market Attractiveness Analysis, by Application
Figure 161: South America InGaAs Image Sensor Market Attractiveness Analysis, by Pixel Resolution
Figure 162: South America InGaAs Image Sensor Market Attractiveness Analysis, by End-use Industry
Figure 163: South America InGaAs Image Sensor Market Attractiveness Analysis, by Country & Sub-region
Copyright © Transparency Market Research, Inc. All Rights reserved
Trust Online

InGaAs Image Sensor Market Forecast Report, 2021-2031