
Reports
Reports
Analysts’ Viewpoint on Industrial Water Service Market Scenario
“Disruptions in the Indian agriculture sector due to the coronavirus outbreak have led to reported decrease in reservoir releases for irrigation. Companies in the industrial water service market are gaining a strong research base in corrosion control, nanofiltration, and electro-deionization technologies. However, there is a need for industrial water services that prevent slowing down of operations at power generation plant. In order to overcome this challenge, companies are working closely with service providers and equipment manufacturers to address operational challenges at cooling towers, and fossil power and nuclear power plants. There is a need for guidelines and programs by the government to help stakeholders in India’s textile industry to adopt the circularity framework for management of toxic wastewater.”
The coronavirus crisis has had an impact on the food and agricultural sector of the Indian economy. This has led to ripple effects in the industrial water service market, since lockdown measures have suspended and postponed agricultural activities for, at least, a couple of months. This has a direct impact on water withdrawals for irrigation, crop production, and allied sectors. As such, mass vaccination programs are anticipated to normalize agricultural activities and revive market growth in the Indian agricultural sector.
It has been found that a decline in food grain production in India during the COVID-19 lockdown period led to massive reverse migration, resulting in labor shortage. However, stakeholders in the industrial water service market are expecting the growth of the financial year of 2022 as compared to 2021 due to improving market sentiments.
Continuous developments in the industrial water service market are translating into revenue opportunities for market stakeholders. However, there is a need for smart water network solutions that improve the efficiency and reliability of the physical water infrastructure through collection and analysis of data. Hence, market stakeholders are increasing their R&D in IoT (Internet of Things) devices and data analytics tools that not only help to better manage the infrastructure but also reduce non-revenue water losses.
IoT devices and data analytics tools hold promising potentials to support important changes to the ways in which water utilities and companies operate. Companies in the industrial water service market are increasing efforts to establish smart end-to-end water networks that offer the opportunity to improve productivity and efficiency whilst enhancing customer service.
Stakeholders in India’s textile industry are facing challenges in managing toxic wastewater as a result of the rapidly growing fashion sector. Such findings are triggering the demand for a circularity framework that will encourage stakeholders in the textile industry to participate and integrate circular practices.
The circularity framework in the Indian textile and fashion industries holds potential for increased knowledge sharing. There is a need for clear ownership and funding to drive multi-stakeholder engagement to mitigate risks and connect to opportunities that help to achieve the desired outcome.
Innovative solutions to water and wastewater treatment are being preferred by stakeholders in the metal finishing and textile manufacturing business. Complete Water Services, LLC. is taking advantage of this opportunity to provide solutions for cleaning & surface preparation in the metal finishing industry and provide pre-treatment solutions for stakeholders in the textile manufacturing industry.
Since the metal finishing industry in the U.S. is regulated by the USEPA (United States Environmental Protection Agency) Federal Categorical Standards, companies in the industrial water service market need to design systems that handle the unique challenges of water and wastewater treatment requirements. In order to achieve this, companies in the industrial water service market are increasing the availability of customized services that simplify field construction activity.
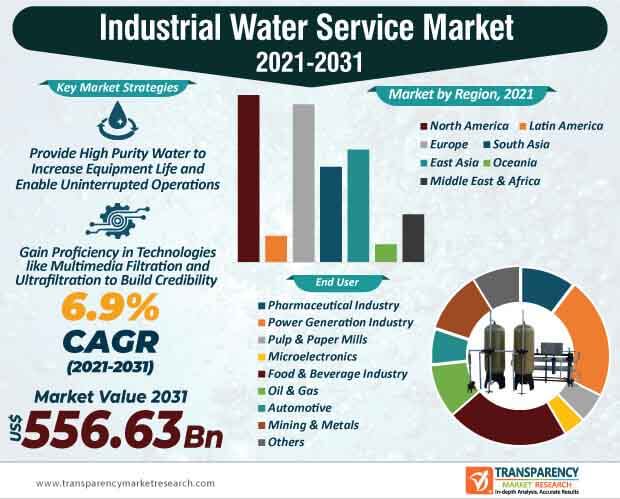
The revenue of water supply management is predicted to dominate the highest revenue among all service types in the industrial water service market. Lenntech - a specialist in water treatment and purification is building its portfolio in industrial water supply, pertaining to waste water reuse, and boiler feed water, among other applications. Companies are boosting their proficiency in technologies such as multimedia filtration, ultrafiltration, and reserve osmosis to build their credibility credentials.
Companies are increasing the availability of solutions in microbiology control, condensate treatment, coarse & fine filtration, and the likes.
Power generation is one of the key revenue generating industries for stakeholders in the industrial water service market. DuPont Water Solutions is gaining recognition for supplying high purity water to increase equipment life, prevent corrosion, and enable uninterrupted operation. Companies are bolstering their services toward fossil and nuclear power plants.
Companies in the industrial water service market are working closely with service providers and equipment manufacturers to provide whole and integrated solutions to stakeholders in the power generation industry. Since cooling tower water can present a number of operational challenges, companies are increasing their capabilities in cooling tower blowdown recycling solutions.
Companies in the industrial water service market are continuously expanding their water production capacity and improving their wastewater treatment capabilities to serve its industrial customers. They are using processes of sedimentation, filtration, and chlorination for disinfection to produce processed water, which is being used in the electronics, automotive, and food industries.
Manufacturers are boosting output capacities in clarified water, which is produced using low quantity and concentration of chlorine. There is increasing the demand for clarified water in heavy industries such as petrochemicals. Premium clarified water is being produced using the reverse osmosis technology and is being preferred over conventional clarified water, owing to the former’s better quality. Manufacturers are bolstering the production of demineralized water, which is driving the demand in petrochemicals, electronics, and power generation industries.
Apart from petrochemicals and power generation industries, companies are unlocking incremental opportunities in the agriculture industry. Positive developments such as erosion risk management, flood warning systems, and precision farming systems are changing the market landscape and the overall agriculture sector. Since the world population is anticipated to cross nine billion by 2050, market stakeholders are establishing smart and intelligent network technologies using IoT devices and data analytics tools to stay future-ready.
|
Attribute |
Detail |
|
Market Size Value in 2021 |
US$ 285.2 Bn |
|
Market Forecast Value in 2031 |
US$ 556.6 Bn |
|
Growth Rate (CAGR) |
6.9% |
|
Forecast Period |
2021-2031 |
|
Quantitative Units |
US$ Mn for Value & Tons for Volume |
|
Market Analysis |
It includes cross segment analysis at global as well as regional level. Furthermore, qualitative analysis includes drivers, restraints, opportunities, key trends, Porters Five Forces analysis, supply chain analysis, parent industry overview, etc. |
|
Competition Landscape |
|
|
Format |
Electronic (PDF) + Excel |
|
Market Segmentation |
|
|
Regions Covered |
|
|
Countries Covered |
|
|
Companies Profiled |
|
|
Customization Scope |
Available upon Request |
|
Pricing |
Available upon Request |
Industrial Water Service Market is expected to Reach US$ 556.6 Bn In 2031
Industrial Water Service Market is estimated to rise at a CAGR of 6.9% during forecast period
Increasing the demand for clarified water in heavy industries such as petrochemicals is expected to drive the Industrial Water Service Market
North America is more attractive for vendors in the Industrial Water Service Market
Key players of Industrial Water Service Market are Salher, Dober, Veolia Environment, American Water, Ecolab, PARKER HANNIFIN CORP, Pentair, Evoqua Water Technologies LLC, Suez Environnement S.A, United Utilities Group PLC, Xylem, Inc., Danaher Corporation, DuPont, Toshiba Corporation, etc.
1. Executive Summary
1.1. Global Market Outlook
1.2. Demand Side Trends
1.3. Supply Side Trends
1.4. Analysis and Recommendations
2. Market Overview
2.1. Market Coverage / Taxonomy
2.2. Market Definition / Scope / Limitations
3. Key Market Trends
3.1. Key Trends Impacting the Market
3.2. Product Innovation / Development Trends
4. Key Success Factors
4.1. Product Adoption / Usage Analysis
4.2. Product USPs / Features
4.3. Strategic Promotional Strategies
5. Global Industrial Water Service Market Demand (in Value or Size in US$ Mn) Analysis 2016-2020 and Forecast, 2021-2031
5.1. Historical Market Value (US$ Mn) Analysis, 2016-2020
5.2. Current and Future Market Value (US$ Mn) Projections, 2021-2031
5.2.1. Y-o-Y Growth Trend Analysis
5.2.2. Absolute $ Opportunity Analysis
6. Market Background
6.1. Macro-Economic Factors
6.1.1. Global GDP Growth Outlook
6.1.2. Global Industry Value Added
6.1.3. Global Urbanization Growth Outlook
6.1.4. Global Food Security Index Outlook
6.1.5. Global Rank – Ease of Doing Business
6.1.6. Global Rank – Trading Across Borders
6.2. Impact of COVID-19 on Industrial Water Service Market
6.2.1. Processors/Service Providers
6.2.2. Supply Chain and Logistics
6.2.3. End User
6.3. Impact of COVID-19 on Food & Beverage Market
6.4. Global Food & Beverage Market Outlook
6.5. Global Cosmetic & Personal Care Industry Outlook
6.6. Global Pharmaceutical Industry Outlook
6.7. Market Scenario by Key Countries
6.8. Water Treatment Market - Value Chain Analysis
6.9. Global Water Market Outlook
6.10. End-user Industry Demand Analysis
6.11. Key Regulations/Certifications
6.12. Market Dynamics
6.12.1. Drivers
6.12.2. Restraints
6.12.3. Opportunity Analysis
6.13. Forecast Factors - Relevance & Impact
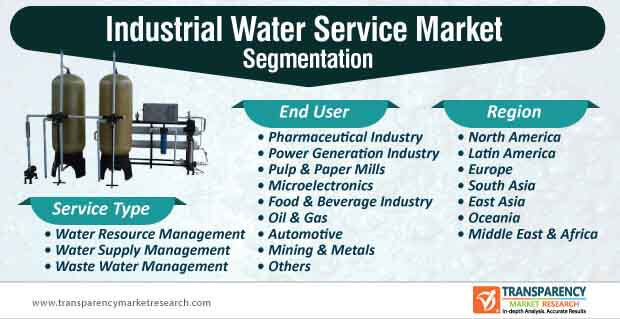
7. Global Industrial Water Service Market Analysis 2016-2020 and Forecast 2021-2031, By Service Type
7.1. Introduction / Key Findings
7.2. Historical Market Size (US$ Mn) By Service Type 2016 - 2020
7.3. Current and Future Market Size (US$ Mn) and Forecast By Service Type, 2021-2031
7.3.1. Water Resources Management
7.3.2. Water Supply Management
7.3.3. Waste Water Management
7.4. Market Attractiveness Analysis By Service Type
8. Global Industrial Water Service Market Analysis 2016-2020 and Forecast 2021-2031, By End User
8.1. Introduction / Key Findings
8.2. Historical Market Size (US$ Mn) By End User, 2016 - 2020
8.3. Current and Future Market Size (US$ Mn) and Forecast By End User, 2021-2031
8.3.1. Pharmaceutical Industry
8.3.2. Power Generation Industry
8.3.3. Pulp & Paper Mills
8.3.4. Microelectronics
8.3.5. Food & Beverage Industry
8.3.6. Oil & Gas
8.3.7. Automotive
8.3.8. Mining & Metals
8.3.9. Other
8.4. Market Attractiveness Analysis By End User
9. Global Industrial Water Service Market Analysis 2016-2020 and Forecast 2021-2031, by Region
9.1. Introduction
9.2. Historical Market Size (US$ Mn) By Region, 2016 - 2020
9.3. Current Market Size (US$ Mn) and Forecast By Region, 2021-2031
9.3.1. North America
9.3.2. Latin America
9.3.3. Europe
9.3.4. East Asia
9.3.5. South Asia
9.3.6. Oceania
9.3.7. Middle East and Africa
9.4. Market Attractiveness Analysis By Region
10. North America Industrial Water Service Market Analysis 2016-2020 and Forecast 2021-2031
10.1. Introduction
10.2. Historical Market Size (US$ Mn) Analysis By Market Taxonomy, 2016 - 2020
10.3. Market Size (US$ Mn) and Forecast By Market Taxonomy, 2021-2031
10.3.1. By Country
10.3.2. By Service Type
10.3.3. By End User
10.4. Market Attractiveness Analysis
10.4.1. By Country
10.4.2. By Service Type
10.4.3. By End User
10.5. Drivers and Restraints - Impact Analysis
11. Latin America Industrial Water Service Market Analysis 2016-2020 and Forecast 2021-2031
11.1. Introduction
11.2. Historical Market Size (US$ Mn) Analysis By Market Taxonomy, 2016 - 2020
11.3. Market Size (US$ Mn) and Forecast By Market Taxonomy, 2021-2031
11.3.1. By Country
11.3.2. By Service Type
11.3.3. By End User
11.4. Market Attractiveness Analysis
11.4.1. By Country
11.4.2. By Service Type
11.4.3. By End User
11.5. Drivers and Restraints - Impact Analysis
12. Europe Industrial Water Service Market Analysis 2016-2020 and Forecast 2021-2031
12.1. Introduction
12.2. Historical Market Size (US$ Mn) Analysis By Market Taxonomy, 2016 - 2020
12.3. Market Size (US$ Mn) and Forecast By Market Taxonomy, 2021-2031
12.3.1. By Country
12.3.1.1. Germany
12.3.1.2. Italy
12.3.1.3. France
12.3.1.4. U.K.
12.3.1.5. Spain
12.3.1.6. BENELUX
12.3.1.7. Nordic
12.3.1.8. Russia
12.3.1.9. Poland
12.3.1.10. Rest of Europe
12.3.2. By Nature
12.3.3. By Service Type
12.3.4. By End User
12.4. Market Attractiveness Analysis
12.4.1. By Country
12.4.2. By Service Type
12.4.3. By End User
12.5. Drivers and Restraints - Impact Analysis
13. South Asia Industrial Water Service Market Analysis 2016-2020 and Forecast 2021-2031
13.1. Introduction
13.2. Historical Market Size (US$ Mn) Analysis By Market Taxonomy, 2016 - 2020
13.3. Market Size (US$ Mn) and Forecast By Market Taxonomy, 2021-2031
13.3.1. By Country
13.3.1.1. India
13.3.1.2. Thailand
13.3.1.3. Indonesia
13.3.1.4. Malaysia
13.3.1.5. Rest of South Asia
13.3.2. By Service Type
13.3.3. By End User
13.3.4. By Sales Channel
13.4. Market Attractiveness Analysis
13.4.1. By Country
13.4.2. By Service Type
13.4.3. By End User
13.4.4. By Sales Channel
13.5. Key Market Participants - Intensity Mapping
13.6. Drivers and Restraints - Impact Analysis
14. East Asia Industrial Water Service Market Analysis 2016-2020 and Forecast 2021-2031
14.1. Introduction
14.2. Historical Market Size (US$ Mn) Analysis By Market Taxonomy, 2016 - 2020
14.3. Market Size (US$ Mn) and Forecast By Market Taxonomy, 2021-2031
14.3.1. By Country
14.3.1.1. China
14.3.1.2. South Korea
14.3.1.3. Japan
14.3.2. By Service Type
14.3.3. By End User
14.4. Market Attractiveness Analysis
14.4.1. By Country
14.4.2. By Service Type
14.4.3. By End User
14.5. Drivers and Restraints - Impact Analysis
15. Oceania Industrial Water Service Market Analysis 2016-2020 and Forecast 2021-2031
15.1. Introduction
15.2. Historical Market Size (US$ Mn) Analysis By Market Taxonomy, 2016 - 2020
15.3. Market Size (US$ Mn) and Forecast By Market Taxonomy, 2021-2031
15.3.1. By Country
15.3.1.1. Australia
15.3.1.2. New Zealand
15.3.2. By Service Type
15.3.3. By End User
15.4. Market Attractiveness Analysis
15.4.1. By Country
15.4.2. By Service Type
15.4.3. By End User
15.5. Drivers and Restraints - Impact Analysis
16. Middle East and Africa Industrial Water Service Market Analysis 2016-2020 and Forecast 2021-2031
16.1. Introduction
16.2. Historical Market Size (US$ Mn) Analysis By Market Taxonomy, 2016 - 2020
16.3. Market Size (US$ Mn) and Forecast By Market Taxonomy, 2021-2031
16.3.1. By Country
16.3.1.1. GCC Countries
16.3.1.2. South Africa
16.3.1.3. Rest of Middle East and Africa
16.3.2. By Service Type
16.3.3. By End User
16.4. Market Attractiveness Analysis
16.4.1. By Country
16.4.2. By Service Type
16.4.3. By End User
16.5. Drivers and Restraints - Impact Analysis
17. Market Structure Analysis
17.1. Market Analysis by Tier of Companies
17.2. Market Concentration
17.3. Market Presence Analysis
18. Competition Analysis
18.1. Competition Dashboard
18.2. Competition Deep Dive
18.2.1. Ecolab
18.2.1.1. Overview
18.2.1.2. Product Portfolio/Key Brands
18.2.1.3. Sales Footprint
18.2.1.4. Key Developments/Key Takeaways
18.2.1.5. Strategy Overview
18.2.2. The Danaher Corporation
18.2.2.1. Overview
18.2.2.2. Product Portfolio/Key Brands
18.2.2.3. Sales Footprint
18.2.2.4. Key Developments/Key Takeaways
18.2.2.5. Strategy Overview
18.2.3. Xylem Inc.
18.2.3.1. Overview
18.2.3.2. Product Portfolio/Key Brands
18.2.3.3. Sales Footprint
18.2.3.4. Key Developments/Key Takeaways
18.2.3.5. Strategy Overview
18.2.4. Suez Environnement S.A.
18.2.4.1. Overview
18.2.4.2. Product Portfolio/Key Brands
18.2.4.3. Sales Footprint
18.2.4.4. Key Developments/Key Takeaways
18.2.4.5. Strategy Overview
18.2.5. United Utilities Group PLC
18.2.5.1. Overview
18.2.5.2. Product Portfolio/Key Brands
18.2.5.3. Sales Footprint
18.2.5.4. Key Developments/Key Takeaways
18.2.5.5. Strategy Overview
18.2.6. DuPont
18.2.6.1. Overview
18.2.6.2. Product Portfolio/Key Brands
18.2.6.3. Sales Footprint
18.2.6.4. Key Developments/Key Takeaways
18.2.6.5. Strategy Overview
18.2.7. American Water
18.2.7.1. Overview
18.2.7.2. Product Portfolio/Key Brands
18.2.7.3. Sales Footprint
18.2.7.4. Key Developments/Key Takeaways
18.2.7.5. Strategy Overview
18.2.8. Hitachi, Ltd.
18.2.8.1. Overview
18.2.8.2. Product Portfolio/Key Brands
18.2.8.3. Sales Footprint
18.2.8.4. Key Developments/Key Takeaways
18.2.8.5. Strategy Overview
18.2.9. Salher
18.2.9.1. Overview
18.2.9.2. Product Portfolio/Key Brands
18.2.9.3. Sales Footprint
18.2.9.4. Key Developments/Key Takeaways
18.2.9.5. Strategy Overview
18.2.10. Toshiba Corporation
18.2.10.1. Overview
18.2.10.2. Product Portfolio/Key Brands
18.2.10.3. Sales Footprint
18.2.10.4. Key Developments/Key Takeaways
18.2.10.5. Strategy Overview
18.2.11. Dober
18.2.11.1. Overview
18.2.11.2. Product Portfolio/Key Brands
18.2.11.3. Sales Footprint
18.2.11.4. Key Developments/Key Takeaways
18.2.11.5. Strategy Overview
18.2.12. Veolia Environnement
18.2.12.1. Overview
18.2.12.2. Product Portfolio/Key Brands
18.2.12.3. Sales Footprint
18.2.12.4. Key Developments/Key Takeaways
18.2.12.5. Strategy Overview
18.2.13. PARKER HANNIFIN CORP
18.2.13.1. Overview
18.2.13.2. Product Portfolio/Key Brands
18.2.13.3. Sales Footprint
18.2.13.4. Key Developments/Key Takeaways
18.2.13.5. Strategy Overview
18.2.14. Pentair
18.2.14.1. Overview
18.2.14.2. Product Portfolio/Key Brands
18.2.14.3. Sales Footprint
18.2.14.4. Key Developments/Key Takeaways
18.2.14.5. Strategy Overview
18.2.15. Evoqua Water Technologies LLC
18.2.15.1. Overview
18.2.15.2. Product Portfolio/Key Brands
18.2.15.3. Sales Footprint
18.2.15.4. Key Developments/Key Takeaways
18.2.15.5. Strategy Overview
18.2.16. Others (on demand)
19. Assumptions and Acronyms Used
20. Research Methodology
List of Tables
Table 01: Global Industrial Water Service Market Value (US$ Mn) Analysis and Forecast by Service Type, 2016-2031
Table 02: Global Industrial Water Service Market Value (US$ Mn) Analysis and Forecast by End User, 2016-2031
Table 03: Global Industrial Water Service Market Value (US$ Mn) Analysis and Forecast by Region, 2016-2031
Table 04: North America Industrial Water Service Market Value (US$ Mn) Analysis and Forecast by Service Type, 2016-2031
Table 05: North America Industrial Water Service Market Value (US$ Mn) Analysis and Forecast by End User, 2016-2031
Table 06: North America Industrial Water Service Market Value (US$ Mn) Analysis and Forecast by Country, 2015–2030
Table 07: Latin America Industrial Water Service Market Value (US$ Mn) Analysis and Forecast by Service Type, 2016-2031
Table 08: Latin America Industrial Water Service Market Value (US$ Mn) Analysis and Forecast by End User, 2016-2031
Table 09: Latin America Industrial Water Service Market Value (US$ Mn) Analysis and Forecast by Country, 2015–2030
Table 10: Europe Industrial Water Service Market Value (US$ Mn) Analysis and Forecast by Service Type, 2016-2031
Table 11: Europe Industrial Water Service Market Value (US$ Mn) Analysis and Forecast by End User, 2016-2031
Table 12: Europe Industrial Water Service Market Value (US$ Mn) Analysis and Forecast by Country, 2015–2030
Table 13: South Asia Industrial Water Service Market Value (US$ Mn) Analysis and Forecast by Service Type, 2016-2031
Table 14: South Asia Industrial Water Service Market Value (US$ Mn) Analysis and Forecast by End User, 2016-2031
Table 15: South Asia Industrial Water Service Market Value (US$ Mn) Analysis and Forecast by Country, 2015–2030
Table 16: East Asia Industrial Water Service Market Value (US$ Mn) Analysis and Forecast by Service Type, 2016-2031
Table 17: East Asia Industrial Water Service Market Value (US$ Mn) Analysis and Forecast by End User, 2016-2031
Table 18: East Asia Industrial Water Service Market Value (US$ Mn) Analysis and Forecast by Country, 2015–2030
Table 19: Oceania Industrial Water Service Market Value (US$ Mn) Analysis and Forecast by Service Type, 2016-2031
Table 20: Oceania Industrial Water Service Market Value (US$ Mn) Analysis and Forecast by End User, 2016-2031
Table 21: Oceania Industrial Water Service Market Value (US$ Mn) Analysis and Forecast by Country, 2015–2030
Table 22: Middle East & Africa Industrial Water Service Market Value (US$ Mn) Analysis and Forecast by Service Type, 2016-2031
Table 23: Middle East & Africa Industrial Water Service Market Value (US$ Mn) Analysis and Forecast by End User, 2016-2031
Table 24: Middle East & Africa Industrial Water Service Market Value (US$ Mn) Analysis and Forecast by Country, 2016–2031
List of Figures
Figure 01: Global Industrial Water Service Market Value (US$ Bn) Forecast, 2021 –2031
Figure 02: Global Industrial Water Service Market Value Share Analysis by Service Type, 2021 E
Figure 03: Global Industrial Water Service Market Y-o-Y Growth Rate by Service Type, 2021-2031
Figure 04: Global Industrial Water Service Market Value (US$ Mn) Analysis & Forecast by Service Type, 2021–2031
Figure 05: Global Industrial Water Service Market Value Share Analysis by End User, 2021 E
Figure 06: Global Industrial Water Service Market Y-o-Y Growth Rate by End User, 2021-2031
Figure 07: Global Industrial Water Service Market Value (US$ Mn) Analysis & Forecast by End User, 2021–2031
Figure 08: Global Industrial Water Service Market Value Share Analysis by Region, 2021 E
Figure 09: Global Industrial Water Service Market Y-o-Y Growth Rate by Region, 2021-2031
Figure 10: Global Industrial Water Service Market Value (US$ Mn) Analysis & Forecast by Region, 2021–2031
Figure 11: Global Industrial Water Service Market Attractiveness Analysis by Region, 2021-2031
Figure 12: Global Industrial Water Service Market Attractiveness Analysis by Service Type, 2021-2031
Figure 13: Global Industrial Water Service Market Attractiveness Analysis by End User, 2021-2031
Figure 14: North America Industrial Water Service Market Value (US$ Mn) Analysis & Forecast by Service Type, 2021–2031
Figure 15: North America Industrial Water Service Market Value (US$ Mn) Analysis & Forecast by End User, 2021–2031
Figure 16: North America Industrial Water Service Market Value (US$ Mn) Analysis & Forecast by Country, 2021–2031
Figure 17: North America Industrial Water Service Market Attractiveness Analysis by Country, 2021-2031
Figure 18: North America Industrial Water Service Market Attractiveness Analysis by Service Type, 2021-2031
Figure 19: North America Industrial Water Service Market Attractiveness Analysis by End User, 2021-2031
Figure 20: Latin America Industrial Water Service Market Value (US$ Mn) Analysis & Forecast by Service Type, 2021–2031
Figure 21: Latin America Industrial Water Service Market Value (US$ Mn) Analysis & Forecast by End User, 2021–2031
Figure 22: Latin America Industrial Water Service Market Value (US$ Mn) Analysis & Forecast by Country, 2021–2031
Figure 23: Latin America Industrial Water Service Market Attractiveness Analysis by Country, 2021-2031
Figure 24: Latin America Industrial Water Service Market Attractiveness Analysis by Service Type, 2021-2031
Figure 25: Latin America Industrial Water Service Market Attractiveness Analysis by End User, 2021-2031
Figure 26: Europe Industrial Water Service Market Value (US$ Mn) Analysis & Forecast by Service Type, 2021–2031
Figure 27: Europe Industrial Water Service Market Value (US$ Mn) Analysis & Forecast by End User, 2021–2031
Figure 28: Europe Industrial Water Service Market Value (US$ Mn) Analysis & Forecast by Country, 2021–2031
Figure 29: Europe Industrial Water Service Market Attractiveness Analysis by Country, 2021-2031
Figure 30: Europe Industrial Water Service Market Attractiveness Analysis by Service Type, 2021-2031
Figure 31: Europe Industrial Water Service Market Attractiveness Analysis by End User, 2021-2031
Figure 32: South Asia Industrial Water Service Market Value (US$ Mn) Analysis & Forecast by Service Type, 2021–2031
Figure 33: South Asia Industrial Water Service Market Value (US$ Mn) Analysis & Forecast by End User, 2021–2031
Figure 34: South Asia Industrial Water Service Market Value (US$ Mn) Analysis & Forecast by Country, 2021–2031
Figure 35: South Asia Industrial Water Service Market Attractiveness Analysis by Country, 2021-2031
Figure 36: South Asia Industrial Water Service Market Attractiveness Analysis by Service Type, 2021-2031
Figure 37: South Asia Industrial Water Service Market Attractiveness Analysis by End User, 2021-2031
Figure 38: East Asia Industrial Water Service Market Value (US$ Mn) Analysis & Forecast by Service Type, 2021–2031
Figure 39: East Asia Industrial Water Service Market Value (US$ Mn) Analysis & Forecast by End User, 2021–2031
Figure 40: East Asia Industrial Water Service Market Value (US$ Mn) Analysis & Forecast by Country, 2021–2031
Figure 41: East Asia Industrial Water Service Market Attractiveness Analysis by Country, 2021-2031
Figure 42: East Asia Industrial Water Service Market Attractiveness Analysis by Service Type, 2021-2031
Figure 43: East Asia Industrial Water Service Market Attractiveness Analysis by End User, 2021-2031
Figure 44: Oceania Industrial Water Service Market Value (US$ Mn) Analysis & Forecast by Service Type, 2021–2031
Figure 45: Oceania Industrial Water Service Market Value (US$ Mn) Analysis & Forecast by End User, 2021–2031
Figure 46: Oceania Industrial Water Service Market Value (US$ Mn) Analysis & Forecast by Country, 2021–2031
Figure 47: Oceania Industrial Water Service Market Attractiveness Analysis by Country, 2021-2031
Figure 48: Oceania Industrial Water Service Market Attractiveness Analysis by Service Type, 2021-2031
Figure 49: Oceania Industrial Water Service Market Attractiveness Analysis by End User, 2021-2031
Figure 50: Middle East & Africa Industrial Water Service Market Value (US$ Mn) Analysis & Forecast by Service Type, 2021–2031
Figure 51: Middle East & Africa Industrial Water Service Market Value (US$ Mn) Analysis & Forecast by End User, 2021–2031
Figure 53: Middle East & Africa Industrial Water Service Market Attractiveness Analysis by Country, 2021-2031
Figure 54: Middle East & Africa Industrial Water Service Market Attractiveness Analysis by Service Type, 2021-2031
Figure 55: Middle East & Africa Industrial Water Service Market Attractiveness Analysis by End User, 2021-2031
Copyright © Transparency Market Research, Inc. All Rights reserved
Trust Online

Industrial Water Service Market