
Reports
Reports
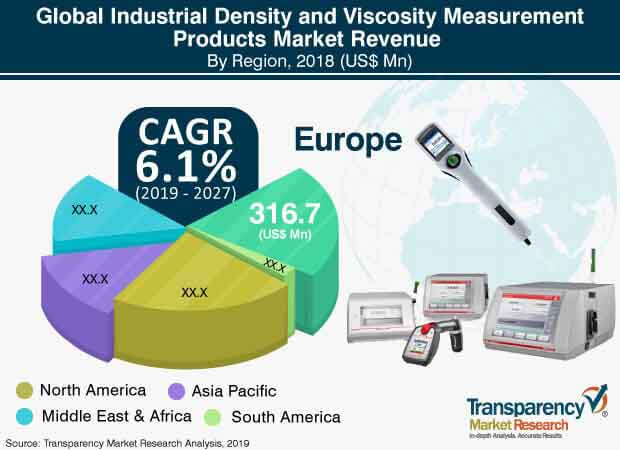
The global industrial density and viscosity measurement products market was valued at US$ 996.1 Mn in 2018 and is anticipated to expand at a stable CAGR of 6.1% during the forecast period, according to a new research report published by Transparency Market Research (TMR) titled ‘Industrial Density and Viscosity Measurement Products Market – Global Industry Analysis, Size, Share, Growth, Trends, and Forecast, 2019- 2027.’ Advantages offered by industrial density and viscosity measurement products vary from industry to industry.
Easy operations by using handheld and portable measurement devices, changing adverse and critical atmospheric conditions across industries, and rising need for automated devices in process industries are prominent factors driving the global industrial density and viscosity measurement products market. Among geographies, the market in Asia Pacific is likely to expand at the maximum CAGR of 6.9% during the forecast period.
Changing adverse and critical atmospheric conditions across industries
Changes in temperature cause adverse effects on physical and chemical properties of fluids. In the food & beverages industry, edibility of fluids is determined by using density and viscosity meters. Fluids need to be perfectly dense and viscous for them to be edible. When the temperature increases, the molecular momentum between molecules increases as their kinetic energy rises. The force of cohesion decreases with the increase in temperature as molecules move away from one another. This ultimately affects viscosity of the fluid. In the petroleum industry, under different atmospheric conditions, viscosity and density of oil are important parameters to be monitored. If the oil offers insufficient lubrication, it may lead to mechanical friction, wear, and heat. This may result in equipment failure. In order to avoid such issues, viscometers and densitometers are being increasingly used in the petroleum industry. Thus, changing adverse and critical atmospheric conditions across industries is an important factor driving the adoption of industrial density and viscosity measurement products across the world.
Emerson Electric Co., Yokogawa Electric Co., Mettler Toledo, and Toshiba Corporation likely to continue to lead the global market
The profiling of top players operating in the global industrial density and viscosity measurement products market is based of revenue generated from these products. The profiling includes these players’ headquarters, key financials, SWOT analysis, recent developments, and strategic overview. Key players operating in the global market and profiled in the report are Anton Paar GmbH, Emerson Electric Co., Brookfield (Ametek), A&D Company, Yokogawa Electric Co., Mettler Toledo, Toshiba Corporation, Berthold Technologies GmbH & Co. Kg, Hydramotion Ltd., TOKI SANGYO CO., LTD, Fungilab Inc. USA, BARTEC, proRheo GmbH, Lamy Rheology, Analytical Technology and Control Limited, Marimex, Fuji Ultrasonic Engineering Co., Ltd., Zhongwang Technology Co., LTD., KYOTO ELECTRONICS MANUFACTURING CO., LTD., Lemis Process, PAC L.P., Toshiba, and Rototherm Group.
1. Preface
1.1. Market Definition and Scope
1.2. Market Segmentation
1.3. Key Research Objectives
1.4. Research Highlights
2. Assumptions and Research Methodology
3. Executive Summary: Global Industrial Density and Viscosity Measurement Products Market
4. Market Overview
4.1. Introduction
4.2. Market Dynamics
4.2.1. Drivers
4.2.2. Restraints
4.2.3. Opportunities
4.3. Key Trends Analysis
4.4. Global Industrial Density and Viscosity Measurement Products Market Analysis and Forecast, 2017–2027
4.4.1. Market Revenue Projection (US$ Mn)
4.4.2. Market Volume Projection (Thousand Units)
4.4.3. Price Trends Analysis
4.5. Porter’s Five Forces Analysis - Global Industrial Density and Viscosity Measurement Products Market
4.6. Value Chain Analysis - Global Industrial Density and Viscosity Measurement Products Market
4.7. Sales Channel Analysis - Global Industrial Density and Viscosity Measurement Products Market
4.8. Mergers and Acquisitions
4.9. Manufacturers Market Concentration Analysis
4.10. Market Outlook
5. Global Industrial Density and Viscosity Measurement Products Market Analysis and Forecast, by Type
5.1. Overview and Definitions
5.2. Global Industrial Density and Viscosity Measurement Products Market Size (US$ Mn and Thousand Units) Forecast, by Type, 2017–2027
5.2.1. Density Meter
5.2.2. Viscosity Meter
5.3. Type Comparison Matrix
5.4. Global Industrial Density and Viscosity Measurement Products Market Attractiveness, by Type
6. Global Industrial Density and Viscosity Measurement Products Market Analysis and Forecast, by Application
6.1. Overview and Definitions
6.2. Global Industrial Density and Viscosity Measurement Products Market Size (US$ Mn and Thousand Units) Forecast, by Application, 2017–2027
6.2.1. Petroleum
6.2.2. Chemical
6.2.3. Pharmaceutical
6.2.4. Food & Beverages
6.2.5. Others
6.3. Application Comparison Matrix
6.4. Global Industrial Density and Viscosity Measurement Products Market Attractiveness, by Application
7. Global Industrial Density and Viscosity Measurement Products Market Analysis and Forecast, by Region
7.1. Key Findings
7.2. Global Industrial Density and Viscosity Measurement Products Market Size (US$ Mn and Thousand Units) Forecast, by Region, 2017–2027
7.2.1. North America
7.2.2. Europe
7.2.3. Asia Pacific
7.2.4. Middle East & Africa
7.2.5. South America
7.3. Global Industrial Density and Viscosity Measurement Products Market Attractiveness, by Region
8. North America Industrial Density and Viscosity Measurement Products Market Analysis and Forecast
8.1. Key Findings
8.2. North America Industrial Density and Viscosity Measurement Products Market Size (US$ Mn and Thousand Units) Forecast, by Type, 2017–2027
8.2.1. Density Meter
8.2.2. Viscosity Meter
8.3. North America Industrial Density and Viscosity Measurement Products Market Size (US$ Mn and Thousand Units) Forecast, by Application, 2017–2027
8.3.1. Petroleum
8.3.2. Chemical
8.3.3. Pharmaceutical
8.3.4. Food & Beverages
8.3.5. Others
8.4. North America Industrial Density and Viscosity Measurement Products Market Size (US$ Mn and Thousand Units) Forecast, by Country/Sub-region, 2017–2027
8.4.1. U.S.
8.4.2. Canada
8.4.3. Mexico
8.5. North America Industrial Density and Viscosity Measurement Products Market Attractiveness Analysis
8.5.1. by Type
8.5.2. by Application
8.5.3. by Country/Sub-region
9. Europe Industrial Density and Viscosity Measurement Products Market Analysis and Forecast
9.1. Key Findings
9.2. Europe Industrial Density and Viscosity Measurement Products Market Size (US$ Mn and Thousand Units) Forecast, by Type, 2017–2027
9.2.1. Density Meter
9.2.2. Viscosity Meter
9.3. Europe Industrial Density and Viscosity Measurement Products Market Size (US$ Mn and Thousand Units) Forecast, by Application, 2017–2027
9.3.1. Petroleum
9.3.2. Chemical
9.3.3. Pharmaceutical
9.3.4. Food & Beverages
9.3.5. Others
9.4. Europe Industrial Density and Viscosity Measurement Products Market Size (US$ Mn and Thousand Units) Forecast, by Country/Sub-region, 2017–2027
9.4.1. Germany
9.4.2. France
9.4.3. U.K.
9.4.4. Italy
9.4.5. Russia
9.4.6. Rest of Europe
9.5. Europe Industrial Density and Viscosity Measurement Products Market Attractiveness Analysis
9.5.1. by Type
9.5.2. by Application
9.5.3. by Country/Sub-region
10. Asia Pacific Industrial Density and Viscosity Measurement Products Market Analysis and Forecast
10.1. Key Findings
10.2. Asia Pacific Industrial Density and Viscosity Measurement Products Market Size (US$ Mn and Thousand Units) Forecast, by Type, 2017–2027
10.2.1. Density Meter
10.2.2. Viscosity Meter
10.3. Asia Pacific Industrial Density and Viscosity Measurement Products Market Size (US$ Mn and Thousand Units) Forecast, by Application, 2017–2027
10.3.1. Petroleum
10.3.2. Chemical
10.3.3. Pharmaceutical
10.3.4. Food & Beverages
10.3.5. Others
10.4. Asia Pacific Industrial Density and Viscosity Measurement Products Market Size (US$ Mn and Thousand Units) Forecast, by Country/Sub-region, 2017–2027
10.4.1. China
10.4.2. Japan
10.4.3. South Korea
10.4.4. India
10.4.5. Australia
10.4.6. Indonesia
10.4.7. Thailand
10.4.8. Malaysia
10.4.9. Philippines
10.4.10. Vietnam
10.4.11. Rest of Asia Pacific
10.5. Asia Pacific Industrial Density and Viscosity Measurement Products Market Attractiveness Analysis
10.5.1. by Type
10.5.2. by Application
10.5.3. by Country/Sub-region
11. Middle East & Africa (MEA) Industrial Density and Viscosity Measurement Products Market Analysis and Forecast
11.1. Key Findings
11.2. Middle East & Africa (MEA) Industrial Density and Viscosity Measurement Products Market Size (US$ Mn and Thousand Units) Forecast, by Type, 2017–2027
11.2.1. Density Meter
11.2.2. Viscosity Meter
11.3. Middle East & Africa (MEA) Industrial Density and Viscosity Measurement Products Market Size (US$ Mn and Thousand Units) Forecast, by Application, 2017–2027
11.3.1. Petroleum
11.3.2. Chemical
11.3.3. Pharmaceutical
11.3.4. Food & Beverages
11.3.5. Others
11.4. Middle East & Africa (MEA) Industrial Density and Viscosity Measurement Products Market Size (US$ Mn and Thousand Units) Forecast, by Country/Sub-region, 2017–2027
11.4.1. Turkey
11.4.2. Egypt
11.4.3. GCC
11.4.4. South Africa
11.4.5. Rest of Middle East & Africa
11.5. Middle East & Africa (MEA) Industrial Density and Viscosity Measurement Products Market Attractiveness Analysis
11.5.1. by Type
11.5.2. by Application
11.5.3. by Country/Sub-region
12. South America Industrial Density and Viscosity Measurement Products Market Analysis and Forecast
12.1. Key Findings
12.2. South America Industrial Density and Viscosity Measurement Products Market Size (US$ Mn and Thousand Units) Forecast, by Type, 2017–2027
12.2.1. Density Meter
12.2.2. Viscosity Meter
12.3. South America Industrial Density and Viscosity Measurement Products Market Size (US$ Mn and Thousand Units) Forecast, by Application, 2017–2027
12.3.1. Petroleum
12.3.2. Chemical
12.3.3. Pharmaceutical
12.3.4. Food & Beverages
12.3.5. Others
12.4. South America Industrial Density and Viscosity Measurement Products Market Size (US$ Mn and Thousand Units) Forecast, by Country/Sub-region, 2017–2027
12.4.1. Brazil
12.4.2. Rest of South America
12.5. South America Industrial Density and Viscosity Measurement Products Market Attractiveness Analysis
12.5.1. by Type
12.5.2. by Application
12.5.3. by Country/Sub-region
13. Competition Landscape
13.1. Market Players – Competition Matrix
13.2. Global Industrial Density and Viscosity Measurement Products Market Share (%), by Company (2018)
14. Company Profiles (Details – Overview, Financials, SWOT Analysis, Strategy)
14.1. Anton Paar GmbH
14.1.1. Company Details
14.1.2. Company Description
14.1.3. Business Overview
14.1.4. Financials
14.1.5. Strategic Overview
14.2. Emerson Electric Co.
14.2.1. Company Details
14.2.2. Company Description
14.2.3. Business Overview
14.2.4. Financials
14.2.5. Strategic Overview
14.3. Brookfield (Amtek)
14.3.1. Company Details
14.3.2. Company Description
14.3.3. Business Overview
14.3.4. Strategic Overview
14.4. A&D Company
14.4.1. Company Details
14.4.2. Company Description
14.4.3. Business Overview
14.4.4. Financials
14.4.5. Strategic Overview
14.5. Yokogawa Electric Co.
14.5.1. Company Details
14.5.2. Company Description
14.5.3. Business Overview
14.5.4. Financials
14.5.5. Strategic Overview
14.6. Mettler Toledo
14.6.1. Company Details
14.6.2. Company Description
14.6.3. Business Overview
14.6.4. Financials
14.6.5. Strategic Overview
14.7. Toshiba Corporation
14.7.1. Company Details
14.7.2. Company Description
14.7.3. Business Overview
14.7.4. Financials
14.7.5. Strategic Overview
14.8. Berthold Technologies GmbH & Co. Kg
14.8.1. Company Details
14.8.2. Company Description
14.8.3. Business Overview
14.8.4. Strategic Overview
14.9. Hydramotion Ltd.
14.9.1. Company Details
14.9.2. Company Description
14.9.3. Business Overview
14.9.4. Financials
14.9.5. Strategic Overview
14.10. TOKI SANGYO CO., LTD
14.10.1. Company Details
14.10.2. Company Description
14.10.3. Business Overview
14.10.4. Financials
14.10.5. Strategic Overview
14.11. Fungilab Inc. USA
14.11.1. Company Details
14.11.2. Company Description
14.11.3. Business Overview
14.11.4. Financials
14.11.5. Strategic Overview
14.12. Bartec
14.12.1. Company Details
14.12.2. Company Description
14.12.3. Business Overview
14.12.4. Financials
14.12.5. Strategic Overview
14.13. Prorheo GmbH
14.13.1. Company Details
14.13.2. Company Description
14.13.3. Business Overview
14.13.4. Financials
14.13.5. Strategic Overview
14.14. Lamy Rheology
14.14.1. Company Details
14.14.2. Company Description
14.14.3. Business Overview
14.14.4. Financials
14.14.5. Strategic Overview
14.15. Analytical Technology and Control Limited
14.15.1. Company Details
14.15.2. Company Description
14.15.3. Business Overview
14.15.4. Financials
14.15.5. Strategic Overview
14.16. Marimex
14.16.1. Company Details
14.16.2. Company Description
14.16.3. Business Overview
14.16.4. Financials
14.16.5. Strategic Overview
14.17. Fuji Ultrasonic Engineering Co., Ltd.
14.17.1. Company Details
14.17.2. Company Description
14.17.3. Business Overview
14.17.4. Financials
14.17.5. Strategic Overview
14.18. Zhongwang Technology Co., LTD.
14.18.1. Company Details
14.18.2. Company Description
14.18.3. Business Overview
14.18.4. Financials
14.18.5. Strategic Overview
14.19. KYOTO ELECTRONICS MANUFACTURING CO., LTD.
14.19.1. Company Details
14.19.2. Company Description
14.19.3. Business Overview
14.19.4. Financials
14.19.5. Strategic Overview
14.20. Lemis Process
14.20.1. Company Details
14.20.2. Company Description
14.20.3. Business Overview
14.20.4. Financials
14.20.5. Strategic Overview
14.21. PAC L.P.
14.21.1. Company Details
14.21.2. Company Description
14.21.3. Business Overview
14.21.4. Financials
14.21.5. Strategic Overview
14.22. Rototherm Group
14.22.1. Company Details
14.22.2. Company Description
14.22.3. Business Overview
14.22.4. Financials
14.22.5. Strategic Overview
15. Key Takeaways
List of Tables
Table 01: Global Industrial Density and Viscosity Measurement Products Market Revenue (US$ Mn) Forecast, by Type, 2017–2027
Table 02: Global Industrial Density and Viscosity Measurement Products Market Volume (Thousand Units) Forecast, by Type, 2017–2027
Table 03: Global Industrial Density and Viscosity Measurement Products Market Revenue (US$ Mn) Forecast, by Application, 2017–2027
Table 04: Global Industrial Density and Viscosity Measurement Products Market Volume (Thousand Units) Forecast, by Application, 2017–2027
Table 05: Global Industrial Density and Viscosity Measurement Products Market Revenue (US$ Mn) Forecast, by Region, 2016–2026
Table 06: Global Industrial Density and Viscosity Measurement Products Market Volume (Thousand Units) Forecast, by Region, 2016–2026
Table 07: North America Industrial Density and Viscosity Measurement Products Market Revenue (US$ Mn) Forecast, by Type, 2017–2027
Table 08: North America Industrial Density and Viscosity Measurement Products Market Volume (Thousand Units) Forecast, by Type, 2017–2027
Table 09: North America Industrial Density and Viscosity Measurement Products Market Revenue (US$ Mn) Forecast, by Application, 2017–2027
Table 10: North America Industrial Density and Viscosity Measurement Products Market Volume (Thousand Units) Forecast, by Application, 2017–2027
Table 11: North America Industrial Density and Viscosity Measurement Products Market Revenue (US$ Mn) Forecast, by Country/Sub-region, 2017–2027
Table 12: North America Industrial Density and Viscosity Measurement Products Market Volume (Thousand Units) Forecast, by Country/Sub-region, 2017–2027
Table 13: Europe Industrial Density and Viscosity Measurement Products Market Revenue (US$ Mn) Forecast, by Type, 2017–2027
Table 14: Europe Industrial Density and Viscosity Measurement Products Market Volume (Thousand Units) Forecast, by Type, 2017–2027
Table 15: Europe Industrial Density and Viscosity Measurement Products Market Revenue (US$ Mn) Forecast, by Application, 2017–2027
Table 16: Europe Industrial Density and Viscosity Measurement Products Market Volume (Thousand Units) Forecast, by Application, 2017–2027
Table 17: Europe Industrial Density and Viscosity Measurement Products Market Revenue (US$ Mn) Forecast, by Country/Sub-region, 2017–2027
Table 18: Europe Industrial Density and Viscosity Measurement Products Market Volume (Thousand Units) Forecast, by Country/Sub-region, 2017–2027
Table 19: Asia Pacific Industrial Density and Viscosity Measurement Products Market Revenue (US$ Mn) Forecast, by Type, 2017–2027
Table 20: Asia Pacific Industrial Density and Viscosity Measurement Products Market Volume (Thousand Units) Forecast, by Type, 2017–2027
Table 21: Asia Pacific Industrial Density and Viscosity Measurement Products Market Revenue (US$ Mn) Forecast, by Application, 2017–2027
Table 22: Asia Pacific Industrial Density and Viscosity Measurement Products Market Volume (Thousand Units) Forecast, by Application, 2017–2027
Table 23: Asia Pacific Industrial Density and Viscosity Measurement Products Market Revenue (US$ Mn) Forecast, by Country/Sub-region, 2017–2027
Table 24: Asia Pacific Industrial Density and Viscosity Measurement Products Market Volume (Thousand Units) Forecast, by Country/Sub-region, 2017–2027
Table 25: Middle East & Africa Industrial Density and Viscosity Measurement Products Market Revenue (US$ Mn) Forecast, by Type, 2017–2027
Table 26: Middle East & Africa Industrial Density and Viscosity Measurement Products Market Volume (Thousand Units) Forecast, by Type, 2017–2027
Table 27: Middle East & Africa Industrial Density and Viscosity Measurement Products Market Revenue (US$ Mn) Forecast, by Application, 2017–2027
Table 28: Middle East & Africa Industrial Density and Viscosity Measurement Products Market Volume (Thousand Units) Forecast, by Application, 2017–2027
Table 29: Middle East & Africa Industrial Density and Viscosity Measurement Products Market Revenue (US$ Mn) Forecast, by Country/Sub-region, 2017–2027
Table 30: Middle East & Africa Industrial Density and Viscosity Measurement Products Market Volume (Thousand Units) Forecast, by Country/Sub-region, 2017–2027
Table 31: South America Industrial Density and Viscosity Measurement Products Market Revenue (US$ Mn) Forecast, by Type, 2017–2027
Table 32: South America Industrial Density and Viscosity Measurement Products Market Volume (Thousand Units) Forecast, by Type, 2017–2027
Table 33: South America Industrial Density and Viscosity Measurement Products Market Revenue (US$ Mn) Forecast, by Application, 2017–2027
Table 34: South America Industrial Density and Viscosity Measurement Products Market Volume (Thousand Units) Forecast, by Application, 2017–2027
Table 35: South America Industrial Density and Viscosity Measurement Products Market Revenue (US$ Mn) Forecast, by Country/Sub-region, 2017–2027
Table 36: South America Industrial Density and Viscosity Measurement Products Market Volume (Thousand Units) Forecast, by Country/Sub-region, 2017–2027
List of Figures
Figure 01: Global Industrial Density and Viscosity Measurement Products Market Revenue Projection and Y-O-Y Growth, 2017–2027 (US$ Mn)
Figure 02: Global Industrial Density and Viscosity Measurement Products Market Volume Projection and Y-O-Y Growth, 2017–2027 (Thousand Units)
Figure 03: Price Trend Analysis, by Density (Average Price, US$)
Figure 04: Price Trend Analysis, by Viscosity Meter (Average Price, US$)
Figure 05: Value Chain Analysis
Figure 06: Global Industrial Density and Viscosity Measurement Products Market Revenue (US$ Mn)
Figure 07: Global Industrial Density and Viscosity Measurement Products Market, by Type (2019)
Figure 08: Global Industrial Density and Viscosity Measurement Products Market, by Application (2019)
Figure 09: Global Industrial Density and Viscosity Measurement Products Market Value Share Analysis, by Type, 2019 and 2027
Figure 10: Global Industrial Density and Viscosity Measurement Products Market, by Type, Density Meter
Figure 11: Global Industrial Density and Viscosity Measurement Products Market, by Type, Viscosity Meter
Figure 12: Segment Growth Matrix, 2019–2027 (%)
Figure 13: Segment Revenue Contribution, 2019–2027 (%)
Figure 14: Segment Compounded Growth Matrix (CAGR %)
Figure 15: Global Industrial Density and Viscosity Measurement Products Market Attractiveness Analysis, by Type
Figure 16: Global Industrial Density and Viscosity Measurement Products Market Value Share Analysis, by Application, 2019 and 2027
Figure 17: Global Industrial Density and Viscosity Measurement Products Market, by Application, Petroleum
Figure 18: Global Industrial Density and Viscosity Measurement Products Market, by Application, Chemical
Figure 19: Global Industrial Density and Viscosity Measurement Products Market, by Application, Pharmaceutical
Figure 20: Global Industrial Density and Viscosity Measurement Products Market, by Application, Food & Beverages
Figure 21: Global Industrial Density and Viscosity Measurement Products Market, by Application, Others
Figure 22: Segment Growth Matrix, 2019–2027 (%)
Figure 23: Segment Revenue Contribution, 2019–2027 (%)
Figure 24: Segment Compounded Growth Matrix (CAGR %)
Figure 25: Global Industrial Density and Viscosity Measurement Products Market Attractiveness Analysis, by Application
Figure 26: Global Industrial Density and Viscosity Measurement Products Market, by Region, North America
Figure 27: Global Industrial Density and Viscosity Measurement Products Market, by Region, Europe
Figure 28: Global Industrial Density and Viscosity Measurement Products Market, by Region, Asia Pacific
Figure 29: Global Industrial Density and Viscosity Measurement Products Market, by Region, Middle East & Africa
Figure 30: Global Industrial Density and Viscosity Measurement Products Market, by Region, South America
Figure 31: Global Industrial Density and Viscosity Measurement Products Market Attractiveness Analysis, by Region
Figure 32: North America Industrial Density and Viscosity Measurement Products Market Revenue (US$ Mn) Forecast, 2017–2027
Figure 33: North America Industrial Density and Viscosity Measurement Products Market Revenue Y-o-Y Growth Forecast, 2017–2027
Figure 34: North America Industrial Density and Viscosity Measurement Products Market Volume (Thousand Units) Forecast, 2017–2027
Figure 35: North America Industrial Density and Viscosity Measurement Products Market Volume Y-o-Y Growth Forecast, 2017–2027
Figure 36: North America Industrial Density and Viscosity Measurement Products Market Value Share Analysis, by Type, 2019 and 2027
Figure 37: North America Industrial Density and Viscosity Measurement Products Market Value Share Analysis, by Application, 2019 and 2027
Figure 38: North America Industrial Density and Viscosity Measurement Products Market Value Share Analysis, by Country/Sub-region, 2019 and 2027
Figure 39: North America Industrial Density and Viscosity Measurement Products Market Attractiveness Analysis, by Type
Figure 40: North America Industrial Density and Viscosity Measurement Products Market Attractiveness Analysis, by Application
Figure 41: North America Industrial Density and Viscosity Measurement Products Market Attractiveness Analysis, by Country/Sub-region
Figure 42: Europe Industrial Density and Viscosity Measurement Products Market Revenue (US$ Mn) Forecast, 2017–2027
Figure 43: Europe Industrial Density and Viscosity Measurement Products Market Revenue Y-o-Y Growth Forecast, 2017–2027
Figure 44: Europe Industrial Density and Viscosity Measurement Products Market Volume (Thousand Units) Forecast, 2017–2027
Figure 45: Europe Industrial Density and Viscosity Measurement Products Market Volume Y-o-Y Growth Forecast, 2017–2027
Figure 46: Europe Industrial Density and Viscosity Measurement Products Market Value Share Analysis, by Type, 2019 and 2027
Figure 47: Europe Industrial Density and Viscosity Measurement Products Market Value Share Analysis, Application, 2019 and 2027
Figure 48: Europe Industrial Density and Viscosity Measurement Products Market Value Share Analysis, by Country/Sub-region, 2019 and 2027
Figure 49: Europe Industrial Density and Viscosity Measurement Products Market Attractiveness Analysis, by Type
Figure 50: Europe Industrial Density and Viscosity Measurement Products Market Attractiveness Analysis, by Application
Figure 51: Europe Industrial Density and Viscosity Measurement Products Market Attractiveness Analysis, by Country/Sub-region
Figure 52: Asia Pacific Industrial Density and Viscosity Measurement Products Market Revenue (US$ Mn) Forecast, 2017–2027
Figure 53: Asia Pacific Industrial Density and Viscosity Measurement Products Market Revenue Y-o-Y Growth Forecast, 2017–2027
Figure 54: Asia Pacific Industrial Density and Viscosity Measurement Products Market Volume (Thousand Units) Forecast, 2017–2027
Figure 55: Asia Pacific Industrial Density and Viscosity Measurement Products Market Volume Y-o-Y Growth Forecast, 2017–2027
Figure 56: Asia Pacific Industrial Density and Viscosity Measurement Products Market Value Share Analysis, by Type, 2019 and 2027
Figure 57: Asia Pacific Industrial Density and Viscosity Measurement Products Market Value Share Analysis, Application, 2019 and 2027
Figure 58: Asia Pacific Industrial Density and Viscosity Measurement Products Market Value Share Analysis, by Country/Sub-region, 2019 and 2027
Figure 59: Asia Pacific Industrial Density and Viscosity Measurement Products Market Attractiveness Analysis, by Type
Figure 60: Asia Pacific Industrial Density and Viscosity Measurement Products Market Attractiveness Analysis, by Application
Figure 61: Asia Pacific Industrial Density and Viscosity Measurement Products Market Attractiveness Analysis, by Country/Sub-region
Figure 62: Middle East & Africa Industrial Density and Viscosity Measurement Products Market Revenue (US$ Mn) Forecast, 2017–2027
Figure 63: Middle East & Africa Industrial Density and Viscosity Measurement Products Market Revenue Y-o-Y Growth Forecast, 2017–2027
Figure 64: Middle East & Africa Industrial Density and Viscosity Measurement Products Market Volume (Thousand Units) Forecast, 2017–2027
Figure 65: Middle East & Africa Industrial Density and Viscosity Measurement Products Market Volume Y-o-Y Growth Forecast, 2017–2027
Figure 66: Middle East & Africa Industrial Density and Viscosity Measurement Products Market Value Share Analysis, by Type, 2019 and 2027
Figure 67: Middle East & Africa Industrial Density and Viscosity Measurement Products Market Value Share Analysis, by Application, 2019 and 2027
Figure 68: Middle East & Africa Industrial Density and Viscosity Measurement Products Market Value Share Analysis, by Country/Sub-region, 2019 and 2027
Figure 69: Middle East & Africa Industrial Density and Viscosity Measurement Products Market Attractiveness Analysis, by Type
Figure 70: Middle East & Africa Industrial Density and Viscosity Measurement Products Market Attractiveness Analysis, by Application
Figure 71: Middle East & Africa Industrial Density and Viscosity Measurement Products Market Attractiveness Analysis, by Country/Sub-region
Figure 72: South America Industrial Density and Viscosity Measurement Products Market Revenue (US$ Mn) Forecast, 2017–2027
Figure 73: South America Industrial Density and Viscosity Measurement Products Market Revenue Y-o-Y Growth Forecast, 2017–2027
Figure 74: South America Industrial Density and Viscosity Measurement Products Market Volume (Thousand Units) Forecast, 2017–2027
Figure 75: South America Industrial Density and Viscosity Measurement Products Market Volume Y-o-Y Growth Forecast, 2017–2027
Figure 76: South America Industrial Density and Viscosity Measurement Products Market Value Share Analysis, by Type, 2019 and 2027
Figure 77: South America Industrial Density and Viscosity Measurement Products Market Value Share Analysis, Application, 2019 and 2027
Figure 78: South America Industrial Density and Viscosity Measurement Products Market Value Share Analysis, by Country/Sub-region, 2019 and 2027
Figure 79: South America Industrial Density and Viscosity Measurement Products Market Attractiveness Analysis, by Type
Figure 80: South America Industrial Density and Viscosity Measurement Products Market Attractiveness Analysis, by Application
Figure 81: South America Industrial Density and Viscosity Measurement Products Market Attractiveness Analysis, by Country/Sub-region
Figure 82: Global Industrial Density and Viscosity Measurement Products Market Share Analysis, by Company
Copyright © Transparency Market Research, Inc. All Rights reserved
Trust Online

Industrial Density and Viscosity Measurement Products Market