
Reports
Reports
Analysts’ Viewpoint on Market Scenario
North America and Europe are estimated to hold a major share of the global industrial Blockchain technology market, while the market in APAC is expected to advance at a notable CAGR during the forecast period. Diverse advantages offered by blockchain technology have a positive impact on market growth.
Deployment of blockchain technology solutions for industries is expected to cross mainstream barriers, such as product differentiation and access to distribution channels, which leads to improved economic benefits. Furthermore, growing trend of digital transformation across businesses is driving the demand for blockchain in industry 4.0, blockchain in automotive industry, blockchain in energy, blockchain in supply chain, etc.
Increase in use of cloud services in payment and transaction procedures across the globe is a key factor driving the use of blockchain in the financial sector. Countries such as the U.S. and the U.K. account for a dominant share of the global market owing to the presence of well-established banking and financial insurance sectors. Furthermore, the adoption of the enterprise blockchain platform ensures data reliability and provides unquestionable protection to optimize internal workflows.
Moreover, some of the recent trends in blockchain technology are the increased popularity of (Non-fungible tokens) NFTs, development of metaverse, and blockchain-as-a-service, are expected to propel the market in the near future.
Blockchain is a technology that is used to share or deliver information, record transactions, and track assets in a business to provide immediate, completely transparent information on an immutable ledger, which can be accessed only by permission network members.
The technology is used to secure ledger of transaction; for instance: buying, selling, transferring, etc. The goal of blockchain is to enable the digital transformation to be recorded and distributed; however, it is unable to be edited. Consequently, the technology is the foundation for immutable ledgers, or the records of transactions that are untenable to delete, alter, or destroy.
Industrial blockchain technology platforms and services improve efficiency, cost-effectiveness, and reduce risks for any business organization. Blockchain technologies are used to create synergies among multiple, permissioned organizations that enable the creation of a completely higher value, business model.
The legalization of cryptocurrency encourages investors to invest more in blockchain technology. This, in turn, also encourages market players to make efforts to enhance their services in order to gain a competitive edge. Furthermore, rise in adoption of blockchain technology in various business applications such as smart contracts, digital identity, payments, exchanges, is boosting the market.
Moreover, developing applications of blockchain in the Internet of Things (IoT) adds a higher level of security to prevent data breaches in order to make IoT networks secure. This is anticipated to provide significant opportunities for key players in the market.
Application of blockchain technology in various applications such as exchanges, payments, digital identity, and smart contracts has been gaining traction for the last 3 to 4 years. Growing consumer and institutional demand for crypto is also driving the usage of blockchain solutions. Therefore, several startups have entered and are engaged in the development of blockchain technology solutions.
Large companies such as Samsung, Alphabet, Morgan Stanley, and BlackRock are investing in blockchain startups. According to Cointelegraph, Google’s parent company, Alphabet, has revealed that the company invested US$ 1.5 Bn in the blockchain sector between September 2021 and June 2022. Alphabet invested in four companies, including Dapper Labs, Fireblocks, Voltage, and Digital Currency Group (CoinDesk). Moreover, BlackRock invested US$ 1.17 Bn; Morgan Stanley invested US$ 1.11 Bn; and Samsung invested US$ 979.2 Mn between 2020 and 2021. Additionally, Samsung invested in 13 different companies, while Morgan Stanley and BlackRock invested in two or three companies, respectively.
Rapid emergence of blockchain technology has also driven investment by many venture firms in startups. Overall, more than 1,000 blockchain deals were executed in 2021, up from 662 in 2020.
Consistent rise in investments, funding, and numerous deals in blockchain startups help companies develop blockchain solutions and services, which in turn is expected to positively impact the global industrial blockchain technology market during the forecast period
Blockchain technology is maturing at a rapid pace. Numerous companies are working to upgrade their core infrastructure by adopting blockchain solutions. Currently, private blockchain is one of the popular types of blockchain technologies.
Private blockchain platforms offer highly elevated efficiency and work better than public blockchain. Furthermore, private blockchain offers full privacy, high efficiency, scalability, robust architecture, high transaction speed, etc. Moreover, it also saves resources and lowers cost.
Private blockchains are one-of-a-kind technology, specifically suited for enterprises. Examples of industries using blockchain technology solutions based on private blockchains include:
Enterprises across the globe are adopting private blockchain technologies to safeguard a company’s sensitive information and speed up the process. This factor is likely to fuel the demand for private blockchain technology in the near future.
North America is anticipated to account for a dominant share of the global industrial blockchain technology market during the forecast period owing to an increase in number of blockchain technologies being adopting by the various organizations in the region.
Adoption of blockchain in manufacturing, BFSI, and government sectors includes implementation of wallet solutions, digital identity detection, smart contracts. The market in Asia Pacific is estimated to advance at a prominent CAGR during the forecast period owing to an increase in government initiatives in promotion of the use of blockchain technology.
Rise in initiatives is primarily due to the benefits offered by blockchain-as-a-service and platforms such as high transparency, increased efficiency, and diverse offering of technology in multiple end-user industries. This is projected to boost blockchain industry applications at a rapid pace in developing economies during the forecast period.
Detailed profiles of companies offering industrial blockchain technology have been provided in the market report to evaluate their financials, key product offerings, recent developments, and strategies.
Top Industrial Blockchain Technology systems companies are expanding their product portfolio to increase their market share. Leading companies in blockchain technology market are HPE, SAP SE, Oracle Corporation, Amazon Web Services, Inc., Microsoft Corporation, IBM Corporation, Infosys, Accenture, Wipro, Huawei, EY, LeewayHertz, Ripple, Chainalysis KYT, Digital Asset Hpoldings, LLC, and BTL Group Ltd.
Each of these players has been profiled in the industrial blockchain technology market report based on parameters such as company overview, financial overview, business strategies, product portfolio, business segments, and recent developments.
|
Attribute |
Detail |
|
Market Size Value in 2021 |
US$ 3.80 Bn |
|
Market Forecast Value in 2031 |
US$ 1.3 Trn |
|
Growth Rate (CAGR) |
XX% |
|
Forecast Period |
2022–2031 |
|
Historical Data Available for |
2016–2020 |
|
Quantitative Units |
US$ Bn for Value |
|
Market Analysis |
Includes cross-segment analysis at global as well as regional level. Furthermore, the qualitative analysis includes drivers, restraints, opportunities, key trends, analysis, value chain analysis, and key trend analysis. |
|
Competition Landscape |
|
|
Format |
Electronic (PDF) + Excel |
|
Market Segmentation |
|
|
Regions Covered |
|
|
Countries Covered |
|
|
Companies Profiled |
|
|
Customization Scope |
Available upon request |
|
Pricing |
Available upon request |
The market is expected to reach US$ 1.3 Trn by 2031
IBM Corporation, Accenture Plc, Wipro, LeewayHertz, and Ripple.
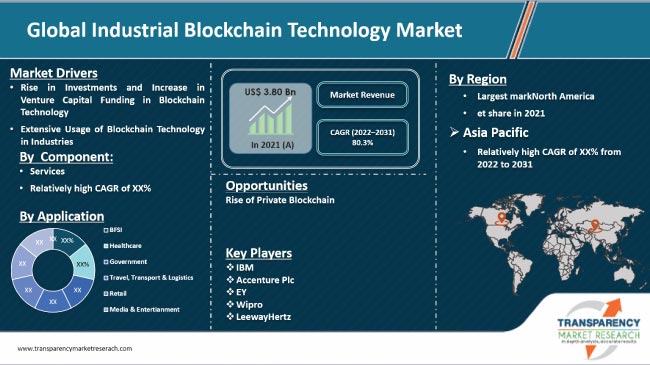
The industrial blockchain technology market is estimated to advance at a CAGR of 80.3% during the forecast period
Increasing venture capital funding in blockchain technology is one of the most important factors in market growth.
The North America is expected to account for 41.66% share of the market in 2022
Increase in acceptance of cryptocurrency as a payment method and rise in use of blockchain technology to support IoT
The industrial blockchain technology market stood at US$ 3.8 Bn in 2021.
1. Preface
1.1. Market Introduction
1.2. Market Segmentation
1.3. Key Research Objectives
2. Assumptions and Research Methodology
2.1. Research Methodology
2.1.1. List of Primary and Secondary Sources
2.2. Key Assumptions for Data Modelling
3. Executive Summary: Global Industrial Blockchain Technology Market
4. Market Overview
4.1. Market Definition
4.2. Technology/ Product Roadmap
4.3. Market Factor Analysis
4.3.1. Forecast Factors
4.3.2. Ecosystem/ Value Chain Analysis
4.3.3. Market Dynamics (Growth Influencers)
4.3.3.1. Drivers
4.3.3.2. Restraints
4.3.3.3. Opportunities
4.3.3.4. Impact Analysis of Drivers and Restraints
4.4. COVID-19 Impact Analysis
4.4.1. Impact of COVID-19 on Industrial Blockchain Technology Market
4.4.2. End-user Sentiment Analysis: Comparative Analysis on Spending
4.4.2.1. Increase in Spending
4.4.2.2. Decrease in Spending
4.4.3. Short Term and Long Term Impact on the Market
4.5. Market Opportunity Assessment – by Region (North America/ Europe/ Asia Pacific/ Middle East and Africa/ South America)
4.5.1. By Component
4.5.2. By Enterprise Size
4.5.3. By Type
4.5.4. By Application
4.5.5. By End-user
5. Global Industrial Blockchain Technology Market Analysis and Forecast
5.1. Market Revenue Analysis (US$ Bn), 2016-2031
5.1.1. Historic Growth Trends, 2016-2021
5.1.2. Forecast Trends, 2022-2031
5.2. Pricing Model Analysis/ Price Trend Analysis
6. Global Industrial Blockchain Technology Market Analysis, by Component
6.1. Overview and Definitions
6.2. Key Segment Analysis
6.3. Industrial Blockchain Technology Market Size (US$ Bn) Forecast, by Component, 2018 - 2031
6.3.1. Platform
6.3.2. Services
7. Global Industrial Blockchain Technology Market Analysis, by Enterprise Size
7.1. Overview and Definitions
7.2. Key Segment Analysis
7.3. Industrial Blockchain Technology Market Size (US$ Bn) Forecast, by Enterprise Size, 2018 - 2031
7.3.1. Large Enterprise
7.3.2. SMEs
8. Global Industrial Blockchain Technology Market Analysis, by Type
8.1. Overview and Definitions
8.2. Key Segment Analysis
8.3. Industrial Blockchain Technology Market Size (US$ Bn) Forecast, by Type, 2018 - 2031
8.3.1. Public
8.3.2. Private
8.3.3. Consortium
9. Global Industrial Blockchain Technology Market Analysis, by Application
9.1. Overview and Definitions
9.2. Key Segment Analysis
9.3. Industrial Blockchain Technology Market Size (US$ Bn) Forecast, by Application, 2018 - 2031
9.3.1. Payments
9.3.2. Smart Contracts
9.3.3. Digital Identity
9.3.4. Supply Chain Management
9.3.5. Others
10. Global Industrial Blockchain Technology Market Analysis, by End-user
10.1. Overview and Definitions
10.2. Key Segment Analysis
10.3. Industrial Blockchain Technology Market Size (US$ Bn) Forecast, by End-user, 2018 - 2031
10.3.1. BFSI
10.3.2. Healthcare
10.3.3. Government
10.3.4. Travel, Transport & Logistics
10.3.5. Retail
10.3.6. Media & Entertainment
10.3.7. Manufacturing
10.3.8. Others
11. Global Industrial Blockchain Technology Market Analysis and Forecast, by Region
11.1. Key Findings
11.2. Market Size (US$ Bn) Forecast by Region, 2018-2031
11.2.1. North America
11.2.2. Europe
11.2.3. Asia Pacific
11.2.4. Middle East & Africa
11.2.5. South America
12. North America Industrial Blockchain Technology Market Analysis and Forecast
12.1. Regional Outlook
12.2. Industrial Blockchain Technology Market Size (US$ Bn) Analysis and Forecast, 2018 - 2031
12.2.1. By Component
12.2.2. By Enterprise Size
12.2.3. By Type
12.2.4. By Application
12.2.5. By End-user
12.3. Industrial Blockchain Technology Market Size (US$ Bn) Forecast, by Country, 2018 - 2031
12.3.1. U.S.
12.3.2. Canada
12.3.3. Mexico
13. Europe Industrial Blockchain Technology Market Analysis and Forecast
13.1. Regional Outlook
13.2. Industrial Blockchain Technology Market Size (US$ Bn) Analysis and Forecast, 2018 - 2031
13.2.1. By Component
13.2.2. By Enterprise Size
13.2.3. By Type
13.2.4. By Application
13.2.5. By End-user
13.3. Industrial Blockchain Technology Market Size (US$ Bn) Forecast, by Country & Sub-region, 2018 - 2031
13.3.1. Germany
13.3.2. UK
13.3.3. France
13.3.4. Italy
13.3.5. Spain
13.3.6. Rest of Europe
14. Asia Pacific Industrial Blockchain Technology Market Analysis and Forecast
14.1. Regional Outlook
14.2. Industrial Blockchain Technology Market Size (US$ Bn) Analysis and Forecast, 2018 - 2031
14.2.1. By Component
14.2.2. By Enterprise Size
14.2.3. By Type
14.2.4. By Application
14.2.5. By End-user
14.3. Industrial Blockchain Technology Market Size (US$ Bn) Forecast, by Country & Sub-region, 2018 - 2031
14.3.1. China
14.3.2. India
14.3.3. Japan
14.3.4. ASEAN
14.3.5. Rest of Asia Pacific
15. Middle East & Africa Industrial Blockchain Technology Market Analysis and Forecast
15.1. Regional Outlook
15.2. Industrial Blockchain Technology Market Size (US$ Bn) Analysis and Forecast, 2018 - 2031
15.2.1. By Component
15.2.2. By Enterprise Size
15.2.3. By Type
15.2.4. By Application
15.2.5. By End-user
15.3. Industrial Blockchain Technology Market Size (US$ Bn) Forecast, by Country & Sub-region, 2018 - 2031
15.3.1. Saudi Arabia
15.3.2. The United Arab Emirates
15.3.3. South Africa
15.3.4. Rest of Middle East & Africa
16. South America Industrial Blockchain Technology Market Analysis and Forecast
16.1. Regional Outlook
16.2. Industrial Blockchain Technology Market Size (US$ Bn) Analysis and Forecast, 2018 - 2031
16.2.1. By Component
16.2.2. By Enterprise Size
16.2.3. By Type
16.2.4. By Application
16.2.5. By End-user
16.3. Industrial Blockchain Technology Market Size (US$ Bn) Forecast, by Country & Sub-region, 2018 - 2031
16.3.1. Brazil
16.3.2. Argentina
16.3.3. Rest of South America
17. Competition Landscape
17.1. Market Competition Matrix, by Leading Players
17.2. Market Revenue Share Analysis (%), by Leading Players (2021)
17.3. Competitive Scenario
17.3.1. List of Emerging, Prominent and Leading Players
17.3.2. Major Mergers & Acquisitions, Expansions, Partnership, Contacts, Deals, etc.
18. Company Profiles
18.1. IBM Corporation
18.1.1. Business Overview
18.1.2. Company Revenue
18.1.3. Product Portfolio
18.1.4. Geographic Footprint
18.1.5. Strategic Partnership, Merger & Acquisition, Business Expansion, New Product Launch, Innovation etc.
18.2. HPE
18.2.1. Business Overview
18.2.2. Company Revenue
18.2.3. Product Portfolio
18.2.4. Geographic Footprint
18.2.5. Strategic Partnership, Merger & Acquisition, Business Expansion, New Product Launch, Innovation etc.
18.3. SAP SE
18.3.1. Business Overview
18.3.2. Company Revenue
18.3.3. Product Portfolio
18.3.4. Geographic Footprint
18.3.5. Strategic Partnership, Merger & Acquisition, Business Expansion, New Product Launch, Innovation etc.
18.4. Oracle Corporation
18.4.1. Business Overview
18.4.2. Company Revenue
18.4.3. Product Portfolio
18.4.4. Geographic Footprint
18.4.5. Strategic Partnership, Merger & Acquisition, Business Expansion, New Product Launch, Innovation etc.
18.5. Amazon Web Services, Inc.
18.5.1. Business Overview
18.5.2. Company Revenue
18.5.3. Product Portfolio
18.5.4. Geographic Footprint
18.5.5. Strategic Partnership, Merger & Acquisition, Business Expansion, New Product Launch, Innovation etc.
18.6. Microsoft Corporation
18.6.1. Business Overview
18.6.2. Company Revenue
18.6.3. Product Portfolio
18.6.4. Geographic Footprint
18.6.5. Strategic Partnership, Merger & Acquisition, Business Expansion, New Product Launch, Innovation etc.
18.7. Infosys
18.7.1. Business Overview
18.7.2. Company Revenue
18.7.3. Product Portfolio
18.7.4. Geographic Footprint
18.7.5. Strategic Partnership, Merger & Acquisition, Business Expansion, New Product Launch, Innovation etc.
18.8. Accenture
18.8.1. Business Overview
18.8.2. Company Revenue
18.8.3. Product Portfolio
18.8.4. Geographic Footprint
18.8.5. Strategic Partnership, Merger & Acquisition, Business Expansion, New Product Launch, Innovation etc.
18.9. Wipro
18.9.1. Business Overview
18.9.2. Company Revenue
18.9.3. Product Portfolio
18.9.4. Geographic Footprint
18.9.5. Strategic Partnership, Merger & Acquisition, Business Expansion, New Product Launch, Innovation etc.
18.10. Huawei
18.10.1. Business Overview
18.10.2. Company Revenue
18.10.3. Product Portfolio
18.10.4. Geographic Footprint
18.10.5. Strategic Partnership, Merger & Acquisition, Business Expansion, New Product Launch, Innovation etc.
18.11. EY
18.11.1. Business Overview
18.11.2. Company Revenue
18.11.3. Product Portfolio
18.11.4. Geographic Footprint
18.11.5. Strategic Partnership, Merger & Acquisition, Business Expansion, New Product Launch, Innovation etc.
18.12. LeewayHertz
18.12.1. Business Overview
18.12.2. Company Revenue
18.12.3. Product Portfolio
18.12.4. Geographic Footprint
18.12.5. Strategic Partnership, Merger & Acquisition, Business Expansion, New Product Launch, Innovation etc.
18.13. Ripple
18.13.1. Business Overview
18.13.2. Company Revenue
18.13.3. Product Portfolio
18.13.4. Geographic Footprint
18.13.5. Strategic Partnership, Merger & Acquisition, Business Expansion, New Product Launch, Innovation etc.
18.14. Chainalysis KYT
18.14.1. Business Overview
18.14.2. Company Revenue
18.14.3. Product Portfolio
18.14.4. Geographic Footprint
18.14.5. Strategic Partnership, Merger & Acquisition, Business Expansion, New Product Launch, Innovation etc.
18.15. Digital Asset Holdings, LLC
18.15.1. Business Overview
18.15.2. Company Revenue
18.15.3. Product Portfolio
18.15.4. Geographic Footprint
18.15.5. Strategic Partnership, Merger & Acquisition, Business Expansion, New Product Launch, Innovation etc.
18.16. BTL Group Ltd.
18.16.1. Business Overview
18.16.2. Company Revenue
18.16.3. Product Portfolio
18.16.4. Geographic Footprint
18.16.5. Strategic Partnership, Merger & Acquisition, Business Expansion, New Product Launch, Innovation etc.
19. Key Takeaways
List of Tables
Table 1: Acronyms Used in the Industrial Blockchain Technology Market
Table 2: North America Industrial Blockchain Technology Market Revenue Analysis, by Country, 2022 - 2031 (US$ Bn)
Table 3: Europe Industrial Blockchain Technology Market Revenue Analysis, by Country & Sub-region, 2022 - 2031 (US$ Bn)
Table 4: Asia Pacific Industrial Blockchain Technology Market Revenue Analysis, by Country & Sub-region, 2022 - 2031 (US$ Bn)
Table 5: Middle East & Africa Industrial Blockchain Technology Market Revenue Analysis, by Country & Sub-region, 2021 and 2031 (US$ Bn)
Table 6: South America Industrial Blockchain Technology Market Revenue Analysis, by Country & Sub-region, 2022 - 2031 (US$ Bn)
Table 7: Forecast Factors: Relevance and Impact (1/2)
Table 8: Forecast Factors: Relevance and Impact (2/2)
Table 9: Impact Analysis of Drivers & Restraints
Table 10: Global Industrial Blockchain Technology Market Value (US$ Bn) Forecast, by Component, 2018 – 2031
Table 11: Global Industrial Blockchain Technology Market Value (US$ Bn) Forecast, by Enterprise Size, 2018 – 2031
Table 12: Global Industrial Blockchain Technology Market Value (US$ Bn) Forecast, by Type, 2018 – 2031
Table 13: Global Industrial Blockchain Technology Market Value (US$ Bn) Forecast, by Application, 2018 – 2031
Table 14: Global Industrial Blockchain Technology Market Value (US$ Bn) Forecast, by End-user, 2018 – 2031
Table 15: Global Industrial Blockchain Technology Market Volume (US$ Bn) Forecast, by Region, 2018 - 2031
Table 16: North America Industrial Blockchain Technology Market Value (US$ Bn) Forecast, by Component, 2018 – 2031
Table 17: North America Industrial Blockchain Technology Market Value (US$ Bn) Forecast, by Enterprise Size, 2018 – 2031
Table 18: North America Industrial Blockchain Technology Market Value (US$ Bn) Forecast, by Type, 2018 – 2031
Table 19: North America Industrial Blockchain Technology Market Value (US$ Bn) Forecast, by Application, 2018 – 2031
Table 20: North America Industrial Blockchain Technology Market Value (US$ Bn) Forecast, by End-user, 2018 – 2031
Table 21: North America Industrial Blockchain Technology Market Value (US$ Bn) Forecast, by Country, 2018 - 2031
Table 22: U.S. Industrial Blockchain Technology Market Revenue CAGR Breakdown (%), by Growth Term
Table 23: Canada Industrial Blockchain Technology Market Revenue CAGR Breakdown (%), by Growth Term
Table 24: Mexico Industrial Blockchain Technology Market Revenue CAGR Breakdown (%), by Growth Term
Table 25: Europe Industrial Blockchain Technology Market Value (US$ Bn) Forecast, by Component, 2018 – 2031
Table 26: Europe Industrial Blockchain Technology Market Value (US$ Bn) Forecast, by Enterprise Size, 2018 – 2031
Table 27: Europe Industrial Blockchain Technology Market Value (US$ Bn) Forecast, by Type, 2018 – 2031
Table 28: Europe Industrial Blockchain Technology Market Value (US$ Bn) Forecast, by Application, 2018 – 2031
Table 29: Europe Industrial Blockchain Technology Market Value (US$ Bn) Forecast, by End-user, 2018 – 2031
Table 30: Europe Industrial Blockchain Technology Market Value (US$ Bn) Forecast, by Country & Sub-region, 2018 - 2031
Table 31: Germany Industrial Blockchain Technology Market Revenue CAGR Breakdown (%), by Growth Term
Table 32: U.K. Industrial Blockchain Technology Market Revenue CAGR Breakdown (%), by Growth Term
Table 33: France Industrial Blockchain Technology Market Revenue CAGR Breakdown (%), by Growth Term
Table 34: Italy Industrial Blockchain Technology Market Revenue CAGR Breakdown (%), by Growth Term
Table 35: Spain Industrial Blockchain Technology Market Revenue CAGR Breakdown (%), by Growth Term
Table 36: Asia Pacific Industrial Blockchain Technology Market Value (US$ Bn) Forecast, by Component, 2018 – 2031
Table 37: Asia Pacific Industrial Blockchain Technology Market Value (US$ Bn) Forecast, by Enterprise Size, 2018 – 2031
Table 38: Asia Pacific Industrial Blockchain Technology Market Value (US$ Bn) Forecast, by Type, 2018 – 2031
Table 39: Asia Pacific Industrial Blockchain Technology Market Value (US$ Bn) Forecast, by Application, 2018 – 2031
Table 40: Asia Pacific Industrial Blockchain Technology Market Value (US$ Bn) Forecast, by End-user, 2018 – 2031
Table 41: Asia Pacific Industrial Blockchain Technology Market Value (US$ Bn) Forecast, by Country & Sub-region, 2018 - 2031
Table 42: China Industrial Blockchain Technology Market Revenue CAGR Breakdown (%), by Growth Term
Table 43: India Industrial Blockchain Technology Market Revenue CAGR Breakdown (%), by Growth Term
Table 44: Japan Industrial Blockchain Technology Market Revenue CAGR Breakdown (%), by Growth Term
Table 45: ASEAN Industrial Blockchain Technology Market Revenue CAGR Breakdown (%), by Growth Term
Table 46: Middle East & Africa Industrial Blockchain Technology Market Value (US$ Bn) Forecast, by Component, 2018 – 2031
Table 47: Middle East & Africa Industrial Blockchain Technology Market Value (US$ Bn) Forecast, by Enterprise Size, 2018 – 2031
Table 48: Middle East & Africa Industrial Blockchain Technology Market Value (US$ Bn) Forecast, by Type, 2018 – 2031
Table 49: Middle East & Africa Industrial Blockchain Technology Market Value (US$ Bn) Forecast, by Application, 2018 – 2031
Table 50: Middle East & Africa Industrial Blockchain Technology Market Value (US$ Bn) Forecast, by End-user, 2018 – 2031
Table 51: Middle East & Africa Industrial Blockchain Technology Market Value (US$ Bn) Forecast, by Country & Sub-region, 2018 - 2031
Table 52: Saudi Arabia Industrial Blockchain Technology Market Revenue CAGR Breakdown (%), by Growth Term
Table 53: United Arab Emirates Industrial Blockchain Technology Market Revenue CAGR Breakdown (%), by Growth Term
Table 54: South Africa Industrial Blockchain Technology Market Revenue CAGR Breakdown (%), by Growth Term
Table 55: South America Industrial Blockchain Technology Market Value (US$ Bn) Forecast, by Component, 2018 – 2031
Table 56: South America Industrial Blockchain Technology Market Value (US$ Bn) Forecast, by Enterprise Size, 2018 – 2031
Table 57: South America Industrial Blockchain Technology Market Value (US$ Bn) Forecast, by Type, 2018 – 2031
Table 58: South America Industrial Blockchain Technology Market Value (US$ Bn) Forecast, by Application, 2018 – 2031
Table 59: South America Industrial Blockchain Technology Market Value (US$ Bn) Forecast, by End-user, 2018 – 2031
Table 60: South America Industrial Blockchain Technology Market Value (US$ Bn) Forecast, by Country & Sub-region, 2018 - 2031
Table 61: Brazil Industrial Blockchain Technology Market Revenue CAGR Breakdown (%), by Growth Term
Table 62: Argentina Industrial Blockchain Technology Market Revenue CAGR Breakdown (%), by Growth Term
Table 63: Mergers & Acquisitions, Partnerships (1/2)
Table 64: Mergers & Acquisitions, Partnership (2/2)
List of Figures
Figure 1: Global Industrial Blockchain Technology Market Size (US$ Bn) Forecast, 2018–2031
Figure 2: Global Industrial Blockchain Technology Market Revenue (US$ Bn) Opportunity Assessment, by Region, 2022E
Figure 3: Top Segment Analysis of Industrial Blockchain Technology Market
Figure 4: Global Industrial Blockchain Technology Market Revenue (US$ Bn) Opportunity Assessment, by Region, 2031F
Figure 5: Global Industrial Blockchain Technology Market Attractiveness Assessment, by Component
Figure 6: Global Industrial Blockchain Technology Market Attractiveness Assessment, by Enterprise Size
Figure 7: Global Industrial Blockchain Technology Market Attractiveness Assessment, by Type
Figure 8: Global Industrial Blockchain Technology Market Attractiveness Assessment, by Application
Figure 9: Global Industrial Blockchain Technology Market Attractiveness Assessment, by End-user
Figure 10: Global Industrial Blockchain Technology Market Attractiveness Assessment, by Region
Figure 11: Global Industrial Blockchain Technology Market Revenue (US$ Bn) Historic Trends, 2016 – 2021
Figure 12: Global Industrial Blockchain Technology Market Revenue Opportunity (US$ Bn) Historic Trends, 2016 – 2021
Figure 13: Global Industrial Blockchain Technology Market Value Share Analysis, by Component, 2022
Figure 14: Global Industrial Blockchain Technology Market Value Share Analysis, by Component, 2031
Figure 15: Global Industrial Blockchain Technology Market Absolute Opportunity (US$ Bn), by Platform, 2022 – 2031
Figure 16: Global Industrial Blockchain Technology Market Absolute Opportunity (US$ Bn), by Services, 2022 – 2031
Figure 17: Global Industrial Blockchain Technology Market Value Share Analysis, by Enterprise Size, 2022
Figure 18: Global Industrial Blockchain Technology Market Value Share Analysis, by Enterprise Size, 2031
Figure 19: Global Industrial Blockchain Technology Market Absolute Opportunity (US$ Bn), by, 2022 – 2031
Figure 20: Global Industrial Blockchain Technology Market Absolute Opportunity (US$ Bn), by Large Enterprises, 2022 – 2031
Figure 21: Global Industrial Blockchain Technology Market Absolute Opportunity (US$ Bn), by SMEs, 2022 – 2031
Figure 22: Global Industrial Blockchain Technology Market Value Share Analysis, by Type, 2022
Figure 23: Global Industrial Blockchain Technology Market Value Share Analysis, by Type, 2031
Figure 24: Global Industrial Blockchain Technology Market Absolute Opportunity (US$ Bn), by, 2022 – 2031
Figure 25: Global Industrial Blockchain Technology Market Absolute Opportunity (US$ Bn), by Public, 2022 – 2031
Figure 26: Global Industrial Blockchain Technology Market Absolute Opportunity (US$ Bn), by Private, 2022 – 2031
Figure 27: Global Industrial Blockchain Technology Market Absolute Opportunity (US$ Bn), by Consortium, 2022 – 2031
Figure 28: Global Industrial Blockchain Technology Market Value Share Analysis, by Application, 2022
Figure 29: Global Industrial Blockchain Technology Market Value Share Analysis, by Application, 2031
Figure 30: Global Industrial Blockchain Technology Market Absolute Opportunity (US$ Bn), by, 2022 – 2031
Figure 31: Global Industrial Blockchain Technology Market Absolute Opportunity (US$ Bn), by Payments, 2022 – 2031
Figure 32: Global Industrial Blockchain Technology Market Absolute Opportunity (US$ Bn), by Smart Contracts, 2022 – 2031
Figure 33: Global Industrial Blockchain Technology Market Absolute Opportunity (US$ Bn), by Digital Identity, 2022 – 2031
Figure 34: Global Industrial Blockchain Technology Market Absolute Opportunity (US$ Bn), by Supply Chain Management, 2022 – 2031
Figure 35: Global Industrial Blockchain Technology Market Absolute Opportunity (US$ Bn), by Others, 2022 – 2031
Figure 36: Global Industrial Blockchain Technology Market Value Share Analysis, by End-user, 2022
Figure 37: Global Industrial Blockchain Technology Market Value Share Analysis, by End-user, 2031
Figure 38: Global Industrial Blockchain Technology Market Absolute Opportunity (US$ Bn), by 2022 – 2031
Figure 39: Global Industrial Blockchain Technology Market Absolute Opportunity (US$ Bn), by, BFSI 2022 – 2031
Figure 40: Global Industrial Blockchain Technology Market Absolute Opportunity (US$ Bn), by Healthcare, 2022 – 2031
Figure 41: Global Industrial Blockchain Technology Market Absolute Opportunity (US$ Bn), by Government, 2022 – 2031
Figure 42: Global Industrial Blockchain Technology Market Absolute Opportunity (US$ Bn), by Travel, Transport & Logistics, 2022 – 2031
Figure 43: Global Industrial Blockchain Technology Market Absolute Opportunity (US$ Bn), by Retail, 2022 – 2031
Figure 44: Global Industrial Blockchain Technology Market Absolute Opportunity (US$ Bn), by Manufacturing, 2022 – 2031
Figure 45: Global Industrial Blockchain Technology Market Absolute Opportunity (US$ Bn), by Others, 2022 – 2031
Figure 46: Global Industrial Blockchain Technology Market Opportunity (US$ Bn), by Region
Figure 47: Global Industrial Blockchain Technology Market Opportunity Share (%), by Region, 2022–2031
Figure 48: Global Industrial Blockchain Technology Market Size (US$ Bn), by Region, 2022 & 2031
Figure 49: Global Industrial Blockchain Technology Market Value Share Analysis, by Region, 2022
Figure 50: Global Industrial Blockchain Technology Market Value Share Analysis, by Region, 2031
Figure 51: North America Industrial Blockchain Technology Market Absolute Opportunity (US$ Bn), 2022 – 2031
Figure 52: Europe Industrial Blockchain Technology Market Absolute Opportunity (US$ Bn), 2022 – 2031
Figure 53: Asia Pacific Industrial Blockchain Technology Market Absolute Opportunity (US$ Bn), 2022 – 2031
Figure 54: Middle East & Africa Industrial Blockchain Technology Market Absolute Opportunity (US$ Bn), 2022 – 2031
Figure 55: South America Industrial Blockchain Technology Market Absolute Opportunity (US$ Bn), 2022 – 2031
Figure 56: North America Industrial Blockchain Technology Market Value Share Analysis, by Component, 2022
Figure 57: North America Industrial Blockchain Technology Market Value Share Analysis, by Component, 2031
Figure 58: North America Industrial Blockchain Technology Market Absolute Opportunity (US$ Bn), by Platform, 2022 – 2031
Figure 59: North America Industrial Blockchain Technology Market Absolute Opportunity (US$ Bn), by Services, 2022 – 2031
Figure 60: North America Industrial Blockchain Technology Market Value Share Analysis, by Enterprise Size, 2022
Figure 61: North America Industrial Blockchain Technology Market Value Share Analysis, by Enterprise Size, 2031
Figure 62: North America Industrial Blockchain Technology Market Absolute Opportunity (US$ Bn), by, 2022 – 2031
Figure 63: North America Industrial Blockchain Technology Market Absolute Opportunity (US$ Bn), by Large Enterprises, 2022 – 2031
Figure 64: North America Industrial Blockchain Technology Market Absolute Opportunity (US$ Bn), by SMEs, 2022 – 2031
Figure 65: North America Industrial Blockchain Technology Market Value Share Analysis, by Type, 2022
Figure 66: North America Industrial Blockchain Technology Market Value Share Analysis, by Type, 2031
Figure 67: North America Industrial Blockchain Technology Market Absolute Opportunity (US$ Bn), by, 2022 – 2031
Figure 68: North America Industrial Blockchain Technology Market Absolute Opportunity (US$ Bn), by Public, 2022 – 2031
Figure 69: North America Industrial Blockchain Technology Market Absolute Opportunity (US$ Bn), by Private, 2022 – 2031
Figure 70: North America Industrial Blockchain Technology Market Absolute Opportunity (US$ Bn), by Consortium, 2022 – 2031
Figure 71: North America Industrial Blockchain Technology Market Value Share Analysis, by Application, 2022
Figure 72: North America Industrial Blockchain Technology Market Value Share Analysis, by Application, 2031
Figure 73: North America Industrial Blockchain Technology Market Absolute Opportunity (US$ Bn), by, 2022 – 2031
Figure 74: North America Industrial Blockchain Technology Market Absolute Opportunity (US$ Bn), by Payments, 2022 – 2031
Figure 75: North America Industrial Blockchain Technology Market Absolute Opportunity (US$ Bn), by Smart Contracts, 2022 – 2031
Figure 76: North America Industrial Blockchain Technology Market Absolute Opportunity (US$ Bn), by Digital Identity, 2022 – 2031
Figure 77: North America Industrial Blockchain Technology Market Absolute Opportunity (US$ Bn), by Supply Chain Management, 2022 – 2031
Figure 78: North America Industrial Blockchain Technology Market Absolute Opportunity (US$ Bn), by Others, 2022 – 2031
Figure 79: North America Industrial Blockchain Technology Market Value Share Analysis, by End-user, 2022
Figure 80: North America Industrial Blockchain Technology Market Value Share Analysis, by End-user, 2031
Figure 81: North America Industrial Blockchain Technology Market Absolute Opportunity (US$ Bn), by 2022 – 2031
Figure 82: North America Industrial Blockchain Technology Market Absolute Opportunity (US$ Bn), by, BFSI 2022 – 2031
Figure 83: North America Industrial Blockchain Technology Market Absolute Opportunity (US$ Bn), by Healthcare, 2022 – 2031
Figure 84: North America Industrial Blockchain Technology Market Absolute Opportunity (US$ Bn), by Government, 2022 – 2031
Figure 85: North America Industrial Blockchain Technology Market Absolute Opportunity (US$ Bn), by Travel, Transport & Logistics, 2022 – 2031
Figure 86: North America Industrial Blockchain Technology Market Absolute Opportunity (US$ Bn), by Retail, 2022 – 2031
Figure 87: North America Industrial Blockchain Technology Market Absolute Opportunity (US$ Bn), by Manufacturing, 2022 – 2031
Figure 88: North America Industrial Blockchain Technology Market Absolute Opportunity (US$ Bn), by Others, 2022 – 2031
Figure 89: North America Industrial Blockchain Technology Market Value Share Analysis, by Country, 2022
Figure 90: North America Industrial Blockchain Technology Market Value Share Analysis, by Country, 2031
Figure 91: U.S. Industrial Blockchain Technology Market Opportunity Growth Analysis (US$ Bn) Forecast, 2022 – 2031
Figure 92: Canada Industrial Blockchain Technology Market Opportunity Growth Analysis (US$ Bn) Forecast, 2022 – 2031
Figure 93: Mexico Industrial Blockchain Technology Market Opportunity Growth Analysis (US$ Bn) Forecast, 2022 – 2031
Figure 94: Europe Industrial Blockchain Technology Market Value Share Analysis, by Component, 2022
Figure 95: Europe Industrial Blockchain Technology Market Value Share Analysis, by Component, 2031
Figure 96: Europe Industrial Blockchain Technology Market Absolute Opportunity (US$ Bn), by Platform, 2022 – 2031
Figure 97: Europe Industrial Blockchain Technology Market Absolute Opportunity (US$ Bn), by Services, 2022 – 2031
Figure 98: Europe Industrial Blockchain Technology Market Value Share Analysis, by Enterprise Size, 2022
Figure 99: Europe Industrial Blockchain Technology Market Value Share Analysis, by Enterprise Size, 2031
Figure 100: Europe Industrial Blockchain Technology Market Absolute Opportunity (US$ Bn), by, 2022 – 2031
Figure 101: Europe Industrial Blockchain Technology Market Absolute Opportunity (US$ Bn), by Large Enterprises, 2022 – 2031
Figure 102: Europe Industrial Blockchain Technology Market Absolute Opportunity (US$ Bn), by SMEs, 2022 – 2031
Figure 103: Europe Industrial Blockchain Technology Market Value Share Analysis, by Type, 2022
Figure 104: Europe Industrial Blockchain Technology Market Value Share Analysis, by Type, 2031
Figure 105: Europe Industrial Blockchain Technology Market Absolute Opportunity (US$ Bn), by, 2022 – 2031
Figure 106: Europe Industrial Blockchain Technology Market Absolute Opportunity (US$ Bn), by Public, 2022 – 2031
Figure 107: Europe Industrial Blockchain Technology Market Absolute Opportunity (US$ Bn), by Private, 2022 – 2031
Figure 108: Europe Industrial Blockchain Technology Market Absolute Opportunity (US$ Bn), by Consortium, 2022 – 2031
Figure 109: Europe Industrial Blockchain Technology Market Value Share Analysis, by Application, 2022
Figure 110: Europe Industrial Blockchain Technology Market Value Share Analysis, by Application, 2031
Figure 111: Europe Industrial Blockchain Technology Market Absolute Opportunity (US$ Bn), by, 2022 – 2031
Figure 112: Europe Industrial Blockchain Technology Market Absolute Opportunity (US$ Bn), by Payments, 2022 – 2031
Figure 113: Europe Industrial Blockchain Technology Market Absolute Opportunity (US$ Bn), by Smart Contracts, 2022 – 2031
Figure 114: Europe Industrial Blockchain Technology Market Absolute Opportunity (US$ Bn), by Digital Identity, 2022 – 2031
Figure 115: Europe Industrial Blockchain Technology Market Absolute Opportunity (US$ Bn), by Supply Chain Management, 2022 – 2031
Figure 116: Europe Industrial Blockchain Technology Market Absolute Opportunity (US$ Bn), by Others, 2022 – 2031
Figure 117: Europe Industrial Blockchain Technology Market Value Share Analysis, by End-user, 2022
Figure 118: Europe Industrial Blockchain Technology Market Value Share Analysis, by End-user, 2031
Figure 119: Europe Industrial Blockchain Technology Market Absolute Opportunity (US$ Bn), by 2022 – 2031
Figure 120: Europe Industrial Blockchain Technology Market Absolute Opportunity (US$ Bn), by, BFSI 2022 – 2031
Figure 121: Europe Industrial Blockchain Technology Market Absolute Opportunity (US$ Bn), by Healthcare, 2022 – 2031
Figure 122: Europe Industrial Blockchain Technology Market Absolute Opportunity (US$ Bn), by Government, 2022 – 2031
Figure 123: Europe Industrial Blockchain Technology Market Absolute Opportunity (US$ Bn), by Travel, Transport & Logistics, 2022 – 2031
Figure 124: Europe Industrial Blockchain Technology Market Absolute Opportunity (US$ Bn), by Retail, 2022 – 2031
Figure 125: Europe Industrial Blockchain Technology Market Absolute Opportunity (US$ Bn), by Manufacturing, 2022 – 2031
Figure 126: Europe Industrial Blockchain Technology Market Absolute Opportunity (US$ Bn), by Others, 2022 – 2031
Figure 127: Europe Industrial Blockchain Technology Market Value Share Analysis, by Country & Sub-region, 2022
Figure 128: Europe Industrial Blockchain Technology Market Value Share Analysis, by Country & Sub-region, 2031
Figure 129: Germany Industrial Blockchain Technology Market Opportunity Growth Analysis (US$ Bn) Forecast, 2022 – 2031
Figure 130: U.K. Industrial Blockchain Technology Market Opportunity Growth Analysis (US$ Bn) Forecast, 2022 – 2031
Figure 131: France Industrial Blockchain Technology Market Opportunity Growth Analysis (US$ Bn) Forecast, 2022 – 2031
Figure 132: Italy Industrial Blockchain Technology Market Opportunity Growth Analysis (US$ Bn) Forecast, 2022 – 2031
Figure 133: Spain Industrial Blockchain Technology Market Opportunity Growth Analysis (US$ Bn) Forecast, 2022 – 2031
Figure 134: Asia Pacific Industrial Blockchain Technology Market Value Share Analysis, by Component, 2022
Figure 135: Asia Pacific Industrial Blockchain Technology Market Value Share Analysis, by Component, 2031
Figure 136: Asia Pacific Industrial Blockchain Technology Market Absolute Opportunity (US$ Bn), by Platform, 2022 – 2031
Figure 137: Asia Pacific Industrial Blockchain Technology Market Absolute Opportunity (US$ Bn), by Services, 2022 – 2031
Figure 138: Asia Pacific Industrial Blockchain Technology Market Value Share Analysis, by Enterprise Size, 2022
Figure 139: Asia Pacific Industrial Blockchain Technology Market Value Share Analysis, by Enterprise Size, 2031
Figure 140: Asia Pacific Industrial Blockchain Technology Market Absolute Opportunity (US$ Bn), by, 2022 – 2031
Figure 141: Asia Pacific Industrial Blockchain Technology Market Absolute Opportunity (US$ Bn), by Large Enterprises, 2022 – 2031
Figure 142: Asia Pacific Industrial Blockchain Technology Market Absolute Opportunity (US$ Bn), by SMEs, 2022 – 2031
Figure 143: Asia Pacific Industrial Blockchain Technology Market Value Share Analysis, by Type, 2022
Figure 144: Asia Pacific Industrial Blockchain Technology Market Value Share Analysis, by Type, 2031
Figure 145: Asia Pacific Industrial Blockchain Technology Market Absolute Opportunity (US$ Bn), by, 2022 – 2031
Figure 146: Asia Pacific Industrial Blockchain Technology Market Absolute Opportunity (US$ Bn), by Public, 2022 – 2031
Figure 147: Asia Pacific Industrial Blockchain Technology Market Absolute Opportunity (US$ Bn), by Private, 2022 – 2031
Figure 148: Asia Pacific Industrial Blockchain Technology Market Absolute Opportunity (US$ Bn), by Consortium, 2022 – 2031
Figure 149: Asia Pacific Industrial Blockchain Technology Market Value Share Analysis, by Application, 2022
Figure 150: Asia Pacific Industrial Blockchain Technology Market Value Share Analysis, by Application, 2031
Figure 151: Asia Pacific Industrial Blockchain Technology Market Absolute Opportunity (US$ Bn), by, 2022 – 2031
Figure 152: Asia Pacific Industrial Blockchain Technology Market Absolute Opportunity (US$ Bn), by Payments, 2022 – 2031
Figure 153: Asia Pacific Industrial Blockchain Technology Market Absolute Opportunity (US$ Bn), by Smart Contracts, 2022 – 2031
Figure 154: Asia Pacific Industrial Blockchain Technology Market Absolute Opportunity (US$ Bn), by Digital Identity, 2022 – 2031
Figure 155: Asia Pacific Industrial Blockchain Technology Market Absolute Opportunity (US$ Bn), by Supply Chain Management, 2022 – 2031
Figure 156: Asia Pacific Industrial Blockchain Technology Market Absolute Opportunity (US$ Bn), by Others, 2022 – 2031
Figure 157: Asia Pacific Industrial Blockchain Technology Market Value Share Analysis, by End-user, 2022
Figure 158: Asia Pacific Industrial Blockchain Technology Market Value Share Analysis, by End-user, 2031
Figure 159: Asia Pacific Industrial Blockchain Technology Market Absolute Opportunity (US$ Bn), by 2022 – 2031
Figure 160: Asia Pacific Industrial Blockchain Technology Market Absolute Opportunity (US$ Bn), by, BFSI 2022 – 2031
Figure 161: Asia Pacific Industrial Blockchain Technology Market Absolute Opportunity (US$ Bn), by Healthcare, 2022 – 2031
Figure 162: Asia Pacific Industrial Blockchain Technology Market Absolute Opportunity (US$ Bn), by Government, 2022 – 2031
Figure 163: Asia Pacific Industrial Blockchain Technology Market Absolute Opportunity (US$ Bn), by Travel, Transport & Logistics, 2022 – 2031
Figure 164: Asia Pacific Industrial Blockchain Technology Market Absolute Opportunity (US$ Bn), by Retail, 2022 – 2031
Figure 165: Asia Pacific Industrial Blockchain Technology Market Absolute Opportunity (US$ Bn), by Manufacturing, 2022 – 2031
Figure 166: Asia Pacific Industrial Blockchain Technology Market Absolute Opportunity (US$ Bn), by Others, 2022 – 2031
Figure 167: Asia Pacific Industrial Blockchain Technology Market Revenue Opportunity Share, by Country & Sub-region
Figure 168: China Industrial Blockchain Technology Market Opportunity Growth Analysis (US$ Bn) Forecast, 2022 – 2031
Figure 169: India Industrial Blockchain Technology Market Opportunity Growth Analysis (US$ Bn) Forecast, 2022 – 2031
Figure 170: Japan Industrial Blockchain Technology Market Opportunity Growth Analysis (US$ Bn) Forecast, 2022 – 2031
Figure 171: ASEAN Industrial Blockchain Technology Market Opportunity Growth Analysis (US$ Bn) Forecast, 2022 – 2031
Figure 172: Middle East & Africa Industrial Blockchain Technology Market Value Share Analysis, by Component, 2022
Figure 173: Middle East & Africa Industrial Blockchain Technology Market Value Share Analysis, by Component, 2031
Figure 174: Middle East & Africa Industrial Blockchain Technology Market Absolute Opportunity (US$ Bn), by Platform, 2022 – 2031
Figure 175: Middle East & Africa Industrial Blockchain Technology Market Absolute Opportunity (US$ Bn), by Services, 2022 – 2031
Figure 176: Middle East & Africa Industrial Blockchain Technology Market Value Share Analysis, by Enterprise Size, 2022
Figure 177: Middle East & Africa Industrial Blockchain Technology Market Value Share Analysis, by Enterprise Size, 2031
Figure 178: Middle East & Africa Industrial Blockchain Technology Market Absolute Opportunity (US$ Bn), by, 2022 – 2031
Figure 179: Middle East & Africa Industrial Blockchain Technology Market Absolute Opportunity (US$ Bn), by Large Enterprises, 2022 – 2031
Figure 180: Middle East & Africa Industrial Blockchain Technology Market Absolute Opportunity (US$ Bn), by SMEs, 2022 – 2031
Figure 181: Middle East & Africa Industrial Blockchain Technology Market Value Share Analysis, by Type, 2022
Figure 182: Middle East & Africa Industrial Blockchain Technology Market Value Share Analysis, by Type, 2031
Figure 183: Middle East & Africa Industrial Blockchain Technology Market Absolute Opportunity (US$ Bn), by, 2022 – 2031
Figure 184: Middle East & Africa Industrial Blockchain Technology Market Absolute Opportunity (US$ Bn), by Public, 2022 – 2031
Figure 185: Middle East & Africa Industrial Blockchain Technology Market Absolute Opportunity (US$ Bn), by Private, 2022 – 2031
Figure 186: Middle East & Africa Industrial Blockchain Technology Market Absolute Opportunity (US$ Bn), by Consortium, 2022 – 2031
Figure 187: Middle East & Africa Industrial Blockchain Technology Market Value Share Analysis, by Application, 2022
Figure 188: Middle East & Africa Industrial Blockchain Technology Market Value Share Analysis, by Application, 2031
Figure 189: Middle East & Africa Industrial Blockchain Technology Market Absolute Opportunity (US$ Bn), by, 2022 – 2031
Figure 190: Middle East & Africa Industrial Blockchain Technology Market Absolute Opportunity (US$ Bn), by Payments, 2022 – 2031
Figure 191: Middle East & Africa Industrial Blockchain Technology Market Absolute Opportunity (US$ Bn), by Smart Contracts, 2022 – 2031
Figure 192: Middle East & Africa Industrial Blockchain Technology Market Absolute Opportunity (US$ Bn), by Digital Identity, 2022 – 2031
Figure 193: Middle East & Africa Industrial Blockchain Technology Market Absolute Opportunity (US$ Bn), by Supply Chain Management, 2022 – 2031
Figure 194: Middle East & Africa Industrial Blockchain Technology Market Absolute Opportunity (US$ Bn), by Others, 2022 – 2031
Figure 195: Middle East & Africa Industrial Blockchain Technology Market Value Share Analysis, by End-user, 2022
Figure 196: Middle East & Africa Industrial Blockchain Technology Market Value Share Analysis, by End-user, 2031
Figure 197: Middle East & Africa Industrial Blockchain Technology Market Absolute Opportunity (US$ Bn), by 2022 – 2031
Figure 198: Middle East & Africa Industrial Blockchain Technology Market Absolute Opportunity (US$ Bn), by, BFSI 2022 – 2031
Figure 199: Middle East & Africa Industrial Blockchain Technology Market Absolute Opportunity (US$ Bn), by Healthcare, 2022 – 2031
Figure 200: Middle East & Africa Industrial Blockchain Technology Market Absolute Opportunity (US$ Bn), by Government, 2022 – 2031
Figure 201: Middle East & Africa Industrial Blockchain Technology Market Absolute Opportunity (US$ Bn), by Travel, Transport & Logistics, 2022 – 2031
Figure 202: Middle East & Africa Industrial Blockchain Technology Market Absolute Opportunity (US$ Bn), by Retail, 2022 – 2031
Figure 203: Middle East & Africa Industrial Blockchain Technology Market Absolute Opportunity (US$ Bn), by Manufacturing, 2022 – 2031
Figure 204: Middle East & Africa Industrial Blockchain Technology Market Absolute Opportunity (US$ Bn), by Others, 2022 – 2031
Figure 205: Middle East & Africa Industrial Blockchain Technology Market Value Share Analysis, by Country & Sub-region, 2022
Figure 206: Middle East & Africa Industrial Blockchain Technology Market Value Share Analysis, by Country & Sub-region, 2031
Figure 207: Saudi Arabia Industrial Blockchain Technology Market Opportunity Growth Analysis (US$ Bn) Forecast, 2022 – 2031
Figure 208: United Arab Emirates Industrial Blockchain Technology Market Opportunity Growth Analysis (US$ Bn) Forecast, 2022 – 2031
Figure 209: South Africa Industrial Blockchain Technology Market Opportunity Growth Analysis (US$ Bn) Forecast, 2022 – 2031
Figure 210: South America Industrial Blockchain Technology Market Value Share Analysis, by Component, 2022
Figure 211: South America Industrial Blockchain Technology Market Value Share Analysis, by Component, 2031
Figure 212: South America Industrial Blockchain Technology Market Absolute Opportunity (US$ Bn), by Platform, 2022 – 2031
Figure 213: South America Industrial Blockchain Technology Market Absolute Opportunity (US$ Bn), by Services, 2022 – 2031
Figure 214: South America Industrial Blockchain Technology Market Value Share Analysis, by Enterprise Size, 2022
Figure 215: South America Industrial Blockchain Technology Market Value Share Analysis, by Enterprise Size, 2031
Figure 216: South America Industrial Blockchain Technology Market Absolute Opportunity (US$ Bn), by, 2022 – 2031
Figure 217: South America Industrial Blockchain Technology Market Absolute Opportunity (US$ Bn), by Large Enterprises, 2022 – 2031
Figure 218: v America Industrial Blockchain Technology Market Absolute Opportunity (US$ Bn), by SMEs, 2022 – 2031
Figure 219: South America Industrial Blockchain Technology Market Value Share Analysis, by Type, 2022
Figure 220: South America Industrial Blockchain Technology Market Value Share Analysis, by Type, 2031
Figure 221: South America Industrial Blockchain Technology Market Absolute Opportunity (US$ Bn), by, 2022 – 2031
Figure 222: South America Industrial Blockchain Technology Market Absolute Opportunity (US$ Bn), by Public, 2022 – 2031
Figure 223: South America Industrial Blockchain Technology Market Absolute Opportunity (US$ Bn), by Private, 2022 – 2031
Figure 224: South America Industrial Blockchain Technology Market Absolute Opportunity (US$ Bn), by Consortium, 2022 – 2031
Figure 225: South America Industrial Blockchain Technology Market Value Share Analysis, by Application, 2022
Figure 226: South America Industrial Blockchain Technology Market Value Share Analysis, by Application, 2031
Figure 227: South America Industrial Blockchain Technology Market Absolute Opportunity (US$ Bn), by, 2022 – 2031
Figure 228: South America Industrial Blockchain Technology Market Absolute Opportunity (US$ Bn), by Payments, 2022 – 2031
Figure 229: South America Industrial Blockchain Technology Market Absolute Opportunity (US$ Bn), by Smart Contracts, 2022 – 2031
Figure 230: South America Industrial Blockchain Technology Market Absolute Opportunity (US$ Bn), by Digital Identity, 2022 – 2031
Figure 231: South America Industrial Blockchain Technology Market Absolute Opportunity (US$ Bn), by Supply Chain Management, 2022 – 2031
Figure 232: South America Industrial Blockchain Technology Market Absolute Opportunity (US$ Bn), by Others, 2022 – 2031
Figure 233: South America Industrial Blockchain Technology Market Value Share Analysis, by End-user, 2022
Figure 234: South America Industrial Blockchain Technology Market Value Share Analysis, by End-user, 2031
Figure 235: South America Industrial Blockchain Technology Market Absolute Opportunity (US$ Bn), by 2022 – 2031
Figure 236: South America Industrial Blockchain Technology Market Absolute Opportunity (US$ Bn), by, BFSI 2022 – 2031
Figure 237: South America Industrial Blockchain Technology Market Absolute Opportunity (US$ Bn), by Healthcare, 2022 – 2031
Figure 238: South America Industrial Blockchain Technology Market Absolute Opportunity (US$ Bn), by Government, 2022 – 2031
Figure 239: South America Industrial Blockchain Technology Market Absolute Opportunity (US$ Bn), by Travel, Transport & Logistics, 2022 – 2031
Figure 240: South America Industrial Blockchain Technology Market Absolute Opportunity (US$ Bn), by Retail, 2022 – 2031
Figure 241: South America Industrial Blockchain Technology Market Absolute Opportunity (US$ Bn), by Manufacturing, 2022 – 2031
Figure 242: South America Industrial Blockchain Technology Market Absolute Opportunity (US$ Bn), by Others, 2022 – 2031
Figure 243: South America Industrial Blockchain Technology Market Value Share Analysis, by Country & Sub-region, 2022
Figure 244: South America Industrial Blockchain Technology Market Value Share Analysis, by Country & Sub-region, 2031
Figure 245: Brazil Industrial Blockchain Technology Market Opportunity Growth Analysis (US$ Bn) Forecast, 2022 – 2031
Figure 246: Argentina Industrial Blockchain Technology Market Opportunity Growth Analysis (US$ Bn) Forecast, 2022 – 2031
Copyright © Transparency Market Research, Inc. All Rights reserved
Trust Online

Industrial Blockchain Technology Market