
Reports
Reports
Full Electric Marine Propulsion Market - Snapshot
Marine propulsion refers to a system or a mechanism that is utilized in the generation of thrust to propel a boat and ship across water. The arrangement of the entire propulsion system relies on the operation type, system of transport, and size of vessel. A very common type of marine propulsion system is diesel marine propulsion system. However, almost all vessel types such as recreational vessels, defense vessels, Yachts, ferries, and tugboats, utilize hybrid systems to move. Diesel-electric marine propulsion systems are used in the marine vessels. Such wide use of the system is expected to bolster expansion of the global hybrid and full electric marine propulsion market.
In a full electric marine propulsion system, the generator is directly linked with the engine in the full electric marine propulsion system. This type of marine propulsion systems is capable of enhancing the efficiency of the vessel. In addition, it is environment friendly as it reduces the overall carbon footprint in the environment. The environment friendly factor of the system is likely to amplify the overall growth of the global hybrid and full electric marine propulsion market.
Environment Friendliness of the Product to Amplify its Demand
The International Convention on the Prevention of Pollution from Ships (MARPOL) is an international regulatory body that is assigned with the task of regulating the issue of marine pollution caused by vessels. There are six different annexes in the MARPOL and each of those annexes deal with pollutants arising out of routine operations and accidents in the oceans and seas. Annex VI particularly takes care of the air pollutants generated by ocean bound ships. This annex restricts the level of nitrogen emission level and mandates use of low sulfur-content fuel to diminish environmental pollution.
In the hybrid electric marine propulsion engines, dual fuel engines have come up as an emerging trend. These engines operate with both gaseous and liquid fuels. In comparison with diesel engines, dual fuel engines have been extremely useful in reducing carbon emissions. These engines also make an offering of the following
Furthermore, technological and commercial progress made in the marine propulsion industry is further estimated to fuel the market.
Hybrid and Full Electric Marine Propulsion Market - Snapshot
Marine propulsion is a mechanism or system used to generate thrust to move a ship or boat across water. Battery packs are used for propulsion/voyage in hybrid and full electric marine propulsion systems. In hybrid marine vessels, battery as well as alternate fuel such as diesel and LNG are utilized during propulsion of the vessel. In full electric marine vessels, 100% propulsion is made through the usage of rechargeable battery packs.
Rise in Investments in Fuel-efficient Marine Propulsion Systems
The year-on-year growth in inter-state, intra-state, and cross-border trade activities has triggered the demand for marine ships. Rise in number of marine ships for several operations inside and outside a country has boosted the demand for fuel-efficient marine propulsion systems. Increase in usage of ferries for transportation purposes in coastal waterways is driving the demand for hybrid and full electric marine propulsion system. New/converted hybrid/full electric ferries play an important role in public transport systems in many waterside cities and islands.
Shift from Conventional to Hybrid Propulsion Units
Implementation of strict regulations around the Emission Control Areas (ECA) across the globe has boosted investment in marine hybrid propulsion systems. Stringent regulations pertaining to carbon emissions and oil spillage have augmented investments in the development of fuel-efficient marine propulsion systems. Better fuel-efficient marine propulsion components such as generator and motors are being developed by companies operating in the market. Various ship operators are utilizing renewable energy (including solar energy) as storage option in hybrid propulsion systems. Stored solar energy is used during peak hours or at night in marine propulsion systems. This eliminates the round-the-clock need for conventional marine fuel. Hence, a shift toward usage of hybrid propulsion units is estimated to take place in the near future. Furthermore, governments of several countries are funding and supporting development and adoption of the latest technology in marine propulsion systems. Various ship operators are utilizing renewable energy, including solar energy, as storage option in hybrid propulsion systems.
Volatility in Prices of Crude Oil and Stringent Regulations Related to Marine Fuel Emissions to Adversely Affect Diesel-based Marine Propulsion
Diesel is the preferred fuel for marine transport. Its price is directly proportional to the price of crude oil. Volatility in prices of crude oil has resulted in a switch from diesel to other propulsion systems. The relatively low price of natural gas and LNG compared to diesel in North America and Europe has attracted investments in LNG infrastructure in these regions. This can also affect diesel-electric based hybrid marine vessels. Hybrid and full electric power based new/converted marine fleet is likely to expand at a rapid pace during the forecast period.
Developments & Innovations in Product and Technology
In November 2018, Wartsila Corporation expanded its Smart Marine portfolio with the addition of high-speed, compact engine that is ideal for hybrid installation. In December 2018, Rolls-Royce Plc. received approval in principle (AIP) for hybrid tug propulsion system. The AIP was granted following an evaluation of the world’s first hybrid tug, a unique vessel designed by Jensen Maritime and will be delivered to Baydelta Maritime LLC in February 2019. In July 2018, Cummins Inc. acquired EDI, a provider of electric and hybrid powertrains. Efficient Drivetrains, Inc. (EDI) designs and produces hybrid and fully-electric power solutions for the commercial market. In June 2018, AB Volvo Penta announced a hybrid concept for its IPS propulsion. The hybrid system includes Volvo diesels, electric motor drive, and an energy storage system (lithium batteries) that is designed to produce zero-emission propulsion. In December 2017, Caterpillar Inc. collaborated with Sanmar Shipyards in Istanbul, Turkey, to build an innovative tugboat with a hydraulic hybrid propulsion system. The company’s Cat Marine Advanced Variable Drive (AVD) is utilized for hydraulic hybrid propulsion system. In November 2017, Caterpillar Inc. announced it had entered into a contract to supply an integrated hybrid propulsion solution on two new vessels for Harbor Docking and Towing based in Houston, Texas. The two new vessels will be designed and built by Washburn & Doughty in East Boothbay, Maine, the U.S.
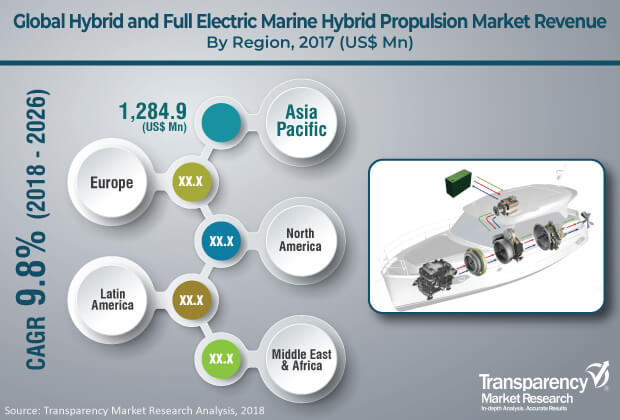
In Terms of Demand, Hybrid and Full Electric Marine Propulsion Market in Asia Pacific and Europe to Expand at Fast Pace
Currently, Europe and Asia Pacific are the key regions of the hybrid and full electric marine propulsion systems market. Highly environment-conscious Europe and North America are projected to lead the global hybrid and full electric marine propulsion market in the near future. On the other hand, the hybrid and full electric marine hybrid propulsion systems market in Asia Pacific is dominated by ASEAN. Numerous attractive technologically advanced models are expected to be introduced across the globe in the near future. The hybrid and full electric marine propulsion market is projected to witness a large number of collaborations between vessel operators and technology developers in the next few years.
Highly Competitive Market with Dominance of Top Players
The global hybrid and full electric marine propulsion market is highly competitive. Leading players dominate the market. Key players operating in the hybrid and full electric marine propulsion market are Cummins Inc., Caterpillar Inc., AB Volvo Penta, BAE Systems, Wärtsilä Corporation, Rolls Royce Plc., Niigata Power Systems Co., Ltd., Fairbanks Morse Engine, Masson-Marine S.A.S., GE, STEYR MOTORS GmbH, MAN Diesel & Turbo SE, and Torqeedo GmbH.
Hybrid and Full Electric Marine Propulsion Market is expected to reach US$7,516.7 Mn By 2026
Hybrid and Full Electric Marine Propulsion Market is estimated to rise at a CAGR of 9.8% during forecast period
Increase in usage of ferries for transportation purposes in coastal waterways is driving the demand for hybrid and full electric marine propulsion system market.
Europe and Asia Pacific is more attractive for vendors in the Hybrid and Full Electric Marine Propulsion Market
Key players of Hybrid and Full Electric Marine Propulsion Market are Cummins Inc., Caterpillar Inc., AB Volvo Penta, BAE Systems, Wärtsilä Corporation, Rolls Royce Plc., Niigata Power Systems Co., Ltd., Fairbanks Morse Engine, Masson-Marine S.A.S., GE, STEYR MOTORS GmbH, MAN Diesel & Turbo SE, and Torqeedo GmbH
1. Preface
1.1. Report Scope and Market Segmentation
1.2. Research Highlights
2. Assumptions and Research Methodology
2.1. Report Assumptions
2.2. Secondary Sources and Acronyms Used
2.3. Research Methodology
3. Executive Summary
3.1. Market Snapshot
3.2. Top Trends
4. Market Overview
4.1. Product Overview
4.2. Market Indicators
5. Market Dynamics
5.1. Drivers and Restraints Snapshot Analysis
5.1.1. Drivers
5.1.2. Restraints
5.1.3. Opportunities
5.2. Porter’s Five Forces Analysis
5.2.1. Threat of Substitutes
5.2.2. Bargaining Power of Buyers
5.2.3. Bargaining Power of Suppliers
5.2.4. Threat of New Entrants
5.2.5. Degree of Competition
5.3. Global Hybrid and Full Electric Marine Propulsion Market Analysis & Forecast, 2017–2026
5.4. Value Chain Analysis
5.5. Regulatory Scenario
6. Global Hybrid and Full Electric Marine Propulsion Market Analysis & Forecast, by Propulsion Type, 2017–2026
6.1. Introduction
6.2. Key Findings
6.3. Global Hybrid and Full Electric Marine Propulsion Market Value (US$ Mn) Share Analysis & Forecast, by Propulsion Type, 2017–2026
6.3.1. Full Electric Vessel
6.3.2. Hybrid Vessel
6.4. Global Hybrid and Full Electric Marine Propulsion Market Attractiveness Analysis, by Propulsion Type
7. Global Hybrid and Full Electric Marine Propulsion Market Analysis & Forecast, by Vessel, 2017–2026
7.1. Introduction
7.2. Key Findings
7.3. Global Hybrid and Full Electric Marine Propulsion Market Value (US$ Mn) Share Analysis & Forecast, by Vessel, 2017–2026
7.3.1. Tugboats & OSVs
7.3.2. Ferries
7.3.3. Defense Vessels
7.3.4. Yachts
7.3.5. Cruise Ships
7.3.6. Others
7.4. Global Hybrid and Full Electric Marine Propulsion Market Attractiveness Analysis, by Vessel
8. Global Hybrid and Full Electric Marine Propulsion Market Analysis and Forecast, by RPM, 2017–2026
8.1. Introduction
8.2. Key Findings
8.3. Global Hybrid and Full Electric Marine Propulsion Market Value (US$ Mn) Share Analysis & Forecast, by RPM, 2017–2026
8.3.1. 0-1,000 RPM
8.3.2. 1,001-2,500 RPM
8.3.3. Above 2500 RPM
8.4. Global Hybrid and Full Electric Marine Propulsion Market Attractiveness Analysis, by RPM
9. Global Hybrid and Full Electric Marine Propulsion Market Analysis and Forecast, by Power Rating, 2017–2026
9.1. Introduction
9.2. Key Findings
9.3. Global Hybrid and Full Electric Marine Propulsion Market Value (US$ Mn) Share Analysis & Forecast, by Power Rating, 2017–2026
9.3.1. 0-300 kW
9.3.2. 301-500 kW
9.3.3. 501-800 kW
9.4. Global Hybrid and Full Electric Marine Propulsion Market Attractiveness Analysis, by Power Rating
10. Global Hybrid and Full Electric Marine Propulsion Market Analysis, by Region, 2017–2026
10.1. Global Market Revenue and Growth Scenario, by Region, 2017
10.2. Key Findings
10.3. Global Hybrid and Full Electric Marine Propulsion Market Value (US$ Mn) Share Analysis & Forecast, by Region, 2017–2026
10.3.1. North America
10.3.2. Europe
10.3.3. Asia Pacific
10.3.4. Middle East & Africa
10.3.5. Latin America
10.4. Global Hybrid and Full Electric Marine Propulsion Market Attractiveness Analysis, by Region
11. North America Hybrid and Full Electric Marine Propulsion Market Analysis, 2017–2026
11.1. Key Findings
11.2. North America Hybrid and Full Electric Marine Propulsion Market Value (US$ Mn) Share Analysis & Forecast, by Propulsion Type
11.2.1. Full Electric Vessel
11.2.2. Hybrid Vessel
11.3. North America Hybrid and Full Electric Marine Propulsion Market Value (US$ Mn) Share Analysis & Forecast, by Vessel
11.3.1. Tugboats & OSVs
11.3.2. Ferries
11.3.3. Defense Vessels
11.3.4. Yachts
11.3.5. Cruise Ships
11.3.6. Others
11.4. North America Hybrid and Full Electric Marine Propulsion Market Value (US$ Mn) Share Analysis & Forecast, by RPM
11.4.1. 0-1,000 RPM
11.4.2. 1,001-2,500 RPM
11.4.3. Above 2500 RPM
11.5. North America Hybrid and Full Electric Marine Propulsion Market Value (US$ Mn) Share Analysis & Forecast, by Power Rating, 2017–2026
11.5.1. 0-300 kW
11.5.2. 301-500 kW
11.5.3. 501-800 kW
11.6. U.S. Hybrid and Full Electric Marine Propulsion Market Volume & Value (Units & US$ Mn) Forecast, by Propulsion Type
11.6.1. Full Electric Vessel
11.6.2. Hybrid Vessel
11.7. U.S. Hybrid and Full Electric Marine Propulsion Market Volume & Value (Units & US$ Mn) Forecast, by Vessel
11.7.1. Tugboats & OSVs
11.7.2. Ferries
11.7.3. Defense Vessels
11.7.4. Yachts
11.7.5. Cruise Ships
11.7.6. Others
11.8. U.S. Hybrid and Full Electric Marine Propulsion Market Volume & Value (Units & US$ Mn) Forecast, by RPM
11.8.1. 0-1,000 RPM
11.8.2. 1,001-2,500 RPM
11.8.3. Above 2500 RPM
11.9. U.S. Hybrid and Full Electric Marine Propulsion Market Value (US$ Mn) Share Analysis & Forecast, by Power Rating, 2017–2026
11.9.1. 0-300 kW
11.9.2. 301-500 kW
11.9.3. 501-800 kW
11.10. Canada Hybrid and Full Electric Marine Propulsion Market Volume & Value (Units & US$ Mn) Forecast, by Propulsion Type
11.10.1. Full Electric Vessel
11.10.2. Hybrid Vessel
11.11. Canada Hybrid and Full Electric Marine Propulsion Market Volume & Value (Units & US$ Mn) Forecast, by Vessel
11.11.1. Tugboats & OSVs
11.11.2. Ferries
11.11.3. Defense Vessels
11.11.4. Yachts
11.11.5. Cruise Ships
11.11.6. Others
11.12. Canada Hybrid and Full Electric Marine Propulsion Market Volume & Value (Units & US$ Mn) Forecast, by RPM
11.12.1. 0-1,000 RPM
11.12.2. 1,001-2,500 RPM
10.10.3. Above 2500 RPM
11.13. Canada Hybrid and Full Electric Marine Propulsion Market Value (US$ Mn) Share Analysis & Forecast, by Power Rating, 2017–2026
11.13.1. 0-300 kW
11.13.2. 301-500 kW
11.13.3. 501-800 kW
11.14. North America Hybrid and Full Electric Marine Propulsion Market Attractiveness Analysis
11.14.1. By Propulsion Type
11.14.2. By Vessel
11.14.3. By RPM
11.14.4. By Power Rating
11.14.5. By Country
12. Europe Hybrid and Full Electric Marine Propulsion Market Analysis, 2017–2026
12.1. Key Findings
12.2. Europe Hybrid and Full Electric Marine Propulsion Market Value (US$ Mn) Share Analysis & Forecast, by Propulsion Type
12.2.1. Full Electric Vessel
12.2.2. Hybrid Vessel
12.3. Europe Hybrid and Full Electric Marine Propulsion Market Value (US$ Mn) Share Analysis & Forecast, by Vessel
12.3.1. Tugboats & OSVs
12.3.2. Ferries
12.3.3. Defense Vessels
12.3.4. Yachts
12.3.5. Cruise Ships
12.3.6. Others
12.4. Europe Hybrid and Full Electric Marine Propulsion Market Value (US$ Mn) Share Analysis & Forecast, by RPM
12.4.1. 0-1,000 RPM
12.4.2. 1,001-2,500 RPM
12.4.3. Above 2500 RPM
12.5. Europe Hybrid and Full Electric Marine Propulsion Market Value (US$ Mn) Share Analysis & Forecast, by Power Rating, 2017–2026
12.5.1. 0-300 kW
12.5.2. 301-500 kW
12.5.3. 501-800 kW
12.5. Germany Hybrid and Full Electric Marine Propulsion Market Volume & Value (Units & US$ Mn) Forecast, by Propulsion Type
12.5.1. Full Electric Vessel
12.5.2. Hybrid Vessel
12.6. Germany Hybrid and Full Electric Marine Propulsion Market Volume & Value (Units & US$ Mn) Forecast, by Vessel
12.6.1. Tugboats & OSVs
12.6.2. Ferries
12.6.3. Defense Vessels
12.6.4. Yachts
12.6.5. Cruise Ships
12.6.6. Others
12.7. Germany Hybrid and Full Electric Marine Propulsion Market Volume & Value (Units & US$ Mn) Forecast, by RPM
12.7.1. 0-1,000 RPM
12.7.2. 1,001-2,500 RPM
12.7.3. Above 2500 RPM
12.8. Germany Hybrid and Full Electric Marine Propulsion Market Value (US$ Mn) Share Analysis & Forecast, by Power Rating, 2017–2026
12.8.1. 0-300 kW
12.8.2. 301-500 kW
12.8.3. 501-800 kW
12.9. France Hybrid and Full Electric Marine Propulsion Market Volume & Value (Units & US$ Mn) Forecast, by Propulsion Type
12.9.1. Full Electric Vessel
12.9.2. Hybrid Vessel
12.10. France Hybrid and Full Electric Marine Propulsion Market Volume & Value (Units & US$ Mn) Forecast, by Vessel
12.10.1. Tugboats & OSVs
12.10.2. Ferries
12.10.3. Defense Vessels
12.10.4. Yachts
12.10.5. Cruise Ships
12.10.6. Others
12.11. France Hybrid and Full Electric Marine Propulsion Market Volume & Value (Units & US$ Mn) Forecast, by RPM
12.11.1. 0-1,000 RPM
12.11.2. 1,001-2,500 RPM
12.11.3. Above 2500 RPM
12.12. France Hybrid and Full Electric Marine Propulsion Market Value (US$ Mn) Share Analysis & Forecast, by Power Rating, 2017–2026
12.12.1. 0-300 kW
12.12.2. 301-500 kW
12.12.3. 501-800 kW
12.13. U.K. Hybrid and Full Electric Marine Propulsion Market Volume & Value (Units & US$ Mn) Forecast, by Propulsion Type
12.13.1. Full Electric Vessel
12.13.2. Hybrid Vessel
12.14. U.K. Hybrid and Full Electric Marine Propulsion Market Volume & Value (Units & US$ Mn) Forecast, by Vessel
12.14.1. Tugboats & OSVs
12.14.2. Ferries
12.14.3. Defense Vessels
12.14.4. Yachts
12.14.5. Cruise Ships
12.14.6. Others
12.15. U.K. Hybrid and Full Electric Marine Propulsion Market Volume & Value (Units & US$ Mn) Forecast, by RPM
12.15.1. 0-1,000 RPM
12.15.2. 1,001-2,500 RPM
12.15.3. Above 2500 RPM
12.16. U.K. Hybrid and Full Electric Marine Propulsion Market Value (US$ Mn) Share Analysis & Forecast, by Power Rating, 2017–2026
12.16.1. 0-300 kW
12.16.2. 301-500 kW
12.16.3. 501-800 kW
12.17. Spain Hybrid and Full Electric Marine Propulsion Market Volume & Value (Units & US$ Mn) Forecast, by Propulsion Type
12.17.1. Full Electric Vessel
12.17.2. Hybrid Vessel
12.18. Spain Hybrid and Full Electric Marine Propulsion Market Volume & Value (Units & US$ Mn) Forecast, by Vessel
12.18.1. Tugboats & OSVs
12.18.2. Ferries
12.18.3. Defense Vessels
12.18.4. Yachts
12.18.5. Cruise Ships
12.18.6. Others
12.19. Spain Hybrid and Full Electric Marine Propulsion Market Volume & Value (Units & US$ Mn) Forecast, by RPM
12.19.1. 0-1,000 RPM
12.19.2. 1,001-2,500 RPM
12.19.3. Above 2500 RPM
12.20. Spain Hybrid and Full Electric Marine Propulsion Market Value (US$ Mn) Share Analysis & Forecast, by Power Rating, 2017–2026
12.20.1. 0-300 kW
12.20.2. 301-500 kW
12.20.3. 501-800 kW
12.21. Italy Hybrid and Full Electric Marine Propulsion Market Volume & Value (Units & US$ Mn) Forecast, by Propulsion Type
12.21.1. Full Electric Vessel
12.21.2. Hybrid Vessel
12.22. Italy Hybrid and Full Electric Marine Propulsion Market Volume & Value (Units & US$ Mn) Forecast, by Vessel
12.22.1. Tugboats & OSVs
12.22.2. Ferries
12.22.3. Defense Vessels
12.22.4. Yachts
12.22.5. Cruise Ships
12.22.6. Others
12.23. Italy Hybrid and Full Electric Marine Propulsion Market Volume & Value (Units & US$ Mn) Forecast, by RPM
12.23.1. 0-1,000 RPM
12.23.2. 1,001-2,500 RPM
12.23.3. Above 2500 RPM
12.24. Italy Hybrid and Full Electric Marine Propulsion Market Value (US$ Mn) Share Analysis & Forecast, by Power Rating, 2017–2026
12.24.1. 0-300 kW
12.24.2. 301-500 kW
12.24.3. 501-800 kW
12.25. Rest of Europe Hybrid and Full Electric Marine Propulsion Market Volume & Value (Units & US$ Mn) Forecast, by Propulsion Type
12.25.1. Full Electric Vessel
12.25.2. Hybrid Vessel
12.26. Rest of Europe Hybrid and Full Electric Marine Propulsion Market Volume & Value (Units & US$ Mn) Forecast, by Vessel
12.26.1. Tugboats & OSVs
12.26.2. Ferries
12.26.3. Defense Vessels
12.26.4. Yachts
12.26.5. Cruise Ships
12.26.6. Others
12.27. Rest of Europe Hybrid and Full Electric Marine Propulsion Market Volume & Value (Units & US$ Mn) Forecast, by RPM
12.27.1. 0-1,000 RPM
12.27.2. 1,001-2,500 RPM
12.27.3. Above 2500 RPM
12.28. Rest of Europe Hybrid and Full Electric Marine Propulsion Market Value (US$ Mn) Share Analysis & Forecast, by Power Rating, 2017–2026
12.28.1. 0-300 kW
12.28.2. 301-500 kW
12.28.3. 501-800 kW
12.29. Europe Hybrid and Full Electric Marine Propulsion Market Attractiveness Analysis
12.29.1. By Propulsion Type
12.29.2. By Vessel
12.29.3. By RPM
12.29.4. By Power Rating
12.29.5. By Country and Sub-region
13. Asia Pacific Hybrid and Full Electric Marine Propulsion Market Analysis, 2017–2026
13.1. Key Findings
13.2. Asia Pacific Hybrid and Full Electric Marine Propulsion Market Value (US$ Mn) Share Analysis & Forecast, by Propulsion Type
13.2.1. Full Electric Vessel
13.2.2. Hybrid Vessel
13.3. Asia Pacific Hybrid and Full Electric Marine Propulsion Market Value (US$ Mn) Share Analysis & Forecast, by Vessel
13.3.1. Tugboats & OSVs
13.3.2. Ferries
13.3.3. Defense Vessels
13.3.4. Yachts
13.3.5. Cruise Ships
13.3.6. Others
13.4. Asia Pacific Hybrid and Full Electric Marine Propulsion Market Value (US$ Mn) Share Analysis & Forecast, by RPM
13.4.1. 0-1,000 RPM
13.4.2. 1,001-2,500 RPM
13.4.4. Above 2500 RPM
13.5. Asia Pacific Hybrid and Full Electric Marine Propulsion Market Value (US$ Mn) Share Analysis & Forecast, by Power Rating, 2017–2026
13.5.1. 0-300 kW
13.5.2. 301-500 kW
13.5.3. 501-800 kW
13.6. Japan Hybrid and Full Electric Marine Propulsion Market Volume & Value (Units & US$ Mn) Forecast, by Propulsion Type
13.6.1. Full Electric Vessel
13.6.2. Hybrid Vessel
13.7. Japan Hybrid and Full Electric Marine Propulsion Market Volume & Value (Units & US$ Mn) Forecast, by Vessel
13.7.1. Tugboats & OSVs
13.7.2. Ferries
13.7.3. Defense Vessels
13.7.4. Yachts
13.7.5. Cruise Ships
13.7.6. Others
13.8. Japan Hybrid and Full Electric Marine Propulsion Market Volume & Value (Units & US$ Mn) Forecast, by RPM
13.8.1. 0-1,000 RPM
13.8.2. 1,001-2,500 RPM
13.8.3. Above 2500 RPM
13.9. Japan Hybrid and Full Electric Marine Propulsion Market Value (US$ Mn) Share Analysis & Forecast, by Power Rating, 2017–2026
13.9.1. 0-300 kW
13.9.2. 301-500 kW
13.9.3. 501-800 kW
13.10 China Hybrid and Full Electric Marine Propulsion Market Volume & Value (Units & US$ Mn) Forecast, by Propulsion Type
13.10.1. Full Electric Vessel
13.10.2. Hybrid Vessel
13.11. China Hybrid and Full Electric Marine Propulsion Market Volume & Value (Units & US$ Mn) Forecast, by Vessel
13.11.1. Tugboats & OSVs
13.11.2. Ferries
13.11.3. Defense Vessels
13.11.4. Yachts
13.11.5. Cruise Ships
13.11.6. Others
13.12. China Hybrid and Full Electric Marine Propulsion Market Volume & Value (Units & US$ Mn) Forecast, by RPM
13.12.1. 0-1,000 RPM
13.12.2. 1,001-2,500 RPM
13.12.3. Above 2500 RPM
13.13. China Hybrid and Full Electric Marine Propulsion Market Value (US$ Mn) Share Analysis & Forecast, by Power Rating, 2017–2026
13.13.1. 0-300 kW
13.13.2. 301-500 kW
13.13.3. 501-800 kW
13.14. India Hybrid and Full Electric Marine Propulsion Market Volume & Value (Units & US$ Mn) Forecast, by Propulsion Type
13.14.1. Full Electric Vessel
13.14.2. Hybrid Vessel
13.15. India Hybrid and Full Electric Marine Propulsion Market Volume & Value (Units & US$ Mn) Forecast, by Vessel
13.15.1. Tugboats & OSVs
13.15.2. Ferries
13.15.3. Defense Vessels
13.15.4. Yachts
13.15.5. Cruise Ships
13.15.6. Others
13.16. India Hybrid and Full Electric Marine Propulsion Market Volume & Value (Units & US$ Mn) Forecast, by RPM
13.16.1. 0-1,000 RPM
13.16.2. 1,001-2,500 RPM
13.16.3. Above 2500 RPM
13.17. India Hybrid and Full Electric Marine Propulsion Market Value (US$ Mn) Share Analysis & Forecast, by Power Rating, 2017–2026
13.17.1. 0-300 kW
13.17.2. 301-500 kW
13.17.3. 501-800 kW
13.18. ASEAN Hybrid and Full Electric Marine Propulsion Market Volume & Value (Units & US$ Mn) Forecast, by Propulsion Type
13.18.1. Full Electric Vessel
13.18.2. Hybrid Vessel
13.19. ASEAN Hybrid and Full Electric Marine Propulsion Market Volume & Value (Units & US$ Mn) Forecast, by Vessel
13.19.1. Tugboats & OSVs
13.19.2. Ferries
13.19.3. Defense Vessels
13.19.4. Yachts
13.19.5. Cruise Ships
13.19.6. Others
13.20. ASEAN Hybrid and Full Electric Marine Propulsion Market Volume & Value (Units & US$ Mn) Forecast, by RPM
13.20.1. 0-1,000 RPM
13.20.2. 1,001-2,500 RPM
13.20.3. Above 2500 RPM
13.21. ASEAN Hybrid and Full Electric Marine Propulsion Market Value (US$ Mn) Share Analysis & Forecast, by Power Rating, 2017–2026
13.21.1. 0-300 kW
13.21.2. 301-500 kW
13.21.3. 501-800 kW
13.22. Rest of Asia Pacific Hybrid and Full Electric Marine Propulsion Market Volume & Value (Units & US$ Mn) Forecast, by Propulsion Type
13.22.1. Full Electric Vessel
13.22.2. Hybrid Vessel
13.23. Rest of Asia Pacific Hybrid and Full Electric Marine Propulsion Market Volume & Value (Units & US$ Mn) Forecast, by Vessel
13.23.1. Tugboats & OSVs
13.23.2. Ferries
13.23.3. Defense Vessels
13.23.4. Yachts
13.23.5. Cruise Ships
13.23.6. Others
13.24. Rest of Asia Pacific Hybrid and Full Electric Marine Propulsion Market Volume & Value (Units & US$ Mn) Forecast, by RPM
13.24.1. 0-1,000 RPM
13.24.2. 1,001-2,500 RPM
13.24.3. Above 2500 RPM
13.25. Rest of Asia Pacific Hybrid and Full Electric Marine Propulsion Market Value (US$ Mn) Share Analysis & Forecast, by Power Rating, 2017–2026
13.25.1. 0-300 kW
13.25.2. 301-500 kW
13.25.3. 501-800 kW
13.26. Asia Pacific Hybrid and Full Electric Marine Propulsion Market Attractiveness Analysis
13.26.1. By Propulsion Type
13.26.2. By Vessel
13.26.3. By RPM
13.26.4. By Power Rating
13.26.5. By Country and Sub-region
14. Middle East & Africa Hybrid and Full Electric Marine Propulsion Market Analysis, 2017–2026
14.1. Key Findings
14.2. Middle East & Africa Hybrid and Full Electric Marine Propulsion Market Value (US$ Mn) Share Analysis & Forecast, by Propulsion Type
14.2.1. Full Electric Vessel
14.2.2. Hybrid Vessel
14.3. Middle East & Africa Hybrid and Full Electric Marine Propulsion Market Value (US$ Mn) Share Analysis & Forecast, by Vessel
14.3.1. Tugboats & OSVs
14.3.2. Ferries
14.3.3. Defense Vessels
14.3.4. Yachts
14.3.5. Cruise Ships
14.3.6. Others
14.4. Middle East & Africa Hybrid and Full Electric Marine Propulsion Market Value (US$ Mn) Share Analysis & Forecast, by RPM
14.4.1. 0-1,000 RPM
14.4.2. 1,001-2,500 RPM
14.4.3. Above 2500 RPM
14.5. Middle East & Africa Hybrid and Full Electric Marine Propulsion Market Value (US$ Mn) Share Analysis & Forecast, by Power Rating, 2017–2026
14.5.1. 0-300 kW
14.5.2. 301-500 kW
14.5.3. 501-800 kW
14.6. GCC Hybrid and Full Electric Marine Propulsion Market Volume & Value (Units & US$ Mn) Forecast, by Propulsion Type
14.6.1. Full Electric Vessel
14.6.2. Hybrid Vessel
14.7. GCC Hybrid and Full Electric Marine Propulsion Market Volume & Value (Units & US$ Mn) Forecast, by Vessel
14.7.1. Tugboats & OSVs
14.7.2. Ferries
14.7.3. Defense Vessels
14.7.4. Yachts
14.7.5. Cruise Ships
14.7.6. Others
14.8. GCC Hybrid and Full Electric Marine Propulsion Market Volume & Value (Units & US$ Mn) Forecast, by RPM
14.8.1. 0-1,000 RPM
14.8.2. 1,001-2,500 RPM
14.8.3. Above 2500 RPM
14.9. GCC Hybrid and Full Electric Marine Propulsion Market Value (US$ Mn) Share Analysis & Forecast, by Power Rating, 2017–2026
14.9.1. 0-300 kW
14.9.2. 301-500 kW
14.9.3. 501-800 kW
14.10. South Africa Hybrid and Full Electric Marine Propulsion Market Volume & Value (Units & US$ Mn) Forecast, by Propulsion Type
14.10.1. Full Electric Vessel
14.10.2. Hybrid Vessel
14.11. South Africa Hybrid and Full Electric Marine Propulsion Market Volume & Value (Units & US$ Mn) Forecast, by Vessel
14.11.1. Tugboats & OSVs
14.11.2. Ferries
14.11.3. Defense Vessels
14.11.4. Yachts
14.11.5. Cruise Ships
14.11.6. Others
14.12. South Africa Hybrid and Full Electric Marine Propulsion Market Volume & Value (Units & US$ Mn) Forecast, by RPM
14.12.1. 0-1,000 RPM
14.12.2. 1,001-2,500 RPM
14.12.3. Above 2500 RPM
14.13. South Africa Hybrid and Full Electric Marine Propulsion Market Value (US$ Mn) Share Analysis & Forecast, by Power Rating, 2017–2026
14.13.1. 0-300 kW
14.13.2. 301-500 kW
14.13.3. 501-800 kW
14.14. Rest of Middle East & Africa Hybrid and Full Electric Marine Propulsion Market Volume & Value (Units & US$ Mn) Forecast, by Propulsion Type
14.14.1. Full Electric Vessel
14.14.2. Hybrid Vessel
14.15. Rest of Middle East & Africa Hybrid and Full Electric Marine Propulsion Market Volume & Value (Units & US$ Mn) Forecast, by Vessel
14.15.1. Tugboats & OSVs
14.15.2. Ferries
14.15.3. Defense Vessels
14.15.4. Yachts
14.15.5. Cruise Ships
14.15.6. Others
14.16. Rest of Middle East & Africa Hybrid and Full Electric Marine Propulsion Market Volume & Value (Units & US$ Mn) Forecast, by RPM
14.16.1. 0-1,000 RPM
14.16.2. 1,001-2,500 RPM
14.16.3. Above 2500 RPM
14.17. Rest of Middle East & Africa Hybrid and Full Electric Marine Propulsion Market Value (US$ Mn) Share Analysis & Forecast, by Power Rating, 2017–2026
14.17.1. 0-300 kW
14.17.2. 301-500 kW
14.17.3. 501-800 kW
14.18. Middle East & Africa Hybrid and Full Electric Marine Propulsion Market Attractiveness Analysis
14.18.1. By Propulsion Type
14.18.2. By Vessel
14.18.3. By RPM
14.18.4 By Power Rating
14.18.5. By Country and Sub-region
15. Latin America Hybrid and Full Electric Marine Propulsion Market Analysis, 2017–2026
15.1. Key Findings
15.2. Latin America Hybrid and Full Electric Marine Propulsion Market Value (US$ Mn) Share Analysis & Forecast, by Propulsion Type
15.2.1. Full Electric Vessel
15.2.2. Hybrid Vessel
15.3. Latin America Hybrid and Full Electric Marine Propulsion Market Value (US$ Mn) Share Analysis & Forecast, by Vessel
15.3.1. Tugboats & OSVs
15.3.2. Ferries
15.3.3. Defense Vessels
15.3.4. Yachts
15.3.5. Cruise Ships
15.3.6. Others
15.4. Latin America Hybrid and Full Electric Marine Propulsion Market Value (US$ Mn) Share Analysis & Forecast, by RPM
15.4.1. 0-1,000 RPM
15.4.2. 1,001-2,500 RPM
15.4.3. Above 2500 RPM
15.5. Latin America Hybrid and Full Electric Marine Propulsion Market Value (US$ Mn) Share Analysis & Forecast, by Power Rating, 2017–2026
15.5.1. 0-300 kW
15.5.2. 301-500 kW
15.5.3. 501-800 kW
15.6. Brazil Hybrid and Full Electric Marine Propulsion Market Volume & Value (Units & US$ Mn) Forecast, by Propulsion Type
15.6.1. Full Electric Vessel
15.6.2. Hybrid Vessel
15.7. Brazil Hybrid and Full Electric Marine Propulsion Market Volume & Value (Units & US$ Mn) Forecast, by Vessel
15.7.1. Tugboats & OSVs
15.7.2. Ferries
15.7.3. Defense Vessels
15.7.4. Yachts
15.7.5. Cruise Ships
15.7.6. Others
15.8. Brazil Hybrid and Full Electric Marine Propulsion Market Volume & Value (Units & US$ Mn) Forecast, by RPM
15.8.1. 0-1,000 RPM
15.8.2. 1,001-2,500 RPM
15.8.3. Above 2500 RPM
15.9. Brazil Hybrid and Full Electric Marine Propulsion Market Value (US$ Mn) Share Analysis & Forecast, by Power Rating, 2017–2026
15.9.1. 0-300 kW
15.9.2. 301-500 kW
15.9.3. 501-800 kW
15.10. Mexico Hybrid and Full Electric Marine Propulsion Market Volume & Value (Units & US$ Mn) Forecast, by Propulsion Type
15.10.1. Full Electric Vessel
15.10.2. Hybrid Vessel
15.11. Mexico Hybrid and Full Electric Marine Propulsion Market Volume & Value (Units & US$ Mn) Forecast, by Vessel
15.11.1. Tugboats & OSVs
15.11.2. Ferries
15.11.3. Defense Vessels
15.11.4. Yachts
15.11.5. Cruise Ships
15.11.6. Others
15.12. Mexico Hybrid and Full Electric Marine Propulsion Market Volume & Value (Units & US$ Mn) Forecast, by RPM
15.12.1. 0-1,000 RPM
15.12.2. 1,001-2,500 RPM
15.12.3. Above 2500 RPM
15.13. Mexico Hybrid and Full Electric Marine Propulsion Market Value (US$ Mn) Share Analysis & Forecast, by Power Rating, 2017–2026
15.13.1. 0-300 kW
15.13.2. 301-500 kW
15.13.3. 501-800 kW
15.14. Rest of Latin America Hybrid and Full Electric Marine Propulsion Market Volume & Value (Units & US$ Mn) Forecast, by Propulsion Type
15.14.1. Full Electric Vessel
15.14.2. Hybrid Vessel
15.15. Rest of Latin America Hybrid and Full Electric Marine Propulsion Market Volume & Value (Units & US$ Mn) Forecast, by Vessel
15.15.1. Tugboats & OSVs
15.15.2. Ferries
15.15.3. Defense Vessels
15.15.4. Yachts
15.15.5. Cruise Ships
15.15.6. Others
15.16. Rest of Latin America Hybrid and Full Electric Marine Propulsion Market Volume & Value (Units & US$ Mn) Forecast, by RPM
15.16.1. 0-1,000 RPM
15.16.2. 1,001-2,500 RPM
15.16.3. Above 2500 RPM
15.17. Rest of Latin America Hybrid and Full Electric Marine Propulsion Market Value (US$ Mn) Share Analysis & Forecast, by Power Rating, 2017–2026
15.17.1. 0-300 kW
15.17.2. 301-500 kW
15.17.3. 501-800 kW
15.18. Latin America Hybrid and Full Electric Marine Propulsion Market Attractiveness Analysis
15.18.1. By Propulsion Type
15.18.2. By Vessel
15.18.3. By RPM
15.18.4. By Power Rating
15.18.5. By Country and Sub-region
16. Company Landscape
16.1. Global Hybrid and Full Electric Marine Propulsion Market Share Analysis, by Company (2017)
16.2. Competition Matrix
16.3. Market Footprint Analysis, 2017
16.4. Competitive Business Strategy
16.5. Company Profiles
16.5.1.Cummins Inc.
16.5.1.1. Headquarters, Year of Establishment, Revenue, Key Management, Number of Employees
16.5.1.2. Business Overview
16.5.1.3. Financial Overview
16.5.1.4. Strategic Overview
16.5.2. AB Volvo Penta
16.5.2.1. Headquarters, Year of Establishment, Revenue, Key Management, Number of Employees
16.5.2.2. Business Overview
16.5.2.3. Financial Overview
16.5.2.4. Strategic Overview
16.5.3. Niigata Power Systems Co., Ltd.
16.5.3.1. Headquarters, Year of Establishment, Revenue, Key Management, Number of Employees
16.5.3.2. Business Overview
16.5.4. Fairbanks Morse Engine
16.5.4.1. Company Description
16.5.4.2. Business Overview
16.5.4.3. Financial Overview
16.5.4.4. Strategic Overview
16.5.5. Masson-Marine S.A.S
16.5.5.1. Headquarters, Year of Establishment, Revenue, Key Management, Number of Employees
16.5.5.2. Business Overview
16.5.6. Caterpillar Inc.
16.5.6.1. Headquarters, Year of Establishment, Revenue, Key Management, Number of Employees
16.5.6.2. Business Overview
16.5.6.3. Financial Overview
16.5.6.4. Strategic Overview
16.5.7. BAE Systems
16.5.7.1. Headquarters, Year of Establishment, Revenue, Key Management, Number of Employees
16.5.7.2. Business Overview
16.5.8. Wärtsilä Corporation
16.5.8.1. Headquarters, Year of Establishment, Revenue, Key Management, Number of Employees
16.5.8.2. Business Overview
16.5.8.3. Financial Overview
16.5.8.4. Strategic Overview
16.5.9. Rolls Royce Plc.
16.5.9.1. Headquarters, Year of Establishment, Revenue, Key Management, Number of Employees
16.5.9.2. Business Overview
16.5.9.3. Financial Overview
16.5.4.4. Strategic Overview
16.5.10. GE
16.5.10.1. Headquarters, Year of Establishment, Revenue, Key Management, Number of Employees
16.5.10.2. Business Overview
16.5.10.3. Financial Overview
16.5.10.4. Strategic Overview
16.5.11. STEYR MOTORS GmbH
16.5.11.1. Headquarters, Year of Establishment, Revenue, Key Management, Number of Employees
16.5.11.2. Business Overview
16.5.11.3. Financial Overview
16.5.11.4. Strategic Overview
16.5.12. MAN Diesel & Turbo SE
16.5.12.1. Headquarters, Year of Establishment, Revenue, Key Management, Number of Employees
16.5.12.2. Business Overview
16.5.13. Torqeedo GmbH
16.5.13.1. Headquarters, Year of Establishment, Revenue, Key Management, Number of Employees
16.5.13.2. Business Overview
17. Primary Research – Key Insights
List of Tables
Table No. 1. List of Customers – Marine Propulsion Engines (1/7)
Table No. 2. List of Suppliers - Marine Propulsion Engines (1/6)
Table 10: Global Hybrid and Full Electric Marine Propulsion Market Value (US$ Mn) Forecast, by Propulsion Type, 2017-2026
Table 11: Global Hybrid and Full Electric Marine Propulsion Market Volume (Units) Forecast, by Propulsion Type, 2017-2026
Table 03: Global Hybrid and Full Electric Marine Propulsion Market Value (US$ Mn) and Volume (Units) Forecast, by Vessel, 2017-2026
Table 04: Global Hybrid and Full Electric Marine Propulsion Market Value (US$ Mn) and Volume (Units) Forecast, by Power Rating, 2017-2026
Table 05: Global Hybrid and Full Electric Marine Propulsion Market Value (US$ Mn) and Volume (Units) Forecast, by RPM, 2017-2026
Table 06: Global Hybrid and Full Electric Marine Propulsion Market Value (US$ Mn) Forecast, by Region, 2017–2026
Table 07: Global Full-electric Marine Propulsion Market, Number of Vessels (Units) Forecast, by Region, 2017–2026
Table 08: List of Full-electric Marine Vessel, 2017
Table 09: North America Hybrid and Full Electric Marine Hybrid Propulsion Market Value (US$ Mn) and Volume (Units) Forecast, by Vessel, 2017-2026
Table 10: North America Hybrid and Full Electric Marine Propulsion Market Value (US$ Mn) and Volume (Units) Forecast, by Power Rating, 2017-2026
Table 11: North America Hybrid and Full Electric Marine Propulsion Market Value (US$ Mn) and Volume (Units) Forecast, by RPM, 2017-2026
Table 12: North America Hybrid and Full Electric Marine Propulsion Market Value (US$ Mn) and Volume (Units) Forecast, by Country, 2017-2026
Table 13: U.S. Hybrid and Full Electric Marine Hybrid Propulsion Market Value (US$ Mn) and Volume (Units) Forecast, by Vessel, 2017-2026
Table 14: U.S. Hybrid and Full Electric Marine Propulsion Market Value (US$ Mn) and Volume (Units) Forecast, by Power Rating, 2017-2026
Table 15: U.S. Hybrid and Full Electric Marine Propulsion Market Value (US$ Mn) and Volume (Units) Forecast, by RPM, 2017-2026
Table 16: Canada Hybrid and Full Electric Marine Propulsion Market Value (US$ Mn) and Volume (Units) Forecast, by Vessel, 2017-2026
Table 17: Canada Hybrid and Full Electric Marine Propulsion Market Value (US$ Mn) and Volume (Units) Forecast, by Power Rating, 2017-2026
Table 18: Canada Hybrid and Full Electric Marine Propulsion Market Value (US$ Mn) and Volume (Units) Forecast, by RPM, 2017-2026
Table 19: Latin America Hybrid and Full Electric Marine Hybrid Propulsion Market Value (US$ Mn) and Volume (Units) Forecast, by Vessel, 2017-2026
Table 20: Latin America Hybrid and Full Electric Marine Propulsion Market Value (US$ Mn) and Volume (Units) Forecast, by Power Rating, 2017-2026
Table 21: Latin America Hybrid and Full Electric Marine Propulsion Market Value (US$ Mn) and Volume (Units) Forecast, by RPM, 2017-2026
Table 22: Latin America Hybrid and Full Electric Marine Propulsion Market Value (US$ Mn) and Volume (Units) Forecast, by Country and Sub-region, 2017-2026
Table 23: Brazil Hybrid and Full Electric Marine Hybrid Propulsion Market Value (US$ Mn) and Volume (Units) Forecast, by Vessel, 2017-2026
Table 24: Brazil Hybrid and Full Electric Marine Propulsion Market Value (US$ Mn) and Volume (Units) Forecast, by Power Rating, 2017-2026
Table 25: Brazil Hybrid and Full Electric Marine Propulsion Market Value (US$ Mn) and Volume (Units) Forecast, by RPM, 2017-2026
Table 26: Mexico Hybrid and Full Electric Marine Hybrid Propulsion Market Value (US$ Mn) and Volume (Units) Forecast, by Vessel, 2017-2026
Table 27: Mexico Hybrid and Full Electric Marine Propulsion Market Value (US$ Mn) and Volume (Units) Forecast, by Power Rating, 2017-2026
Table 28: Mexico Hybrid and Full Electric Marine Propulsion Market Value (US$ Mn) and Volume (Units) Forecast, by RPM, 2017-2026
Table 29: Rest of Latin America Hybrid and Full Electric Marine Hybrid Propulsion Market Value (US$ Mn) and Volume (Units) Forecast, by Vessel, 2017-2026
Table 30: Rest of Latin America Hybrid and Full Electric Marine Propulsion Market Value (US$ Mn) and Volume (Units) Forecast, by Power Rating, 2017-2026
Table 31: Rest of Latin America Hybrid and Full Electric Marine Propulsion Market Value (US$ Mn) and Volume (Units) Forecast, by RPM, 2017-2026
Table 32: Europe Hybrid and Full Electric Marine Hybrid Propulsion Market Value (US$ Mn) and Volume (Units) Forecast, by Vessel, 2017-2026
Table 33: Europe Hybrid and Full Electric Marine Propulsion Market Value (US$ Mn) and Volume (Units) Forecast, by Power Rating, 2017-2026
Table 34: Europe Hybrid and Full Electric Marine Propulsion Market Value (US$ Mn) and Volume (Units) Forecast, by RPM, 2017-2026
Table 35: Europe Hybrid and Full Electric Marine Propulsion Market Value (US$ Mn) and Volume (Units) Forecast, by Country and Sub-region, 2016-2025
Table 36: Germany Hybrid and Full Electric Marine Hybrid Propulsion Market Value (US$ Mn) and Volume (Units) Forecast, by Vessel, 2017-2026
Table 37: Germany Hybrid and Full Electric Marine Propulsion Market Value (US$ Mn) and Volume (Units) Forecast, by Power Rating, 2017-2026
Table 38: Germany Hybrid and Full Electric Marine Propulsion Market Value (US$ Mn) and Volume (Units) Forecast, by RPM, 2017-2026
Table 39: U.K. Hybrid and Full Electric Marine Hybrid Propulsion Market Value (US$ Mn) and Volume (Units) Forecast, by Vessel, 2017-2026
Table 40: U.K. Hybrid and Full Electric Marine Propulsion Market Value (US$ Mn) and Volume (Units) Forecast, by Power Rating, 2017-2026
Table 41: U.K. Hybrid and Full Electric Marine Propulsion Market Value (US$ Mn) and Volume (Units) Forecast, by RPM, 2017-2026
Table 42: France Hybrid and Full Electric Marine Hybrid Propulsion Market Value (US$ Mn) and Volume (Units) Forecast, by Vessel, 2017-2026
Table 43: France Hybrid and Full Electric Marine Propulsion Market Value (US$ Mn) and Volume (Units) Forecast, by Power Rating, 2017-2026
Table 44: France Hybrid and Full Electric Marine Propulsion Market Value (US$ Mn) and Volume (Units) Forecast, by RPM, 2017-2026
Table 45: Italy Hybrid and Full Electric Marine Hybrid Propulsion Market Value (US$ Mn) and Volume (Units) Forecast, by Vessel, 2017-2026
Table 46: Italy Hybrid and Full Electric Marine Propulsion Market Value (US$ Mn) and Volume (Units) Forecast, by Power Rating, 2017-2026
Table 47: Italy Hybrid and Full Electric Marine Propulsion Market Value (US$ Mn) and Volume (Units) Forecast, by RPM, 2017-2026
Table 48: Spain Hybrid and Full Electric Marine Hybrid Propulsion Market Value (US$ Mn) and Volume (Units) Forecast, by Vessel, 2017-2026
Table 49: Spain Hybrid and Full Electric Marine Propulsion Market Value (US$ Mn) and Volume (Units) Forecast, by Power Rating, 2017-2026
Table 50: Spain Hybrid and Full Electric Marine Propulsion Market Value (US$ Mn) and Volume (Units) Forecast, by RPM, 2017-2026
Table 51: Rest of Europe Hybrid and Full Electric Marine Hybrid Propulsion Market Value (US$ Mn) and Volume (Units) Forecast, by Vessel, 2017-2026
Table 52: Rest of Europe Hybrid and Full Electric Marine Propulsion Market Value (US$ Mn) and Volume (Units) Forecast, by Power Rating, 2017-2026
Table 53: Rest of Europe Hybrid and Full Electric Marine Propulsion Market Value (US$ Mn) and Volume (Units) Forecast, by RPM, 2017-2026
Table 54: Asia Pacific Hybrid and Full Electric Marine Hybrid Propulsion Market Value (US$ Mn) and Volume (Units) Forecast, by Vessel, 2017-2026
Table 55: Asia Pacific Hybrid and Full Electric Marine Propulsion Market Value (US$ Mn) and Volume (Units) Forecast, by Power Rating, 2017-2026
Table 56: Asia Pacific Hybrid and Full Electric Marine Propulsion Market Value (US$ Mn) and Volume (Units) Forecast, by RPM, 2017-2026
Table 57: Asia Pacific Hybrid and Full Electric Marine Propulsion Market Value (US$ Mn) and Volume (Units) Forecast, by Country and Sub-region, 2016-2025
Table 58: China Hybrid and Full Electric Marine Hybrid Propulsion Market Value (US$ Mn) and Volume (Units) Forecast, Vessel, 2017-2026
Table 59: China Hybrid and Full Electric Marine Propulsion Market Value (US$ Mn) and Volume (Units) Forecast, by Power Rating, 2017-2026
Table 60: China Hybrid and Full Electric Marine Propulsion Market Value (US$ Mn) and Volume (Units) Forecast, by RPM, 2017-2026
Table 61: India Hybrid and Full Electric Marine Hybrid Propulsion Market Value (US$ Mn) and Volume (Units) Forecast, by Vessel, 2017-2026
Table 62: India Hybrid and Full Electric Marine Propulsion Market Value (US$ Mn) and Volume (Units) Forecast, by Power Rating, 2017-2026
Table 63: India Hybrid and Full Electric Marine Propulsion Market Value (US$ Mn) and Volume (Units) Forecast, by RPM, 2017-2026
Table 64: Japan Hybrid and Full Electric Marine Hybrid Propulsion Market Value (US$ Mn) and Volume (Units) Forecast, by Vessel, 2017-2026
Table 65: Japan Hybrid and Full Electric Marine Propulsion Market Value (US$ Mn) and Volume (Units) Forecast, by Power Rating, 2017-2026
Table 66: Japan Hybrid and Full Electric Marine Propulsion Market Value (US$ Mn) and Volume (Units) Forecast, by RPM, 2017-2026
Table 67: ASEAN Hybrid and Full Electric Marine Hybrid Propulsion Market Value (US$ Mn) and Volume (Units) Forecast, by Vessel, 2017-2026
Table 68: ASEAN Hybrid and Full Electric Marine Propulsion Market Value (US$ Mn) and Volume (Units) Forecast, by Power Rating, 2017-2026
Table 69: ASEAN Hybrid and Full Electric Marine Propulsion Market Value (US$ Mn) and Volume (Units) Forecast, by RPM, 2017-2026
Table 70: Rest of Asia Pacific Hybrid and Full Electric Marine Hybrid Propulsion Market Value (US$ Mn) and Volume (Units) Forecast, by Vessel, 2017-2026
Table 71: Rest of Asia Pacific Hybrid and Full Electric Marine Propulsion Market Value (US$ Mn) and Volume (Units) Forecast, by Power Rating, 2017-2026
Table 72: Rest of Asia Pacific Hybrid and Full Electric Marine Propulsion Market Value (US$ Mn) and Volume (Units) Forecast, by RPM, 2017-2026
Table 73: Middle East & Africa Hybrid and Full Electric Marine Hybrid Propulsion Market Value (US$ Mn) and Volume (Units) Forecast, by Vessel, 2017-2026
Table 74: Middle East & Africa Hybrid and Full Electric Marine Propulsion Market Value (US$ Mn) and Volume (Units) Forecast, by Power Rating, 2017-2026
Table 75: Middle East & Africa Hybrid and Full Electric Marine Propulsion Market Value (US$ Mn) and Volume (Units) Forecast, by RPM, 2017-2026
Table 76: Middle East & Africa Hybrid and Full Electric Marine Propulsion Market Value (US$ Mn) and Volume (Units) Forecast, by Country and Sub-region, 2017-2026
Table 77: GCC Hybrid and Full Electric Marine Hybrid Propulsion Market Value (US$ Mn) and Volume (Units) Forecast, by Vessel, 2017-2026
Table 78: GCC Hybrid and Full Electric Marine Propulsion Market Value (US$ Mn) and Volume (Units) Forecast, by Power Rating, 2017-2026
Table 79: GCC Hybrid and Full Electric Marine Propulsion Market Value (US$ Mn) and Volume (Units) Forecast, by RPM, 2017-2026
Table 80: South Africa Hybrid and Full Electric Marine Hybrid Propulsion Market Value (US$ Mn) and Volume (Units) Forecast, by Vessel, 2017-2026
Table 81: South Africa Hybrid and Full Electric Marine Propulsion Market Value (US$ Mn) and Volume (Units) Forecast, by Power Rating, 2017-2026
Table 82: South Africa Hybrid and Full Electric Marine Propulsion Market Value (US$ Mn) and Volume (Units) Forecast, by RPM, 2017-2026
Table 83: Rest of Middle East & Africa Hybrid and Full Electric Marine Hybrid Propulsion Market Value (US$ Mn) and Volume (Units) Forecast, by Vessel, 2017-2026
Table 84: Rest of Middle East & Africa Hybrid and Full Electric Marine Propulsion Market Value (US$ Mn) and Volume (Units) Forecast, by Power Rating, 2017-2026
Table 85: Rest of Middle East & Africa Hybrid and Full Electric Marine Propulsion Market Value (US$ Mn) and Volume (Units) Forecast, by RPM, 2017-2026
List of Figures
Figure 01: Global Hybrid and Full Electric Marine Propulsion Market Size, by Market Value (US$ Mn) Share and Region, 2017
Figure 02 : Global Crude Oil Prices, 2006–2018 (US$ per Barrel)
Figure 03: Specific Energy (Wh/Kg), by Battery Type
Figure 04: Pricing, by Battery Type ($/Kwh), 2017
Figure 05: Global Hybrid and Full-Electric Marine Vessels, % Share, by Battery Type, 2017
Figure 06: Marine Battery Packs Suppliers, Market Share Analysis
Figure 07: Global Full-electric Marine Propulsion Market, Vessel, by Region, 2017
Figure 08: Global Hybrid Marine Vessel, % Share, by Vessel Type, 2017
Figure 09: Global Hybrid and Full Electric Marine Propulsion Market Value (US$ Mn) Share Analysis, by Propulsion Type, 2017 and 2026
Figure 10: Global Hybrid and Full Electric Marine Propulsion Market Value (US$ Mn) Forecast, by Propulsion Type, 2017-2026
Figure 11: Global Hybrid and Full Electric Marine Propulsion Market Volume (Units) Forecast, by Propulsion Type, 2017-2026
Figure 12: Global Hybrid and Full Electric Marine Propulsion Market Attractiveness Analysis, by Propulsion Type
Figure 13: Global Hybrid and Full Electric Marine Propulsion Market Value (US$ Mn) Share Analysis, by Vessel, 2017 and 2026
Figure 14: Global Hybrid and Full Electric Marine Propulsion Market Attractiveness Analysis, by Vessel
Figure 15: Global Hybrid and Full Electric Marine Propulsion Market Value (US$ Mn) Share Analysis, by Power Rating, 2017 and 2026
Figure 16: Global Hybrid and Full Electric Marine Propulsion Market Attractiveness Analysis, by Power rating
Figure 17: Global Marine Hybrid Propulsion Market Value (US$ Mn) Share Analysis, by RPM, 2017 and 2026
Figure 18: Global Hybrid and Full Electric Marine Propulsion Market Attractiveness Analysis, by RPM
Figure 19: Global Hybrid and Full Electric Marine Propulsion Market Value Share Analysis, by Region, 2017 and 2026
Figure 20: Global Full-electric Marine Propulsion Market, Number of Vessel, by Country, 2017
Figure 21: North America Hybrid and Full Electric Marine Propulsion Market Value (US$ Mn) and Volume (Units) Forecast, 2017–2026
Figure 22: North America Hybrid and Full Electric Marine Propulsion Market Value Share (US$ Mn) Analysis, by Propulsion Type, 2017 and 2026
Figure 23: North America Hybrid and Full Electric Marine Propulsion Market Value Share (US$ Mn) Analysis, by Vessel, 2017 and 2026
Figure 24: North America Hybrid and Full Electric Marine Propulsion Market Value Share (US$ Mn) Analysis, by Power Rating, 2017 and 2026
Figure 25: North America Hybrid and Full Electric Marine Propulsion Market Value Share (US$ Mn) Analysis, by RPM, 2017 and 2026
Figure 26: North America Marine Hybrid Propulsion Market Value (US$ Mn) Forecast, by Propulsion Type, 2017-2026
Figure 27: North America Marine Hybrid Propulsion Market Volume (Units) Forecast, by Propulsion Type, 2017-2026
Figure 28: North America Market Value Share (US$ Mn) Analysis, by Country, 2017 and 2026
Figure 29: Latin America Hybrid and Full Electric Marine Propulsion Market Value (US$ Mn) and Volume (Units) Forecast, 2017–2026
Figure 30: Latin America Hybrid and Full Electric Marine Propulsion Market Value Share (US$ Mn) Analysis, by Propulsion Type, 2017 and 2026
Figure 31: Latin America Hybrid and Full Electric Marine Propulsion Market Value Share (US$ Mn) Analysis, by Vessel, 2017 and 2026
Figure 32: Latin America Hybrid and Full Electric Marine Propulsion Market Value Share (US$ Mn) Analysis, by Power Rating, 2017 and 2026
Figure 33: Latin America Hybrid and Full Electric Marine Propulsion Market Value Share (US$ Mn) Analysis, by RPM, 2017 and 2026
Figure 34: Latin America Hybrid and Full Electric Marine Propulsion Market Value (US$ Mn) Forecast, by Propulsion Type, 2017-2026
Figure 35: Latin America Hybrid and Full Electric Marine Propulsion Market Volume (Units) Forecast, by Propulsion Type, 2017-2026
Figure 36: Latin America Hybrid and Full Electric Marine Propulsion Market Value Share (US$ Mn) Analysis, by Country and Sub-region, 2017 and 2026
Figure 37: Europe Hybrid and Full Electric Marine Propulsion Market Value (US$ Mn) and Volume (Units) Forecast, 2017–2026
Figure 38: Europe Hybrid and Full Electric Marine Propulsion Market Value Share (US$ Mn) Analysis, by Propulsion Type, 2017 and 2026
Figure 39: Europe Hybrid and Full Electric Marine Propulsion Market Value Share (US$ Mn) Analysis, by Vessel, 2017 and 2026
Figure 40: Europe Hybrid and Full Electric Marine Propulsion Market Value Share (US$ Mn) Analysis, by Power Rating, 2017 and 2026
Figure 41: Europe Hybrid and Full Electric Marine Propulsion Market Value Share (US$ Mn) Analysis, by RPM, 2017 and 2026
Figure 42: Europe Marine Hybrid Propulsion Market Value (US$ Mn) Forecast, by Propulsion Type, 2017-2026
Figure 43: Europe Marine Hybrid Propulsion Market Volume (Units) Forecast, by Propulsion Type, 2017-2026
Figure 44: Europe Market Value Share (US$ Mn) Analysis, by Country and Sub-region, 2017 and 2026
Figure 45: Asia Pacific Hybrid and Full Electric Marine Propulsion Market Value (US$ Mn) and Volume (Units) Forecast, 2017–2026
Figure 46: Asia Pacific Hybrid and Full Electric Marine Propulsion Market Value Share (US$ Mn) Analysis, by Propulsion Type, 2017 and 2026
Figure 47: Asia Pacific Hybrid and Full Electric Marine Propulsion Market Value Share (US$ Mn) Analysis, by Vessel, 2017 and 2026
Figure 48: Asia Pacific Hybrid and Full Electric Marine Propulsion Market Value Share (US$ Mn) Analysis, by Power Rating, 2017 and 2026
Figure 49: Asia Pacific Hybrid and Full Electric Marine Propulsion Market Value Share (US$ Mn) Analysis, by RPM, 2017 and 2026
Figure 50: Asia Pacific Hybrid and Full Electric Marine Propulsion Market Value (US$ Mn) Forecast, by Propulsion Type, 2017-2026
Figure 51: Asia Pacific Hybrid and Full Electric Marine Propulsion Market Volume (Units) Forecast, by Propulsion Type, 2017-2026
Figure 52: Asia Pacific Market Value Share (US$ Mn) Analysis, by Country and Sub-region, 2017 and 2026
Figure 53: Middle East & Africa Hybrid and Full Electric Marine Propulsion Market Value (US$ Mn) and Volume (Units) Forecast, 2017–2026
Figure 54: Middle East & Africa Hybrid and Full Electric Marine Propulsion Market Value Share (US$ Mn) Analysis, by Propulsion Type, 2017 and 2026
Figure 55: Middle East & Africa Hybrid and Full Electric Marine Propulsion Market Value Share (US$ Mn) Analysis, by Vessel, 2017 and 2026
Figure 56: Middle East & Africa Hybrid and Full Electric Marine Propulsion Market Value Share (US$ Mn) Analysis, by Power Rating, 2017 and 2026
Figure 57: Middle East & Africa Hybrid and Full Electric Marine Propulsion Market Value Share (US$ Mn) Analysis, by RPM, 2017 and 2026
Figure 58: Middle East & Africa Hybrid and Full Electric Marine Propulsion Market Value (US$ Mn) Forecast, by Propulsion Type, 2017-2026
Figure 59: Middle East & Africa Hybrid and Full Electric Marine Propulsion Market Volume (Units) Forecast, by Propulsion Type, 2017-2026
Figure 60: Middle East & Africa Market Value Share (US$ Mn) Analysis, by Country and Sub-region, 2017 and 2026
Figure 61: Global Hybrid and Full Electric Marine Propulsion Market Share Analysis, by Company (2017)
Copyright © Transparency Market Research, Inc. All Rights reserved
Trust Online

Hybrid and Full Electric Marine Propulsion Market