
Reports
Reports
Hereditary angioedema is a rare disease and is mostly mistaken for common allergic reactions and abdominal pain. This mainly on account of the lack of knowledge among both physicians and patients about the condition. About 40% of the affected patients are diagnosed correctly with hereditary angioedema in the U.S. and Europe. With progress in diagnostic field and different initiatives undertaken by patient bodies and industry players to spread awareness, the market for hereditary angioedema is projected to grow.
Another factor stoking growth in the market is the rise in hereditary angioedema (HAE) attacks. The frequency and severity of HAE attacks is found to be increased with triggers such as stress, anxiety, minor surgeries, hormone replacement therapies and ACE inhibitors used for treatment of hypertension. According to World Allergy Organization, an estimated 40 million people are receiving ACE inhibitor treatment annually.
Posing a hindrance to the market is the few approved specialty HAE drugs that are expensive. As a result patients mostly opt for conventional drugs, thus hampering the global hereditary angioedema market.
A report by Transparency Market Research finds that the global hereditary angioedema market will likely become worth US$3.81 bn by 2025 from US$ 1.73 bn in 2016 by registering a strong 9.1% CAGR from 2017 to 2025.
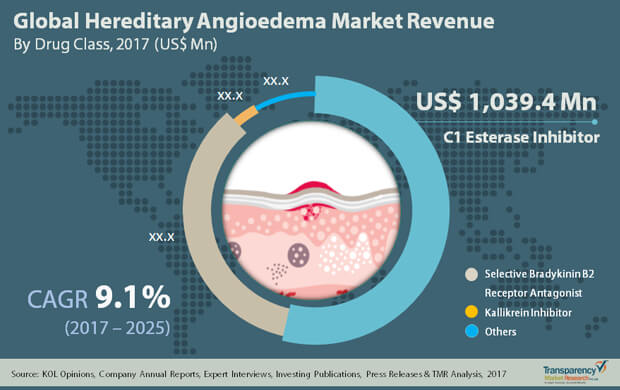
The global hereditary angioedema market can be classified on the basis of the class of drugs into C1 Esterase Inhibitor, Selective Bradykinin B2 Receptor Antagonist, Kallikrein Inhibitor, and others such as conventional and pipeline. The C1 esterase inhibitor can be further divided into drugs such as Cinryze, Berinert, and Ruconest. Among them, C1 esterase inhibitor, accounted for more than half the share in the market in 2016 and going forward too, the segment is slated to dominate the market on account of its use in prophylactic treatment and acute HAE attack treatment. The emergence of novel products will aid the segment to hold on to its leading share in the future. This is forecasted to clock a CAGR of 4.3% from 2017 to 2025.
North America, Europe and the Rest of the World are the three key geographical segments in the global hereditary angioedema market. North America, of them, is the leading region which is projected to rise at a healthy CAGR of 8.3% from 2017 to 2025 to retain its dominance in the near future. Reasons for the region’s leading position is a highly developed healthcare infrastructure and strong support from public and private sector in terms of reimbursements. Besides, rise in awareness about hereditary angioedema among patients has led to improvements in diagnosis and adoption of specialty drugs for treatment. This is also predicted to boost the market.
Europe trails North America in terms of market share in the global hereditary angioedema market. The market in the region is forecasted to rise at a CAGR of 10.8% between 2017 and 2025. So far, slow approvals, dearth of awareness about the condition and delay in re-imbursement for treatment has acted as roadblock to the market in Europe. However, with about an estimated 2000 hereditary angioedema patients in Germany and the U.K., the market seems to have ample room for growth.
Some of the important vendors in the global hereditary angioedema market are Pharming Group NV, Shire plc, CSL Limited, Ionis Pharmaceuticals, Inc., iBio Inc., and BioCryst Pharmaceuticals, Inc.
1. Preface
1.1. Market Definition and Scope
1.2. Market Segmentation
1.3. Key Research Objectives
1.4. Research Highlights
2. Assumptions and Research Methodology
3. Executive Summary: Global Hereditary Angioedema Market
4. Market Overview
4.1. Introduction
4.1.1. Product Definition
4.1.2. Industry Evolution / Developments
4.2. Market Overview
4.3. Market Dynamics
4.3.1. Drivers
4.3.2. Restraints
4.3.3. Opportunities
4.3.4. Trends
4.4. Hereditary Angioedema Market Analysis and Forecast, 2017 – 2025
4.4.1. Market Revenue Projections (US$ Mn)
4.5. Market Outlook
4.6. Porter’s five forces analysis
4.7. Value Chain Analysis
4.8. Pipeline Analysis
4.9. Orphan Drug Exclusivity Details
4.10. Disease Overview
5. Global Hereditary Angioedema Market Analysis and Forecasts, By Drug Class
5.1. Introduction & Definition
5.2. Key Findings
5.3. Key Trends
5.4. Market Size (US$ Mn) Forecast By Drug Class
5.4.1. C1 esterase inhibitor
5.4.1.1. Cinryze
5.4.1.2. Berinert
5.4.1.3. Ruconest
5.4.2. Selective bradykinin B2 receptor antagonist
5.4.2.1. Firazyr
5.4.3. Kallikrein inhibitor
5.4.3.1. Kalbitor
5.4.4. Others
5.4.4.1. Conventional Drugs
5.4.4.2. Pipeline Drugs
5.5. Comparison Matrix
5.6. Market Attractiveness By Drug Class
6. Global Hereditary Angioedema Market Analysis and Forecasts, By Route of Administration
6.1. Introduction & Definition
6.2. Key Findings
6.3. Market Size (US$ Mn) Forecast By Route of Administration
6.3.1. Intravenous
6.3.2. Subcutaneous injection
6.3.3. Oral
6.4. Comparison Matrix
6.5. Market Attractiveness By Route of Administration
7. Global Hereditary Angioedema Market Analysis and Forecasts, By Distribution Channel
7.1. Introduction & Definition
7.2. Key Findings
7.3. Key Trends
7.4. Market Size (US$ Mn) Forecast By Distribution Channel
7.4.1. Hospital pharmacies
7.4.2. Retail pharmacies
7.4.3. Others
7.5. Comparison Matrix
7.6. Market Attractiveness By Distribution Channel
8. Global Hereditary Angioedema Market Analysis and Forecasts, By Region
8.1. Key Findings
8.2. Key Trends
8.3. Market Size (US$ Mn) Forecast By Region
8.3.1. North America
8.3.2. Europe
8.3.3. Rest of the World
8.4. Market Attractiveness By Region
9. North America Hereditary Angioedema Market Analysis and Forecast
9.1. Key Findings
9.2. Policies and Regulations
9.3. Market Overview
9.4. Market Size (US$ Mn) Forecast By Drug Class
9.4.1. C1 esterase inhibitor
9.4.1.1. Cinryze
9.4.1.2. Berinert
9.4.1.3. Ruconest
9.4.2. Selective bradykinin B2 receptor antagonist
9.4.2.1. Firazyr
9.4.3. Kallikrein inhibitor
9.4.3.1. Kalbitor
9.4.4. Others
9.4.4.1. Conventional Drugs
9.4.4.2. Pipeline Drugs
9.5. Market Size (US$ Mn) Forecast By Route of Administration
9.5.1. Intravenous
9.5.2. Subcutaneous injection
9.5.3. Oral
9.6. Market Size (US$ Mn) Forecast By Distribution Channel
9.6.1. Hospital pharmacies
9.6.2. Retail pharmacies
9.6.3. Others
9.7. Market Size by Value (US$ Mn) Forecast, By Country
9.7.1. U.S.
9.7.2. Canada
9.8. Market Attractiveness Analysis
9.8.1. By Drug Class
9.8.2. By Route of Administration
9.8.3. By Distribution Channel
9.8.4. By Country
10. Europe Hereditary Angioedema Market Analysis and Forecast
10.1. Key Findings
10.2. Policies and Regulations
10.3. Market Overview
10.4. Market Size (US$ Mn) Forecast By Drug Class
10.4.1. C1 esterase inhibitor
10.4.1.1. Cinryze
10.4.1.2. Berinert
10.4.1.3. Ruconest
10.4.2. Selective bradykinin B2 receptor antagonist
10.4.2.1. Firazyr
10.4.3. Others
10.4.3.1. Conventional Drugs
10.4.3.2. Pipeline Drugs
10.5. Market Size (US$ Mn) Forecast By Route of Administration
10.5.1. Intravenous
10.5.2. Subcutaneous injection
10.5.3. Oral
10.6. Market Size (US$ Mn) Forecast By Distribution Channel
10.6.1. Hospital pharmacies
10.6.2. Retail pharmacies
10.6.3. Others
10.7. Market Size by Value (US$ Mn) Forecast, By Country
10.7.1. Germany
10.7.2. U.K.
10.7.3. France
10.7.4. Spain
10.7.5. Italy
10.7.6. Rest of Europe
10.8. Market Attractiveness Analysis
10.8.1. By Drug Class
10.8.2. By Route of Administration
10.8.3. By Distribution Channel
10.8.4. By Country / Sub-region
11. Rest of The World Hereditary Angioedema Market Analysis and Forecast
11.1. Key Findings
11.2. Policies and Regulations
11.3. Market Overview
11.4. Market Size (US$ Mn) Forecast By Drug Class
11.4.1. C1 esterase inhibitor
11.4.1.1. Cinryze
11.4.1.2. Berinert
11.4.1.3. Ruconest
11.4.2. Selective bradykinin B2 receptor antagonist
11.4.2.1. Firazyr
11.4.3. Kallikrein inhibitor
11.4.3.1. Kalbitor
11.4.4. Others
11.4.4.1. Conventional Drugs
11.4.4.2. Pipeline Drugs
11.5. Market Size (US$ Mn) Forecast By Route of Administration
11.5.1. Intravenous
11.5.2. Subcutaneous injection
11.5.3. Oral
11.6. Market Size (US$ Mn) Forecast By Distribution Channel
11.6.1. Hospital pharmacies
11.6.2. Retail pharmacies
11.6.3. Others
11.7. Market Attractiveness Analysis
11.7.1. By Drug Class
11.7.2. By Route of Administration
11.7.3. By Distribution Channel
12. Competition Landscape
12.1. Market Share Analysis
12.2. Market Player – Competition Matrix (By Tier and Size of companies)
12.3. Company Profiles (Details – Overview, Financials, Recent Developments, Strategy)
12.3.1. Shire plc
12.3.1.1. Company Overview (HQ, Business Segments, Employee Strength)
12.3.1.2. Product Portfolio
12.3.1.3. SWOT Analysis
12.3.1.4. Financial Overview
12.3.1.5. Strategic Overview
12.3.2. CSL Limited
12.3.2.1. Company Overview (HQ, Business Segments, Employee Strength)
12.3.2.2. Product Portfolio
12.3.2.3. SWOT Analysis
12.3.2.4. Financial Overview
12.3.2.5. Strategic Overview
12.3.3. Pharming Group NV
12.3.3.1. Company Overview (HQ, Business Segments, Employee Strength)
12.3.3.2. Product Portfolio
12.3.3.3. SWOT Analysis
12.3.3.4. Financial Overview
12.3.3.5. Strategic Overview
12.3.4. Ionis Pharmaceuticals, Inc.
12.3.4.1. Company Overview (HQ, Business Segments, Employee Strength)
12.3.4.2. Product Portfolio
12.3.4.3. SWOT Analysis
12.3.4.4. Financial Overview
12.3.4.5. Strategic Overview
12.3.5. iBio Inc.
12.3.5.1. Company Overview (HQ, Business Segments, Employee Strength)
12.3.5.2. Product Portfolio
12.3.5.3. SWOT Analysis
12.3.5.4. Financial Overview
12.3.5.5. Strategic Overview
12.2.6. BioCryst Pharmaceuticals, Inc.
12.3.6.1. Company Overview (HQ, Business Segments, Employee Strength)
12.3.6.2. Product Portfolio
12.3.6.3. SWOT Analysis
12.3.6.4. Financial Overview
12.3.6.5. Strategic Overview
List of Tables
Table 01: Pipeline Analysis, by Phase III
Table 02: Pipeline Analysis, By Phase II and Phase I
Table 03: Pipeline Analysis, By Preclinical Trial (1/2)
Table 04: Pipeline Analysis, By Preclinical Trial (2/2)
Table 05: Orphan Drug Exclusivity (1/3)
Table 06: Orphan Drug Exclusivity (2/3)
Table 07: Orphan Drug Exclusivity (3/3)
Table 08: Disease Overview by Type of HAE
Table 09: Reported and Estimated Cases of HAE, By Country
Table 10: Global Hereditary Angioedema Market Value (US$ Mn) Forecast, by Drug Class, 2015–2025
Table 11: Global Hereditary Angioedema Market Value (US$ Mn) Forecast, by C1 Esterase Inhibitor, 2015–2025
Table 12: Global Hereditary Angioedema Market Value (US$ Mn) Forecast, by Others, 2015–2025
Table 13: Global Hereditary Angioedema Market Value (US$ Mn) Forecast, by Route of Administration, 2015–2025
Table 14: Global Hereditary Angioedema Market Size (US$ Mn) Forecast, by Distribution Channel, 2015–2025
Table 15: Global Hereditary Angioedema Market Size (US$ Mn) Forecast, by Region, 2015–2025
Table 16: North America Hereditary Angioedema Market Value (US$ Mn) Forecast, by Drug Class, 2015–2025
Table 17: North America Hereditary Angioedema Market Value (US$ Mn) Forecast, by C1 Esterase Inhibitor, 2015–2025
Table 18: North America Hereditary Angioedema Market Value (US$ Mn) Forecast, by Drug Class - Others, 2015–2025
Table 19: North America Hereditary Angioedema Market Value (US$ Mn) Forecast, by Route of Administration, 2015–2025
Table 20: North America Hereditary Angioedema Market Value (US$ Mn) Forecast, by Distribution Channel, 2015–2025
Table 21: North America Hereditary Angioedema Market Value (US$ Mn) Forecast, by Country, 2015–2025
Table 22: Europe Hereditary Angioedema Market Value (US$ Mn) Forecast, by Drug Class, 2015–2025
Table 23: Europe Hereditary Angioedema Market Value (US$ Mn) Forecast, by C1 esterase inhibitor, 2015–2025
Table 24: Europe Hereditary Angioedema Market Value (US$ Mn) Forecast, by Others, 2015–2025
Table 25: Europe Hereditary Angioedema Market Value (US$ Mn) Forecast, by Route of Administration, 2015–2025
Table 26: Europe Hereditary Angioedema Market Value (US$ Mn) Forecast, by Distribution Channel, 2015–2025
Table 27: Europe Hereditary Angioedema Market Value (US$ Mn) Forecast, by Country, 2015–2025
Table 28: Rest of the World Hereditary Angioedema Market Value (US$ Mn) Forecast, by Drug Class, 2015–2025
Table 29: Rest of the World Hereditary Angioedema Market Value (US$ Mn) Forecast, by Drug Class - C1 Esterase Inhibitor, 2015–2025
Table 30: Rest of the World Hereditary Angioedema Market Value (US$ Mn) Forecast, by Drug Class - Others, 2015–2025
Table 31: Rest of the World Hereditary Angioedema Market Value (US$ Mn) Forecast, by Route of Administration, 2015–2025
Table 32: Rest of the World Hereditary Angioedema Market Value (US$ Mn) Forecast, by Distribution Channel, 2015–2025
List of Figures
Figure 01: Global Hereditary Angioedema, by Drug Class, Market Size (US$ Mn), 2016 (A)
Figure 02: Global Hereditary Angioedema Market Revenue (%), by Route of Administration, 2016 (A)
Figure 03: Global Hereditary Angioedema Market Revenue (%), by Region, 2016 (A)
Figure 04: Opportunity Map, By Drug Class 2016
Figure 05: Opportunity Map, By Route of Administration and Distribution Channel 2016
Figure 06: Global Hereditary Angioedema Market - Key Industry Developments
Figure 07: Global Hereditary Angioedema Market – Key Drivers and Restraints
Figure 08: Global Hereditary Angioedema Market - Opportunity Analysis
Figure 09: Global Hereditary Angioedema Market Size (US$ Mn) Forecast, 2015–2025
Figure 10: Porter’s Five Forces Analysis
Figure 11: Global Hereditary Angioedema Market - Value Chain Analysis
Figure 12: Market Value Share, by Drug Class (2016)
Figure 13: Market Value Share, by Route of Administration (2016)
Figure 14: Market Value Share, by Distribution Channel (2016)
Figure 15: Global Hereditary Angioedema Market Value Share Analysis, by Drug Class, 2016 and 2025
Figure 16: Global Hereditary Angioedema Market Revenue (US$ Mn) and Y-o-Y Growth (%), by C1 Esterase Inhibitor, 2015–2025
Figure 17: Global Hereditary Angioedema Market Revenue (US$ Mn) and Y-o-Y Growth (%), by Selective Bradykinin B2 Receptor Antagonist, 2015–2025
Figure 18: Global Hereditary Angioedema Market Revenue (US$ Mn) and Y-o-Y Growth (%), by Kallikrein Inhibitor, 2015–2025
Figure 19: Global Hereditary Angioedema Market Revenue (US$ Mn) and Y-o-Y Growth (%), by Others, 2015–2025
Figure 20: Global Hereditary Angioedema Market Attractiveness Analysis, by Drug Class
Figure 21: Global Hereditary Angioedema Market Value Share Analysis, by Route of Administration, 2016 and 2025
Figure 22: Global Hereditary Angioedema Market Revenue (US$ Mn) and Y-o-Y Growth (%), by Intravenous, 2015–2025
Figure 23: Global Hereditary Angioedema Market Revenue (US$ Mn) and Y-o-Y Growth (%), by Subcutaneous Injection, 2015–2025
Figure 24: Global Hereditary Angioedema Market Revenue (US$ Mn) and Y-o-Y Growth (%), by Oral, 2015–2025
Figure 25: Global Hereditary Angioedema Market Attractiveness Analysis, by Route of Administration
Figure 26: Global Hereditary Angioedema Market Value Share Analysis, by Distribution Channel, 2016 and 2025
Figure 27: Global Hereditary Angioedema Market Revenue (US$ Mn) and Y-o-Y Growth (%), by Hospital Pharmacies, 2015–2025
Figure 28: Global Hereditary Angioedema Market Revenue (US$ Mn) and Y-o-Y Growth (%), by Retail Pharmacies, 2015–2025
Figure 29: Global Hereditary Angioedema Market Revenue (US$ Mn) and Y-o-Y Growth (%), by Others, 2015–2025
Figure 30: Global Hereditary Angioedema Market Attractiveness Analysis, by Distribution Channel, 2017–2025
Figure 31: Global Hereditary Angioedema Market Value Share Analysis, by Region, 2016 and 2025
Figure 32: Global Hereditary Angioedema Market Attractiveness Analysis, by Region
Figure 33: North America Hereditary Angioedema Market Size (US$ Mn) Forecast, 2017–2025
Figure 34: North America Hereditary Angioedema Market Value Share Analysis, by Drug Class, 2016 and 2025
Figure 35: North America Hereditary Angioedema Market Value Share Analysis, by Route of Administration, 2016 and 2025
Figure 36: North America Hereditary Angioedema Market Value Share Analysis, by Distribution Channel, 2016 and 2025
Figure 37: North America Hereditary Angioedema Market Value Share Analysis, by Country, 2016 and 2025
Figure 38: North America Hereditary Angioedema Market Attractiveness Analysis, by Drug Class
Figure 39: North America Hereditary Angioedema Market Attractiveness Analysis, by Route of Administration
Figure 40: North America Hereditary Angioedema Market Attractiveness Analysis, by Distribution Channel
Figure 41: North America Market Attractiveness Analysis, by Country
Figure 42: Europe Hereditary Angioedema Market Size (US$ Mn) Forecast, 2017–2025
Figure 43: Europe Hereditary Angioedema Market Value Share Analysis, by Drug Class, 2016 and 2025
Figure 44: Europe Hereditary Angioedema Market Value Share Analysis, by Route of Administration, 2016 and 2025
Figure 45: Europe Hereditary Angioedema Market Value Share Analysis, by Distribution Channel, 2016 and 2025
Figure 46: Europe Hereditary Angioedema Market Value Share Analysis, by Country, 2016 and 2025
Figure 47: Europe Hereditary Angioedema Market Attractiveness Analysis, by Drug Class
Figure 48: Europe Hereditary Angioedema Market Attractiveness Analysis, by Route of Administration
Figure 49: Europe Hereditary Angioedema Market Attractiveness Analysis, by Distribution Channel
Figure 50: Europe Market Attractiveness Analysis, by Country
Figure 51: Rest of the World Hereditary Angioedema Market Size (US$ Mn) Forecast, 2015–2025
Figure 52: Rest of the World Hereditary Angioedema Market Value Share Analysis, by Drug Class, 2016 and 2025
Figure 53: Rest of the World Hereditary Angioedema Market Value Share Analysis, by Route of Administration, 2016 and 2025
Figure 54: Rest of the World Hereditary Angioedema Market Value Share Analysis, by Distribution Channel, 2016 and 2025
Figure 55: Rest of the World Hereditary Angioedema Market Attractiveness Analysis, by Drug Class
Figure 56: Rest of the World Hereditary Angioedema Market Attractiveness Analysis, by Route of Administration
Figure 57: Rest of the World Hereditary Angioedema Market Attractiveness Analysis, by Distribution Channel
Figure 58: Global Hereditary Angioedema Market Share Analysis, by Company (2016)
Figure 59: Shire Plc. Breakdown of Net Sales, by Segment, 2016
Figure 60: Shire Plc. Revenue (US$ Bn) and Y-o-Y Growth (%), 2013–2016
Figure 61: CSL Limited Breakdown of Net Sales, by Region, 2015
Figure 62: CSL Limited Revenue (US$ Bn) and Y-o-Y Growth (%), 2012–2015
Figure 63: Pharming Group NV Revenue (US$ Mn) and Y-o-Y Growth (%), 2014–2016
Figure 64: Ionis Pharmaceuticals, Inc. Revenue (US$ Mn) and Y-o-Y Growth (%), 2013–2016
Figure 65: iBio, Inc. Revenue (US$ Mn) and Y-o-Y Growth (%), 2014–2016
Figure 66: BioCryst Pharmaceuticals, Inc. Revenue (US$ Mn) and Y-o-Y Growth (%), 2013–2016
Copyright © Transparency Market Research, Inc. All Rights reserved
Trust Online

Hereditary Angioedema Market