
Reports
Reports
Head protection equipment are designed for workplace safety. In order to ensure safety and enhance productivity, increasing number of industries are using head protection equipment. These head protection equipment are now equipped with sensors, hence along with ensuring safety and monitoring health conditions, these smart helmets are also helping in performing other activities such as collecting data, communicating, etc.
Manufacturers are increasingly investing in research and development activities to develop helmets to provide advanced wearable technology that increases efficiency and helps in minimizing workplace injury. Smart helmets equipped with sensors are contributing towards workers safety. High-tech sensors, cameras are also being integrated into helmets to enable users to see within the machines and walls and detect any problem, thereby reducing any errors.
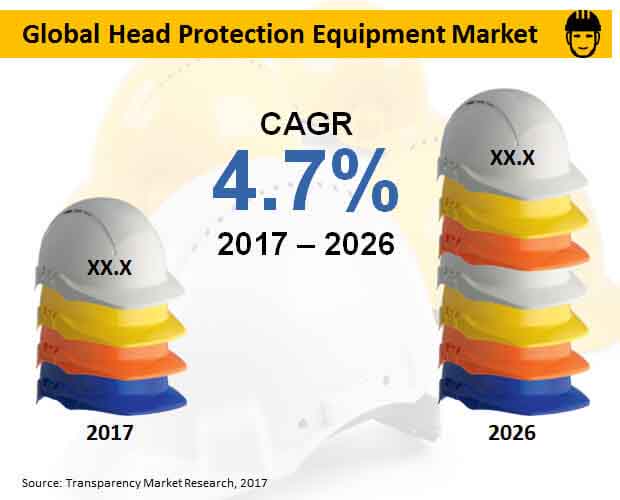
According to a study by Transparency Market Research (TMR), the global market for head protection equipment is likely to see moderate growth during 2017-2026. The market is projected to register 4.7% CAGR between 2017 and 2026, reaching US$ 6,841.3 million revenue by the end of 2026.
Class B helmet is likely to emerge as one of the top-selling products in the global market for head protection equipment. By the end of 2026, class B helmet is projected to reach nearly US$ 3,900 million revenue. Meanwhile, class C helmet is also likely to witness growth between 2017 and 2026.
Head protection equipment is likely to find the largest application in the manufacturing sector. Witnessing a healthy growth during 2017-2026, manufacturing sector is projected to create an incremental opportunity of more than US$ 500 million between 2017 and 2026. Increased risk of work-related injuries in the manufacturing sector is driving the growth of head protection equipment in this sector. Meanwhile, the construction sector is also likely to witness growth in the use of head protection equipment during 2017-2026.
Sales of head protection equipment is likely to be highest through direct (B2B) sales channel. By the end of 2026, direct (B2B) sales channel is projected to surpass US$ 4,600 million revenue. Meanwhile, distributors are likely to account for nearly one-third of the revenue share by 2017 end.
Europe is likely to dominate the global market for head protection equipment during 2017-2026. Stringent regulations enforcing the use of safety helmets across manufacturing sector in various countries in Europe is driving the growth of head protection equipment market in the region. Moreover, the presence of a large number of companies dealing in safety equipment including workwear, safety boots, safety helmets, and gloves are also fueling the growth of head protection equipment market in Europe. Meanwhile, North America and APEJ are also likely to witness growth during 2017-2026. Increasing demand for smart helmets and the presence of major tech companies in the U.S. is driving the growth of head protection equipment with advanced features in North America. Increasing number of infrastructure and construction projects in India and China is likely to drive the demand for head protection equipment in APEJ.
Some of the key market players in the global market for head protection equipment mentioned in the report are Honeywell International Inc., Bullard, E. I. du Pont de Nemours and Company, MSA, Uvex Group, 3M, Lakeland Industries, Inc., Pinnacle Protection Enterprises, Centurion Safety EU, and Cintas Corporation. Most of the key market players are moving towards producing smart helmets for various industries and are also focusing on developing sensor-equipped helmet as per the specific industry tasks.
1. Global Head Protection Equipment Market - Executive Summary
2. Global Head Protection Equipment Market Overview
2.1. Introduction
2.1.1. Global Head Protection Equipment Market Taxonomy
2.1.2. Global Head Protection Equipment Market Definition
2.2. Global Head Protection Equipment Market Size (US$ Mn) and Forecast, 2012-2026
2.2.1. Global Head Protection Equipment Market Y-o-Y Growth
2.3. Global Head Protection Equipment Market Dynamics
2.4. Parent Market Overview
2.5. Key Regulations
2.6. Patent Analysis
2.7. Manufacturing Sector Overview
2.8. Forecast Factors
2.9. Scenario Forecast
2.10. Supply Chain
2.11. Product Life Cycle
2.12. PESTL Analysis
2.13. Service Provider List
2.14. Key Participants Market Presence (Intensity Map) By Region
3. Global Head Protection Equipment Market Analysis and Forecast 2012-2026
3.1. Global Head Protection Equipment Market Size and Forecast By Product Type, 2012-2026
3.1.1. Class A Helmet Market Size and Forecast, 2012-2026
3.1.1.1. Revenue (US$ Mn) Comparison, By Region
3.1.1.2. Market Share Comparison, By Region
3.1.1.3. Y-o-Y growth Comparison, By Region
3.1.2. Class B Helmet Market Size and Forecast, 2012-2026
3.1.2.1. Revenue (US$ Mn) Comparison, By Region
3.1.2.2. Market Share Comparison, By Region
3.1.2.3. Y-o-Y growth Comparison, By Region
3.1.3. Class C Helmet Market Size and Forecast, 2012-2026
3.1.3.1. Revenue (US$ Mn) Comparison, By Region
3.1.3.2. Market Share Comparison, By Region
3.1.3.3. Y-o-Y growth Comparison, By Region
3.2. Global Head Protection Equipment Market Size and Forecast By Application, 2012-2026
3.2.1. Manufacturing Market Size and Forecast, 2012-2026
3.2.1.1. Revenue (US$ Mn) Comparison, By Region
3.2.1.2. Market Share Comparison, By Region
3.2.1.3. Y-o-Y growth Comparison, By Region
3.2.2. Construction Market Size and Forecast, 2012-2026
3.2.2.1. Revenue (US$ Mn) Comparison, By Region
3.2.2.2. Market Share Comparison, By Region
3.2.2.3. Y-o-Y growth Comparison, By Region
3.2.3. Oil & Gas Market Size and Forecast, 2012-2026
3.2.3.1. Revenue (US$ Mn) Comparison, By Region
3.2.3.2. Market Share Comparison, By Region
3.2.3.3. Y-o-Y growth Comparison, By Region
3.2.4. Transportation Market Size and Forecast, 2012-2026
3.2.4.1. Revenue (US$ Mn) Comparison, By Region
3.2.4.2. Market Share Comparison, By Region
3.2.4.3. Y-o-Y growth Comparison, By Region
3.2.5. Pharmaceuticals Market Size and Forecast, 2012-2026
3.2.5.1. Revenue (US$ Mn) Comparison, By Region
3.2.5.2. Market Share Comparison, By Region
3.2.5.3. Y-o-Y growth Comparison, By Region
3.2.6. Chemicals Market Size and Forecast, 2012-2026
3.2.6.1. Revenue (US$ Mn) Comparison, By Region
3.2.6.2. Market Share Comparison, By Region
3.2.6.3. Y-o-Y growth Comparison, By Region
3.2.7. Food & Beverages Market Size and Forecast, 2012-2026
3.2.7.1. Revenue (US$ Mn) Comparison, By Region
3.2.7.2. Market Share Comparison, By Region
3.2.7.3. Y-o-Y growth Comparison, By Region
3.2.8. Mining Market Size and Forecast, 2012-2026
3.2.8.1. Revenue (US$ Mn) Comparison, By Region
3.2.8.2. Market Share Comparison, By Region
3.2.8.3. Y-o-Y growth Comparison, By Region
3.2.9. Others Market Size and Forecast, 2012-2026
3.2.9.1. Revenue (US$ Mn) Comparison, By Region
3.2.9.2. Market Share Comparison, By Region
3.2.9.3. Y-o-Y growth Comparison, By Region
3.3. Global Head Protection Equipment Market Size and Forecast By Sales Channel, 2012-2026
3.3.1. Direct (B2B) Sales Market Size and Forecast, 2012-2026
3.3.1.1. Revenue (US$ Mn) Comparison, By Region
3.3.1.2. Market Share Comparison, By Region
3.3.1.3. Y-o-Y growth Comparison, By Region
3.3.2. Distributors Market Size and Forecast, 2012-2026
3.3.2.1. Revenue (US$ Mn) Comparison, By Region
3.3.2.2. Market Share Comparison, By Region
3.3.2.3. Y-o-Y growth Comparison, By Region
4. North America Head Protection Equipment Market Size and Forecast, 2012-2026
4.1. Revenue (US$ Mn) Comparison, By Country
4.2. Revenue (US$ Mn) Comparison, By Product Type
4.3. Revenue (US$ Mn) Comparison, By Application
4.4. Revenue (US$ Mn) Comparison, By Sales Channel
5. Latin America Head Protection Equipment Market Size and Forecast, 2012-2026
5.1. Revenue (US$ Mn) Comparison, By Country
5.2. Revenue (US$ Mn) Comparison, By Product Type
5.3. Revenue (US$ Mn) Comparison, By Application
5.4. Revenue (US$ Mn) Comparison, By Sales Channel
6. Europe Head Protection Equipment Market Size and Forecast, 2012-2026
6.1. Revenue (US$ Mn) Comparison, By Country
6.2. Revenue (US$ Mn) Comparison, By Product Type
6.3. Revenue (US$ Mn) Comparison, By Application
6.4. Revenue (US$ Mn) Comparison, By Sales Channel
7. Japan Head Protection Equipment Market Size and Forecast, 2012-2026
7.1. Revenue (US$ Mn) Comparison, By Country
7.2. Revenue (US$ Mn) Comparison, By Product Type
7.3. Revenue (US$ Mn) Comparison, By Application
7.4. Revenue (US$ Mn) Comparison, By Sales Channel
8. APEJ Head Protection Equipment Market Size and Forecast, 2012-2026
8.1. Revenue (US$ Mn) Comparison, By Country
8.2. Revenue (US$ Mn) Comparison, By Product Type
8.3. Revenue (US$ Mn) Comparison, By Application
8.4. Revenue (US$ Mn) Comparison, By Sales Channel
9. MEA Head Protection Equipment Market Size and Forecast, 2012-2026
9.1. Revenue (US$ Mn) Comparison, By Country
9.2. Revenue (US$ Mn) Comparison, By Product Type
9.3. Revenue (US$ Mn) Comparison, By Application
9.4. Revenue (US$ Mn) Comparison, By Sales Channel
10. Global Head Protection Equipment Market Company Share, Competition Landscape and Company Profiles
10.1. Company Share Analysis
10.2. Competition Landscape
10.3. Company Profiles
10.3.1. 3M Company
10.3.2. E. I. du Pont de Nemours and Company
10.3.3. Honeywell International Inc.
10.3.4. Bullard
10.3.5. MSA
10.3.6. Lakeland Industries, Inc.
10.3.7. Uvex Group
10.3.8. Centurion Safety EU
10.3.9. Ergodyne Corporation
10.3.10. Cintas Corporation
11. Research Methodology
12. Secondary and Primary Sources
13. Assumptions and Acronyms
14. Disclaimer
List of Tables
TABLE 1 Global Head Protection Equipment Market Value (US$ Mn), 2012-2017
TABLE 2 Global Head Protection Equipment Market Value (US$ Mn), 2018-2026
TABLE 3 Global Head Protection Equipment Market Value (US$ Mn) and Y-o-Y, 2017-2026
TABLE 4 Global Class A Helmet Segment Value (US$ Mn), By Region 2012-2017
TABLE 5 Global Class A Helmet Segment Value (US$ Mn), By Region 2018-2026
TABLE 6 Global Class A Helmet Segment Market Share, By Region 2012-2017
TABLE 7 Global Class A Helmet Segment Market Share, By Region 2018-2026
TABLE 8 Global Class A Helmet Segment Y-o-Y, By Region 2017-2026
TABLE 9 Global Class B Helmet Segment Value (US$ Mn), By Region 2012-2017
TABLE 10 Global Class B Helmet Segment Value (US$ Mn), By Region 2018-2026
TABLE 11 Global Class B Helmet Segment Market Share, By Region 2012-2017
TABLE 12 Global Class B Helmet Segment Market Share, By Region 2018-2026
TABLE 13 Global Class B Helmet Segment Y-o-Y, By Region 2017-2026
TABLE 14 Global Class C Helmet Segment Value (US$ Mn), By Region 2012-2017
TABLE 15 Global Class C Helmet Segment Value (US$ Mn), By Region 2018-2026
TABLE 16 Global Class C Helmet Segment Market Share, By Region 2012-2017
TABLE 17 Global Class C Helmet Segment Market Share, By Region 2018-2026
TABLE 18 Global Class C Helmet Segment Y-o-Y, By Region 2017-2026
TABLE 19 Global Manufacturing Segment Value (US$ Mn), By Region 2012-2017
TABLE 20 Global Manufacturing Segment Value (US$ Mn), By Region 2018-2026
TABLE 21 Global Manufacturing Segment Market Share, By Region 2012-2017
TABLE 22 Global Manufacturing Segment Market Share, By Region 2018-2026
TABLE 23 Global Manufacturing Segment Y-o-Y, By Region 2017-2026
TABLE 24 Global Construction Segment Value (US$ Mn), By Region 2012-2017
TABLE 25 Global Construction Segment Value (US$ Mn), By Region 2018-2026
TABLE 26 Global Construction Segment Market Share, By Region 2012-2017
TABLE 27 Global Construction Segment Market Share, By Region 2018-2026
TABLE 28 Global Construction Segment Y-o-Y, By Region 2017-2026
TABLE 29 Global Oil & Gas Segment Value (US$ Mn), By Region 2012-2017
TABLE 30 Global Oil & Gas Segment Value (US$ Mn), By Region 2018-2026
TABLE 31 Global Oil & Gas Segment Market Share, By Region 2012-2017
TABLE 32 Global Oil & Gas Segment Market Share, By Region 2018-2026
TABLE 33 Global Oil & Gas Segment Y-o-Y, By Region 2017-2026
TABLE 34 Global Transportation Segment Value (US$ Mn), By Region 2012-2017
TABLE 35 Global Transportation Segment Value (US$ Mn), By Region 2018-2026
TABLE 36 Global Transportation Segment Market Share, By Region 2012-2017
TABLE 37 Global Transportation Segment Market Share, By Region 2018-2026
TABLE 38 Global Transportation Segment Y-o-Y, By Region 2017-2026
TABLE 39 Global Pharmaceuticals Segment Value (US$ Mn), By Region 2012-2017
TABLE 40 Global Pharmaceuticals Segment Value (US$ Mn), By Region 2018-2026
TABLE 41 Global Pharmaceuticals Segment Market Share, By Region 2012-2017
TABLE 42 Global Pharmaceuticals Segment Market Share, By Region 2018-2026
TABLE 43 Global Pharmaceuticals Segment Y-o-Y, By Region 2017-2026
TABLE 44 Global Chemicals Segment Value (US$ Mn), By Region 2012-2017
TABLE 45 Global Chemicals Segment Value (US$ Mn), By Region 2018-2026
TABLE 46 Global Chemicals Segment Market Share, By Region 2012-2017
TABLE 47 Global Chemicals Segment Market Share, By Region 2018-2026
TABLE 48 Global Chemicals Segment Y-o-Y, By Region 2017-2026
TABLE 49 Global Food & Beverages Segment Value (US$ Mn), By Region 2012-2017
TABLE 50 Global Food & Beverages Segment Value (US$ Mn), By Region 2018-2026
TABLE 51 Global Food & Beverages Segment Market Share, By Region 2012-2017
TABLE 52 Global Food & Beverages Segment Market Share, By Region 2018-2026
TABLE 53 Global Food & Beverages Segment Y-o-Y, By Region 2017-2026
TABLE 54 Global Mining Segment Value (US$ Mn), By Region 2012-2017
TABLE 55 Global Mining Segment Value (US$ Mn), By Region 2018-2026
TABLE 56 Global Mining Segment Market Share, By Region 2012-2017
TABLE 57 Global Mining Segment Market Share, By Region 2018-2026
TABLE 58 Global Mining Segment Y-o-Y, By Region 2017-2026
TABLE 59 Global Others Segment Value (US$ Mn), By Region 2012-2017
TABLE 60 Global Others Segment Value (US$ Mn), By Region 2018-2026
TABLE 61 Global Others Segment Market Share, By Region 2012-2017
TABLE 62 Global Others Segment Market Share, By Region 2018-2026
TABLE 63 Global Others Segment Y-o-Y, By Region 2017-2026
TABLE 64 Global Direct (B2B) Sales Segment Value (US$ Mn), By Region 2012-2017
TABLE 65 Global Direct (B2B) Sales Segment Value (US$ Mn), By Region 2018-2026
TABLE 66 Global Direct (B2B) Sales Segment Market Share, By Region 2012-2017
TABLE 67 Global Direct (B2B) Sales Segment Market Share, By Region 2018-2026
TABLE 68 Global Direct (B2B) Sales Segment Y-o-Y, By Region 2017-2026
TABLE 69 Global Distributors Segment Value (US$ Mn), By Region 2012-2017
TABLE 70 Global Distributors Segment Value (US$ Mn), By Region 2018-2026
TABLE 71 Global Distributors Segment Market Share, By Region 2012-2017
TABLE 72 Global Distributors Segment Market Share, By Region 2018-2026
TABLE 73 Global Distributors Segment Y-o-Y, By Region 2017-2026
TABLE 74 North America Head Protection Equipment Market Value (US$ Mn), By Country 2012-2017
TABLE 75 North America Head Protection Equipment Market Value (US$ Mn), By Country 2018-2026
TABLE 76 North America Head Protection Equipment Market Value (US$ Mn), By Product Type 2012-2017
TABLE 77 North America Head Protection Equipment Market Value (US$ Mn), By Product Type 2018-2026
TABLE 78 North America Head Protection Equipment Market Value (US$ Mn), By Application2012-2017
TABLE 79 North America Head Protection Equipment Market Value (US$ Mn), By Application2018-2026
TABLE 80 North America Head Protection Equipment Market Value (US$ Mn), By Sales Channel 2012-2017
TABLE 81 North America Head Protection Equipment Market Value (US$ Mn), By Sales Channel 2018-2026
TABLE 82 Latin America Head Protection Equipment Market Value (US$ Mn), By Country 2012-2017
TABLE 83 Latin America Head Protection Equipment Market Value (US$ Mn), By Country 2018-2026
TABLE 84 Latin America Head Protection Equipment Market Value (US$ Mn), By Product Type 2012-2017
TABLE 85 Latin America Head Protection Equipment Market Value (US$ Mn), By Product Type 2018-2026
TABLE 86 Latin America Head Protection Equipment Market Value (US$ Mn), By Application2012-2017
TABLE 87 Latin America Head Protection Equipment Market Value (US$ Mn), By Application2018-2026
TABLE 88 Latin America Head Protection Equipment Market Value (US$ Mn), By Sales Channel 2012-2017
TABLE 89 Latin America Head Protection Equipment Market Value (US$ Mn), By Sales Channel 2018-2026
TABLE 90 Europe Head Protection Equipment Market Value (US$ Mn), By Country 2012-2017
TABLE 91 Europe Head Protection Equipment Market Value (US$ Mn), By Country 2018-2026
TABLE 92 Europe Head Protection Equipment Market Value (US$ Mn), By Product Type 2012-2017
TABLE 93 Europe Head Protection Equipment Market Value (US$ Mn), By Product Type 2018-2026
TABLE 94 Europe Head Protection Equipment Market Value (US$ Mn), By Application2012-2017
TABLE 95 Europe Head Protection Equipment Market Value (US$ Mn), By Application2018-2026
TABLE 96 Europe Head Protection Equipment Market Value (US$ Mn), By Sales Channel 2012-2017
TABLE 97 Europe Head Protection Equipment Market Value (US$ Mn), By Sales Channel 2018-2026
TABLE 98 Japan Head Protection Equipment Market Value (US$ Mn), By Country 2012-2017
TABLE 99 Japan Head Protection Equipment Market Value (US$ Mn), By Country 2018-2026
TABLE 100 Japan Head Protection Equipment Market Value (US$ Mn), By Product Type 2012-2017
TABLE 101 Japan Head Protection Equipment Market Value (US$ Mn), By Product Type 2018-2026
TABLE 102 Japan Head Protection Equipment Market Value (US$ Mn), By Application2012-2017
TABLE 103 Japan Head Protection Equipment Market Value (US$ Mn), By Application2018-2026
TABLE 104 Japan Head Protection Equipment Market Value (US$ Mn), By Sales Channel 2012-2017
TABLE 105 Japan Head Protection Equipment Market Value (US$ Mn), By Sales Channel 2018-2026
TABLE 106 APEJ Head Protection Equipment Market Value (US$ Mn), By Country 2012-2017
TABLE 107 APEJ Head Protection Equipment Market Value (US$ Mn), By Country 2018-2026
TABLE 108 APEJ Head Protection Equipment Market Value (US$ Mn), By Product Type 2012-2017
TABLE 109 APEJ Head Protection Equipment Market Value (US$ Mn), By Product Type 2018-2026
TABLE 110 APEJ Head Protection Equipment Market Value (US$ Mn), By Application2012-2017
TABLE 111 APEJ Head Protection Equipment Market Value (US$ Mn), By Application2018-2026
TABLE 112 APEJ Head Protection Equipment Market Value (US$ Mn), By Sales Channel 2012-2017
TABLE 113 APEJ Head Protection Equipment Market Value (US$ Mn), By Sales Channel 2018-2026
TABLE 114 MEA Head Protection Equipment Market Value (US$ Mn), By Country 2012-2017
TABLE 115 MEA Head Protection Equipment Market Value (US$ Mn), By Country 2018-2026
TABLE 116 MEA Head Protection Equipment Market Value (US$ Mn), By Product Type 2012-2017
TABLE 117 MEA Head Protection Equipment Market Value (US$ Mn), By Product Type 2018-2026
TABLE 118 MEA Head Protection Equipment Market Value (US$ Mn), By Application2012-2017
TABLE 119 MEA Head Protection Equipment Market Value (US$ Mn), By Application2018-2026
TABLE 120 MEA Head Protection Equipment Market Value (US$ Mn), By Sales Channel 2012-2017
TABLE 121 MEA Head Protection Equipment Market Value (US$ Mn), By Sales Channel 2018-2026
List of Figures
FIG. 1 Global Head Protection Equipment Market Value (US$ Mn), 2012-2017
FIG. 2 Global Head Protection Equipment Market Value (US$ Mn) Forecast, 2018-2026
FIG. 3 Global Head Protection Equipment Market Value (US$ Mn) and Y-o-Y, 2017-2026
FIG. 4 Global Class A Helmet Segment Market Value (US$ Mn) By Region, 2012-2017
FIG. 5 Global Class A Helmet Segment Market Value (US$ Mn) By Region, 2018-2026
FIG. 6 Global Class A Helmet Segment Y-o-Y Growth Rate, By Region, 2017-2026
FIG. 7 Global Class B Helmet Segment Market Value (US$ Mn) By Region, 2012-2017
FIG. 8 Global Class B Helmet Segment Market Value (US$ Mn) By Region, 2018-2026
FIG. 9 Global Class B Helmet Segment Y-o-Y Growth Rate, By Region, 2017-2026
FIG. 10 Global Class C Helmet Segment Market Value (US$ Mn) By Region, 2012-2017
FIG. 11 Global Class C Helmet Segment Market Value (US$ Mn) By Region, 2018-2026
FIG. 12 Global Class C Helmet Segment Y-o-Y Growth Rate, By Region, 2017-2026
FIG. 13 Global Manufacturing Segment Market Value (US$ Mn) By Region, 2012-2017
FIG. 14 Global Manufacturing Segment Market Value (US$ Mn) By Region, 2018-2026
FIG. 15 Global Manufacturing Segment Y-o-Y Growth Rate, By Region, 2017-2026
FIG. 16 Global Construction Segment Market Value (US$ Mn) By Region, 2012-2017
FIG. 17 Global Construction Segment Market Value (US$ Mn) By Region, 2018-2026
FIG. 18 Global Construction Segment Y-o-Y Growth Rate, By Region, 2017-2026
FIG. 19 Global Oil & Gas Segment Market Value (US$ Mn) By Region, 2012-2017
FIG. 20 Global Oil & Gas Segment Market Value (US$ Mn) By Region, 2018-2026
FIG. 21 Global Oil & Gas Segment Y-o-Y Growth Rate, By Region, 2017-2026
FIG. 22 Global Transportation Segment Market Value (US$ Mn) By Region, 2012-2017
FIG. 23 Global Transportation Segment Market Value (US$ Mn) By Region, 2018-2026
FIG. 24 Global Transportation Segment Y-o-Y Growth Rate, By Region, 2017-2026
FIG. 25 Global Pharmaceuticals Segment Market Value (US$ Mn) By Region, 2012-2017
FIG. 26 Global Pharmaceuticals Segment Market Value (US$ Mn) By Region, 2018-2026
FIG. 27 Global Pharmaceuticals Segment Y-o-Y Growth Rate, By Region, 2017-2026
FIG. 28 Global Chemicals Segment Market Value (US$ Mn) By Region, 2012-2017
FIG. 29 Global Chemicals Segment Market Value (US$ Mn) By Region, 2018-2026
FIG. 30 Global Chemicals Segment Y-o-Y Growth Rate, By Region, 2017-2026
FIG. 31 Global Food & Beverages Segment Market Value (US$ Mn) By Region, 2012-2017
FIG. 32 Global Food & Beverages Segment Market Value (US$ Mn) By Region, 2018-2026
FIG. 33 Global Food & Beverages Segment Y-o-Y Growth Rate, By Region, 2017-2026
FIG. 34 Global Mining Segment Market Value (US$ Mn) By Region, 2012-2017
FIG. 35 Global Mining Segment Market Value (US$ Mn) By Region, 2018-2026
FIG. 36 Global Mining Segment Y-o-Y Growth Rate, By Region, 2017-2026
FIG. 37 Global Others Segment Market Value (US$ Mn) By Region, 2012-2017
FIG. 38 Global Others Segment Market Value (US$ Mn) By Region, 2018-2026
FIG. 39 Global Others Segment Y-o-Y Growth Rate, By Region, 2017-2026
FIG. 40 Global Direct (B2B) Sales Segment Market Value (US$ Mn) By Region, 2012-2017
FIG. 41 Global Direct (B2B) Sales Segment Market Value (US$ Mn) By Region, 2018-2026
FIG. 42 Global Direct (B2B) Sales Segment Y-o-Y Growth Rate, By Region, 2017-2026
FIG. 43 Global Distributors Segment Market Value (US$ Mn) By Region, 2012-2017
FIG. 44 Global Distributors Segment Market Value (US$ Mn) By Region, 2018-2026
FIG. 45 Global Distributors Segment Y-o-Y Growth Rate, By Region, 2017-2026
FIG. 46 North America Head Protection Equipment Market Value (US$ Mn), By Country 2012-2017
FIG. 47 North America Head Protection Equipment Market Value (US$ Mn), By Country 2018-2026
FIG. 48 North America Head Protection Equipment Market Value (US$ Mn), By Product Type 2012-2017
FIG. 49 North America Head Protection Equipment Market Value (US$ Mn), By Product Type 2018-2026
FIG. 50 North America Head Protection Equipment Market Value (US$ Mn), By Application2012-2017
FIG. 51 North America Head Protection Equipment Market Value (US$ Mn), By Application2018-2026
FIG. 52 North America Head Protection Equipment Market Value (US$ Mn), By Sales Channel 2012-2017
FIG. 53 North America Head Protection Equipment Market Value (US$ Mn), By Sales Channel 2018-2026
FIG. 54 Latin America Head Protection Equipment Market Value (US$ Mn), By Country 2012-2017
FIG. 55 Latin America Head Protection Equipment Market Value (US$ Mn), By Country 2018-2026
FIG. 56 Latin America Head Protection Equipment Market Value (US$ Mn), By Product Type 2012-2017
FIG. 57 Latin America Head Protection Equipment Market Value (US$ Mn), By Product Type 2018-2026
FIG. 58 Latin America Head Protection Equipment Market Value (US$ Mn), By Application2012-2017
FIG. 59 Latin America Head Protection Equipment Market Value (US$ Mn), By Application2018-2026
FIG. 60 Latin America Head Protection Equipment Market Value (US$ Mn), By Sales Channel 2012-2017
FIG. 61 Latin America Head Protection Equipment Market Value (US$ Mn), By Sales Channel 2018-2026
FIG. 62 Europe Head Protection Equipment Market Value (US$ Mn), By Country 2012-2017
FIG. 63 Europe Head Protection Equipment Market Value (US$ Mn), By Country 2018-2026
FIG. 64 Europe Head Protection Equipment Market Value (US$ Mn), By Product Type 2012-2017
FIG. 65 Europe Head Protection Equipment Market Value (US$ Mn), By Product Type 2018-2026
FIG. 66 Europe Head Protection Equipment Market Value (US$ Mn), By Application2012-2017
FIG. 67 Europe Head Protection Equipment Market Value (US$ Mn), By Application2018-2026
FIG. 68 Europe Head Protection Equipment Market Value (US$ Mn), By Sales Channel 2012-2017
FIG. 69 Europe Head Protection Equipment Market Value (US$ Mn), By Sales Channel 2018-2026
FIG. 70 Japan Head Protection Equipment Market Value (US$ Mn), By Country 2012-2017
FIG. 71 Japan Head Protection Equipment Market Value (US$ Mn), By Country 2018-2026
FIG. 72 Japan Head Protection Equipment Market Value (US$ Mn), By Product Type 2012-2017
FIG. 73 Japan Head Protection Equipment Market Value (US$ Mn), By Product Type 2018-2026
FIG. 74 Japan Head Protection Equipment Market Value (US$ Mn), By Sales Channel 2012-2017
FIG. 75 Japan Head Protection Equipment Market Value (US$ Mn), By Application2018-2026
FIG. 76 Japan Head Protection Equipment Market Value (US$ Mn), By Sales Channel 2012-2017
FIG. 77 Japan Head Protection Equipment Market Value (US$ Mn), By Sales Channel 2018-2026
FIG. 78 APEJ Head Protection Equipment Market Value (US$ Mn), By Country 2012-2017
FIG. 79 APEJ Head Protection Equipment Market Value (US$ Mn), By Country 2018-2026
FIG. 80 APEJ Head Protection Equipment Market Value (US$ Mn), By Product Type 2012-2017
FIG. 81 APEJ Head Protection Equipment Market Value (US$ Mn), By Product Type 2018-2026
FIG. 82 APEJ Head Protection Equipment Market Value (US$ Mn), By Application2012-2017
FIG. 83 APEJ Head Protection Equipment Market Value (US$ Mn), By Application2018-2026
FIG. 84 APEJ Head Protection Equipment Market Value (US$ Mn), By Sales Channel 2012-2017
FIG. 85 APEJ Head Protection Equipment Market Value (US$ Mn), By Sales Channel 2018-2026
FIG. 86 MEA Head Protection Equipment Market Value (US$ Mn), By Country 2012-2017
FIG. 87 MEA Head Protection Equipment Market Value (US$ Mn), By Country 2018-2026
FIG. 88 MEA Head Protection Equipment Market Value (US$ Mn), By Product Type 2012-2017
FIG. 89 MEA Head Protection Equipment Market Value (US$ Mn), By Product Type 2018-2026
FIG. 90 MEA Head Protection Equipment Market Value (US$ Mn), By Application2012-2017
FIG. 91 MEA Head Protection Equipment Market Value (US$ Mn), By Application2018-2026
FIG. 92 MEA Head Protection Equipment Market Value (US$ Mn), By Sales Channel 2012-2017
FIG. 93 MEA Head Protection Equipment Market Value (US$ Mn), By Sales Channel 2018-2026
Copyright © Transparency Market Research, Inc. All Rights reserved
Trust Online

Head Protection Equipment Market