
Reports
Reports
There is a growing demand for handheld imaging devices in dentistry and orthopedics. As such, X-ray/fluoroscopic scanners product segment of the handheld imaging devices market is estimated to reach a value of ~US$ 1.2 Bn by the end of 2027. Hence, companies are innovating in advanced X-ray systems that overcome limitations of conventional wall-mount units. For instance, German-based dental products manufacturer KaVo Dental announced the launch of NOMAD™ Pro 2- a unique handheld X-ray system, which is available for routine dental purposes.
Advanced handheld X-ray systems are gradually becoming mainstream in most dentistry clinics. Companies in the handheld imaging devices market are focusing on the needs of clinicians so that dentists gain reliability through these systems during busy dental office needs and appreciates. They are increasing their efficacy in technologies that enhance the safety and portability of these systems. Companies in the handheld imaging devices market are introducing X-ray systems with high-capacity battery technology.
According to Engineering for Change, an online platform that solves global development problems, suggests that oral cancer is among the top three cancers diagnosed in India. High prevalence of oral cancer in India led companies in the handheld imaging devices market to develop innovative equipment. For instance, Sascan Meditech-a Bengaluru-based optical imaging technology company, revealed that the company’s device OralScan built with multi-modal imaging camera is undergoing clinical trials.
Healthcare companies in the market for handheld imaging devices are tapping opportunities in software and data analytics to improve patient outcomes. Medical device startups are participating in innovation trade fairs to bolster their credibility credentials in the global handheld imaging devices market. They are augmenting the advantages of cloud to help circulate the captured data among clinicians. Machine learning is also gaining prominence in the global market landscape, since algorithms provide feed on ratio values to assess differences between the types of cancer in patients.
There is a growing demand for lightweight and portable scanners that perform whole-brain MRI scan for patients with mobility challenges in the handheld imaging devices market. For instance, researchers at the Massachusetts Institute of Technology, Cambridge, developed a cost-effective portable helmet-like scanner that offers promising abilities than conventional MRI systems.
Optical imaging devices product segment of the handheld imaging devices market is projected to reach a value of ~US$ 800 Mn by 2027. Hence, companies in the market for handheld imaging devices are exploring opportunities in optical imaging devices to cater to specific needs of patients.
Innovations in these devices are likely to offer diagnostic-quality images that improve patient quality of life. However, challenges in imaging artefacts during the development of uniform magnetic field for image coding poses as restraint for researchers and manufacturers. Hence, companies in the market for handheld imaging devices should collaborate with researchers to use more flexible image coding approach to generate images with fewer artefacts.
Clinicians operating in the field of dermatology are eyeing alternatives that offer cost-efficiency and enhance the workflow at clinics. With the introduction of new handheld imaging devices, dermatologists are increasingly relying on smarter ways to perform skin examinations. For instance, Barco, a Belgian technology company specializing in digital image projection is increasing awareness about its product Demetra that provides intelligent and augmented insights.
Innovations in handheld imaging devices are serving as affordable and accessible solutions in skin lesion screening. As such, dermatology application segment of the handheld imaging devices market is anticipated to reach a value of ~US$ 600 Mn by 2027. Hence, companies are gaining expertise in multispectral digital imaging technology to improve efficiency in skin examinations.
The uptake of handheld imaging devices in dermatology is soaring, since dermatologists chart lesions on mannequins or through clinical overview photographs. Thus, companies in the handheld imaging devices market are helping dermatologists to boost their professional credibility by increasing the availability of technologically sound devices.
Analysts’ Viewpoint
Ergonomic design innovations are boosting the sales of handheld imaging devices in dentistry, owing to better weight dispersion and stability in the palm. Companies in the handheld imaging devices market are developing equipment with LEDs and monochrome cameras to provide early detection of oral cancer.
Pitfalls of handheld devices involve heavy weight of these devices that affect the productivity of clinicians. Hence, companies should gain knowledge about ergonomics to design devices that reduce fatigue among users. They should develop devices that alleviate the hassle of switching between cameras or lenses during close-up or clinical overview pictures taken at the time of skin examinations.
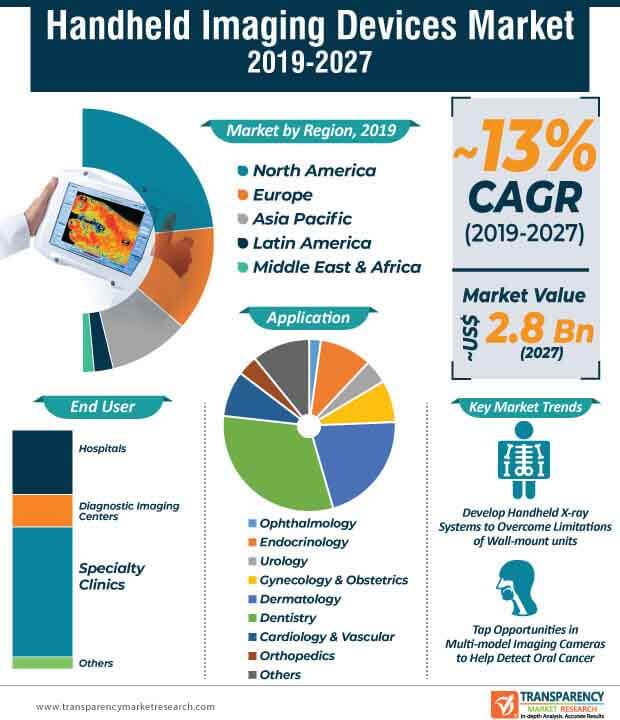
Handheld imaging devices market to reach a valuation of ~US$ 2.8 Bn by 2027
Handheld imaging devices market is expected to expand at a CAGR of ~13% from 2019 to 2027
Handheld imaging devices market is driven by rise in number of approved handheld imaging devices by different regulatory authorities across the world
The end-use segments in handheld imaging devices market are hospitals, diagnostic imaging centers, specialty clinics, and others
Key players analyzed in this report include GE Healthcare (GE Electric Company), Koninklijke Philips N.V., Siemens Healthineers, FUJIFILM Corporation, Micro C.
1. Preface
1.1. Market Definition and Scope
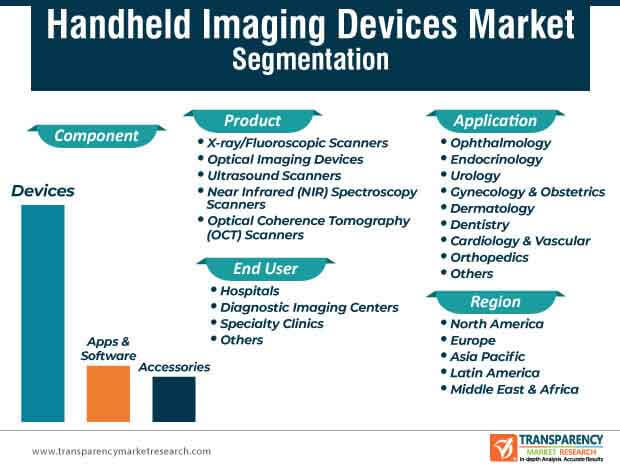
1.2. Market Segmentation
1.3. Key Research Objectives
1.4. Research Highlights
2. Assumptions and Research Methodology
3. Executive Summary : Global Handheld Imaging Devices Market
4. Market Overview
4.1. Introduction
4.1.1. Product Definition
4.2. Overview
4.3. Market Dynamics
4.3.1. Drivers
4.3.2. Restraints
4.3.3. Opportunities
4.4. Global Handheld Imaging Devices Market Analysis and Forecast, 2017–2027
4.4.1. Market Revenue Projections (US$ Mn)
5. Market Outlook
5.1. Key Industry Events (Acquisitions, Mergers, Collaborations, Product Launches, etc.)
5.2. Regulatory Scenario by Region/globally
5.3. Disease Prevalence & Incidence Rate globally with key countries
6. Global Handheld Imaging Devices Market Analysis and Forecast, by Product
6.1. Introduction & Definition
6.2. Key Findings / Developments
6.3. Global Handheld Imaging Devices Market Value Forecast, by Product, 2017–2027
6.3.1. X-ray/Fluoroscopic Scanners
6.3.2. Optical Imaging Devices
6.3.3. Ultrasound Scanners
6.3.4. Near Infrared(NIR) Spectroscopy Scanners
6.3.5. Optical Coherence Tomography(OCT) Scanners
6.4. Global Handheld Imaging Devices Market Attractiveness, by Product, 2019?2027
7. Global Handheld Imaging Devices Market Analysis and Forecast, by Component
7.1. Introduction & Definition
7.2. Key Findings / Developments
7.3. Global Handheld Imaging Devices Market Value Forecast, by Component, 2017–2027
7.3.1. Devices
7.3.2. Apps & Software
7.3.3. Accessories
7.4. Global Handheld Imaging Devices Market Attractiveness, by Component, 2019?2027
8. Global Handheld Imaging Devices Market Analysis and Forecast, by Application
8.1. Introduction & Definition
8.2. Key Findings / Developments
8.3. Global Handheld Imaging Devices Market Value Forecast, by Application, 2017–2027
8.3.1. Ophthalmology
8.3.2. Endocrinology
8.3.3. Urology
8.3.4. Gynecology & Obstetrics
8.3.5. Dermatology
8.3.6. Dentistry
8.3.7. Cardiology and Vascular
8.3.8. Orthopedics
8.3.9. Others
8.4. Global Handheld Imaging Devices Market Attractiveness, by Application, 2019?2027
9. Global Handheld Imaging Devices Market Analysis and Forecast, by End-user
9.1. Introduction & Definition
9.2. Key Findings / Developments
9.3. Global Handheld Imaging Devices Market Value Forecast, by End-user, 2017–2027
9.3.1. Hospitals
9.3.2. Diagnostic Imaging Centers
9.3.3. Specialty Clinics
9.3.4. Others
9.4. Global Handheld Imaging Devices Market Attractiveness, by End-user, 2019?2027
10. Global Handheld Imaging Devices Market Analysis and Forecast, by Region
10.1. Key Findings
10.2. Global Handheld Imaging Devices Market Value Forecast, by Region
10.2.1. North America
10.2.2. Europe
10.2.3. Asia Pacific
10.2.4. Latin America
10.2.5. Middle East & Africa
10.3. Global Handheld Imaging Devices Market Attractiveness, by Country/Region, 2019?2027
11. North America Handheld Imaging Devices Market Analysis and Forecast
11.1. Introduction
11.1.1. Key Findings
11.2. North America Handheld Imaging Devices Market Value Forecast, by Product, 2017–2027
11.2.1. X-ray/Fluoroscopic Scanners
11.2.2. Optical Imaging Devices
11.2.3. Ultrasound Scanners
11.2.4. Near Infrared (NIR) Spectroscopy Scanners
11.2.5. Optical Coherence Tomography (OCT) Scanners
11.3. North America Handheld Imaging Devices Market Value Forecast, by Component, 2017–2027
11.3.1. Devices
11.3.2. Apps & Software
11.3.3. Accessories
11.4. North America Handheld Imaging Devices Market Value Forecast, by Application, 2017–2027
11.4.1. Ophthalmology
11.4.2. Endocrinology
11.4.3. Urology
11.4.4. Gynecology & Obstetrics
11.4.5. Dermatology
11.4.6. Dentistry
11.4.7. Cardiology and Vascular
11.4.8. Orthopedics
11.4.9. Others
11.5. North America Handheld Imaging Devices Market Value Forecast, by End-user, 2017–2027
11.5.1. Hospitals
11.5.2. Diagnostic Imaging Centers
11.5.3. Specialty Clinics
11.5.4. Others
11.6. North America Handheld Imaging Devices Market Value Forecast, by Country, 2017–2027
11.6.1. U.S.
11.6.2. Canada
11.7. North America Handheld Imaging Devices Market Attractiveness Analysis, 2019?2027
11.7.1. By Product
11.7.2. By Component
11.7.3. By Application
11.7.4. By End-user
11.7.5. By Country
12. Europe Handheld Imaging Devices Market Analysis and Forecast
12.1. Introduction
12.1.1. Key Findings
12.2. Europe Handheld Imaging Devices Market Value Forecast, by Product, 2017–2027
12.2.1. X-ray/Fluoroscopic Scanners
12.2.2. Optical Imaging Devices
12.2.3. Ultrasound Scanners
12.2.4. Near Infrared (NIR) Spectroscopy Scanners
12.2.5. Optical Coherence Tomography (OCT) Scanners
12.3. Europe Handheld Imaging Devices Market Value Forecast, by Component, 2017–2027
12.3.1. Devices
12.3.2. Apps & Software
12.3.3. Accessories
12.4. Europe Handheld Imaging Devices Market Value Forecast, by Application, 2017–2027
12.4.1. Ophthalmology
12.4.2. Endocrinology
12.4.3. Urology
12.4.4. Gynecology & Obstetrics
12.4.5. Dermatology
12.4.6. Dentistry
12.4.7. Cardiology and Vascular
12.4.8. Orthopedics
12.4.9. Others
12.5. Europe Handheld Imaging Devices Market Value Forecast, by End-user, 2017–2027
12.5.1. Hospitals
12.5.2. Diagnostic Imaging Centers
12.5.3. Specialty Clinics
12.5.4. Others
12.6. Europe Handheld Imaging Devices Market Value Forecast, by Country/Sub-region, 2017–2027
12.6.1. Germany
12.6.2. U.K.
12.6.3. France
12.6.4. Spain
12.6.5. Italy
12.6.6. Rest of Europe
12.7. Europe Handheld Imaging Devices Market Attractiveness Analysis, 2019?2027
12.7.1. By Product
12.7.2. By Component
12.7.3. By Application
12.7.4. By End-user
12.7.5. By Country/Sub-region
13. Asia Pacific Handheld Imaging Devices Market Analysis and Forecast
13.1. Introduction
13.1.1. Key Findings
13.2. Asia Pacific Handheld Imaging Devices Market Value Forecast, by Product, 2017–2027
13.2.1. X-ray/Fluoroscopic Scanners
13.2.2. Optical Imaging Devices
13.2.3. Ultrasound Scanners
13.2.4. Near Infrared (NIR) Spectroscopy Scanners
13.2.5. Optical Coherence Tomography (OCT) Scanners
13.3. Asia Pacific Handheld Imaging Devices Market Value Forecast, by Component, 2017–2027
13.3.1. Devices
13.3.2. Apps & Software
13.3.3. Accessories
13.4. Asia Pacific Handheld Imaging Devices Market Value Forecast, by Application, 2017–2027
13.4.1. Ophthalmology
13.4.2. Endocrinology
13.4.3. Urology
13.4.4. Gynecology & Obstetrics
13.4.5. Dermatology
13.4.6. Dentistry
13.4.7. Cardiology and Vascular
13.4.8. Orthopedics
13.4.9. Others
13.5. Asia Pacific Handheld Imaging Devices Market Value Forecast, by End-user, 2017–2027
13.5.1. Hospitals
13.5.2. Diagnostic Imaging Centers
13.5.3. Specialty Clinics
13.5.4. Others
13.6. Asia Pacific Handheld Imaging Devices Market Value Forecast, by Country/Sub-region, 2017–2027
13.6.1. China
13.6.2. Japan
13.6.3. India
13.6.4. Australia & New Zealand
13.6.5. Rest of Asia Pacific
13.7. Asia Pacific Handheld Imaging Devices Market Attractiveness Analysis, 2019?2027
13.7.1. By Product
13.7.2. By Component
13.7.3. By Application
13.7.4. By End-user
13.7.5. By Country/Sub-region
14. Latin America Handheld Imaging Devices Market Analysis and Forecast
14.1. Introduction
14.1.1. Key Findings
14.2. Latin America Handheld Imaging Devices Market Value Forecast, by Product, 2017–2027
14.2.1. X-ray/Fluoroscopic Scanners
14.2.2. Optical Imaging Devices
14.2.3. Ultrasound Scanners
14.2.4. Near Infrared (NIR) Spectroscopy Scanners
14.2.5. Optical Coherence Tomography (OCT) Scanners
14.3. Latin America Handheld Imaging Devices Market Value Forecast, by Component, 2017–2027
14.3.1. Devices
14.3.2. Apps & Software
14.3.3. Accessories
14.4. Latin America Handheld Imaging Devices Market Value Forecast, by Application, 2017–2027
14.4.1. Ophthalmology
14.4.2. Endocrinology
14.4.3. Urology
14.4.4. Gynecology & Obstetrics
14.4.5. Dermatology
14.4.6. Dentistry
14.4.7. Cardiology and Vascular
14.4.8. Orthopedics
14.4.9. Others
14.5. Latin America Handheld Imaging Devices Market Value Forecast, by End-user, 2017–2027
14.5.1. Hospitals
14.5.2. Diagnostic Imaging Centers
14.5.3. Specialty Clinics
14.5.4. Others
14.6. Latin America Handheld Imaging Devices Market Value Forecast, by Country/Sub-region, 2017–2027
14.6.1. Brazil
14.6.2. Mexico
14.6.3. Rest of Latin America
14.7. Latin America Handheld Imaging Devices Market Attractiveness Analysis, 2019?2027
14.7.1. By Product
14.7.2. By Component
14.7.3. By Application
14.7.4. By End-user
14.7.5. By Country/Sub-region
15. Middle East & Africa Handheld Imaging Devices Market Analysis and Forecast
15.1. Introduction
15.1.1. Key Findings
15.2. Middle East & Africa Handheld Imaging Devices Market Value Forecast, by Product, 2017–2027
15.2.1. X-ray/Fluoroscopic Scanners
15.2.2. Optical Imaging Devices
15.2.3. Ultrasound Scanners
15.2.4. Near Infrared (NIR) Spectroscopy Scanners
15.2.5. Optical Coherence Tomography (OCT) Scanners
15.3. Middle East & Africa Handheld Imaging Devices Market Value Forecast, by Component, 2017–2027
15.3.1. Devices
15.3.2. Apps & Software
15.3.3. Accessories
15.4. Middle East & Africa Handheld Imaging Devices Market Value Forecast, by Application, 2017–2027
15.4.1. Ophthalmology
15.4.2. Endocrinology
15.4.3. Urology
15.4.4. Gynecology & Obstetrics
15.4.5. Dermatology
15.4.6. Dentistry
15.4.7. Cardiology and Vascular
15.4.8. Orthopedics
15.4.9. Others
15.5. Middle East & Africa Handheld Imaging Devices Market Value Forecast, by End-user, 2017–2027
15.5.1. Hospitals
15.5.2. Diagnostic Imaging Centers
15.5.3. Specialty Clinics
15.5.4. Others
15.6. Middle East & Africa Handheld Imaging Devices Market Value Forecast, by Country/Sub-region, 2017–2027
15.6.1. GCC Countries
15.6.2. South Africa
15.6.3. Rest of Middle East & Africa
15.7. Middle East & Africa Handheld Imaging Devices Market Attractiveness Analysis, 2019?2027
15.7.1. By Product
15.7.2. By Component
15.7.3. By Application
15.7.4. By End-user
15.7.5. By Country/Sub-region
16. Competition Landscape
16.1. Market Player – Competition Matrix (By Tier and Size of companies)
16.2. Market Share/Position Analysis, by Company (2018)
16.3. Company Profiles
16.3.1. GE Healthcare (GE Electric Company)
16.3.1.1. Company Overview (HQ, Business Segments, Employee Strength)
16.3.1.2. Company Financials
16.3.1.3. Growth Strategies
16.3.1.4. SWOT Analysis
16.3.2. Koninklijke Philips N.V.
16.3.2.1. Company Overview (HQ, Business Segments, Employee Strength)
16.3.2.2. Company Financials
16.3.2.3. Growth Strategies
16.3.2.4. SWOT Analysis
16.3.3. Siemens Healthineers
16.3.3.1. Company Overview (HQ, Business Segments, Employee Strength)
16.3.3.2. Company Financials
16.3.3.3. Growth Strategies
16.3.3.4. SWOT Analysis
16.3.4. FUJIFILM Corporation
16.3.4.1. Company Overview (HQ, Business Segments, Employee Strength)
16.3.4.2. Company Financials
16.3.4.3. Growth Strategies
16.3.4.4. SWOT Analysis
16.3.5. Micro C, LLC
16.3.5.1. Company Overview (HQ, Business Segments, Employee Strength)
16.3.5.2. Company Financials
16.3.5.3. Growth Strategies
16.3.5.4. SWOT Analysis
16.3.6. Butterfly Network, Inc.
16.3.6.1. Company Overview (HQ, Business Segments, Employee Strength)
16.3.6.2. Company Financials
16.3.6.3. Growth Strategies
16.3.6.4. SWOT Analysis
16.3.7. Clarius Mobile Health
16.3.7.1. Company Overview (HQ, Business Segments, Employee Strength)
16.3.7.2. Company Financials
16.3.7.3. Growth Strategies
16.3.7.4. SWOT Analysis
16.3.8. InfraScan, Inc.
16.3.8.1. Company Overview (HQ, Business Segments, Employee Strength)
16.3.8.2. Company Financials
16.3.8.3. Growth Strategies
16.3.8.4. SWOT Analysis
16.3.9. KaVo Dental
16.3.9.1. Company Overview (HQ, Business Segments, Employee Strength)
16.3.9.2. Company Financials
16.3.9.3. Growth Strategies
16.3.9.4. SWOT Analysis
16.3.10. MolecuLight, Inc.
16.3.10.1. Company Overview (HQ, Business Segments, Employee Strength)
16.3.10.2. Company Financials
16.3.10.3. Growth Strategies
16.3.10.4. SWOT Analysis
List of Tables
Table 01: Global Handheld Imaging Devices Market Value (US$ Mn) Forecast, by Product, 2017–2027
Table 02: Global Handheld Imaging Devices Market Value (US$ Mn) Forecast, by Component, 2017–2027
Table 03: Global Handheld Imaging Devices Market Value (US$ Mn) Forecast, by Application, 2017–2027
Table 04: Global Handheld Imaging Devices Market Value (US$ Mn) Forecast, by End-user, 2017–2027
Table 05: Global Handheld Imaging Devices Market Value (US$ Mn) Forecast, by Region, 2017–2027
Table 06: North America Handheld Imaging Devices Market Value (US$ Mn) Forecast, by Country, 2017–2027
Table 07: North America Handheld Imaging Devices Market Value (US$ Mn) Forecast, by Product, 2017–2027
Table 08: North America Handheld Imaging Devices Market Value (US$ Mn) Forecast, by Component, 2017–2027
Table 09: North America Handheld Imaging Devices Market Value (US$ Mn) Forecast, by Application, 2016–2026
Table 10: North America Handheld Imaging Devices Market Value (US$ Mn) Forecast, by End-user, 2017–2027
Table 11: Europe Handheld Imaging Devices Market Value (US$ Mn) Forecast, by Country/Sub-region, 2017–2027
Table 12: Europe Handheld Imaging Devices Market Value (US$ Mn) Forecast, by Product, 2017–2027
Table 13: Europe Handheld Imaging Devices Market Value (US$ Mn) Forecast, by Component, 2017–2027
Table 14: Europe Handheld Imaging Devices Market Value (US$ Mn) Forecast, by Application, 2016–2026
Table 15: Europe Handheld Imaging Devices Market Value (US$ Mn) Forecast, by End-user, 2017–2027
Table 16: Asia Pacific Handheld Imaging Devices Market Value (US$ Mn) Forecast, by Country/Sub-region, 2017–2027
Table 17: Asia Pacific Handheld Imaging Devices Market Value (US$ Mn) Forecast, by Product, 2017–2027
Table 18: Asia Pacific Handheld Imaging Devices Market Value (US$ Mn) Forecast, by Component, 2017–2027
Table 19: Asia Pacific Handheld Imaging Devices Market Value (US$ Mn) Forecast, by Application, 2016–2026
Table 20: Asia Pacific Handheld Imaging Devices Market Value (US$ Mn) Forecast, by End-user, 2017–2027
Table 21: Latin America Handheld Imaging Devices Market Value (US$ Mn) Forecast, by Country/Sub-region, 2017–2027
Table 22: Latin America Handheld Imaging Devices Market Value (US$ Mn) Forecast, by Product, 2017–2027
Table 23: Latin America Handheld Imaging Devices Market Value (US$ Mn) Forecast, by Component, 2017–2027
Table 24: Latin America Handheld Imaging Devices Market Value (US$ Mn) Forecast, by Application, 2016–2026
Table 25: Latin America Handheld Imaging Devices Market Value (US$ Mn) Forecast, by End-user, 2017–2027
Table 26: Middle East & Africa Handheld Imaging Devices Market Value (US$ Mn) Forecast, by Country/Sub-region, 2017–2027
Table 27: Middle East & Africa Handheld Imaging Devices Market Value (US$ Mn) Forecast, by Product, 2017–2027
Table 28: Middle East & Africa Handheld Imaging Devices Market Value (US$ Mn) Forecast, by Component, 2017–2027
Table 29: Middle East & Africa Handheld Imaging Devices Market Value (US$ Mn) Forecast, by Application, 2016–2026
Table 30: Middle East & Africa Handheld Imaging Devices Market Value (US$ Mn) Forecast, by End-user, 2017–2027
List of Figures
Figure 01: Global Handheld Imaging Devices Market Size (US$ Mn) and Distribution, by Region, 2018 and 2027
Figure 02: Global Handheld Imaging Devices Market Value (US$ Mn) Forecast, 2017–2027
Figure 03: Global Handheld Imaging Devices Market Value Share, by Product (2018)
Figure 04: Global Handheld Imaging Devices Market Value Share, by Component (2018)
Figure 05: Global Handheld Imaging Devices Market Value Share, by Component (2018)
Figure 06: Global Handheld Imaging Devices Market Value Share, by End-user (2018)
Figure 07: U.S. Handheld Imaging Devices Market Value Share, by End-user (2018)
Figure 08: U.S. Medical Device Approval Process
Figure 09: Global Diabetes Prevalence in Adults (20-79 years)
Figure 10: Global Handheld Imaging Devices Market Value Share Analysis, by Product, 2018 and 2027
Figure 11: Global Handheld Imaging Devices Market Value (US$ Mn) and Y-o-Y Growth (%), by X-ray/Fluoroscopy Scanners, 2017-2027
Figure 12: Global Handheld Imaging Devices Market Value (US$ Mn) and Y-o-Y Growth (%), by Optical Imaging Devices, 2017-2027
Figure 13: Global Handheld Imaging Devices Market Value (US$ Mn) and Y-o-Y Growth (%), by Ultrasound Scanners, 2017-2027
Figure 14: Global Handheld Imaging Devices Market Value (US$ Mn) and Y-o-Y Growth (%), by Near Infrared (NIR) Spectroscopy Scanners, 2017-2027
Figure 15: Global Handheld Imaging Devices Market Value (US$ Mn) and Y-o-Y Growth (%), by Optical Coherence Tomography (OCT) Scanners, 2017-2027
Figure 16: Global Handheld Imaging Devices Market Attractiveness Analysis, by Product 2019?2027
Figure 17: Global Handheld Imaging Devices Market Value Share Analysis, by Component, 2018 and 2027
Figure 18: Global Handheld Imaging Devices Market Value (US$ Mn) and Y-o-Y Growth (%), by Devices, 2017–2027
Figure 19: Global Handheld Imaging Devices Market Value (US$ Mn) and Y-o-Y Growth (%), by Apps & Software, 2017–2027
Figure 20: Global Handheld Imaging Devices Market Value (US$ Mn) and Y-o-Y Growth (%), by Accessories, 2017–2027
Figure 21: Global Handheld Imaging Devices Market Attractiveness, by Component, 2019–2027
Figure 22: Global Handheld Imaging Devices Market Value Share Analysis, by Application, 2018 and 2027
Figure 23: Global Handheld Imaging Devices Market Value (US$ Mn) and Y-o-Y Growth (%), by Ophthalmology, 2017–2027
Figure 24: Global Handheld Imaging Devices Market Value (US$ Mn) and Y-o-Y Growth (%), by Endocrinology, 2017–2027
Figure 25: Global Handheld Imaging Devices Market Value (US$ Mn) and Y-o-Y Growth (%), by Urology, 2017–2027
Figure 26: Global Handheld Imaging Devices Market Value (US$ Mn) and Y-o-Y Growth (%), by Gynecology & Obstetrics, 2017–2027
Figure 27: Global Handheld Imaging Devices Market Value (US$ Mn) and Y-o-Y Growth (%), by Dermatology, 2017–2027
Figure 28: Global Handheld Imaging Devices Market Value (US$ Mn) and Y-o-Y Growth (%), by Dentistry, 2017–2027
Figure 29: Global Handheld Imaging Devices Market Value (US$ Mn) and Y-o-Y Growth (%), by Cardiology and Vascular, 2017–2027
Figure 30: Global Handheld Imaging Devices Market Value (US$ Mn) and Y-o-Y Growth (%), by Orthopedics, 2017–2027
Figure 31: Global Handheld Imaging Devices Market Value (US$ Mn) and Y-o-Y Growth (%), by Others, 2016-2026
Figure 32: Global Handheld Imaging Devices Market Attractiveness Analysis, by Application, 2019–2027
Figure 33: Global Handheld Imaging Devices Market Value Share Analysis, by End-user, 2018 and 2027
Figure 34: Global Handheld Imaging Devices Market Value (US$ Mn) and Y-o-Y Growth (%), by Hospitals, 2017–2027
Figure 35: Global Handheld Imaging Devices Market Value (US$ Mn) and Y-o-Y Growth (%), by Diagnostic Imaging Centers, 2017–2027
Figure 36: Global Handheld Imaging Devices Market Value (US$ Mn) and Y-o-Y Growth (%), by Specialty Clinics, 2017–2027
Figure 37: Global Handheld Imaging Devices Market Value (US$ Mn) and Y-o-Y Growth (%), by Others, 2017–2027
Figure 38: Global Handheld Imaging Devices Market Attractiveness Analysis, by End-user, 2019–2027
Figure 39: Global Handheld Imaging Devices Market Value Share, by Region, 2018 and 2027
Figure 40: Global Handheld Imaging Devices Market Attractiveness Analysis, by Region, 2019–2027
Figure 41: North America Handheld Imaging Devices Market Value (US$ Mn) Forecast and Y-o-Y Growth Projection (%), 2017–2027
Figure 42: North America Handheld Imaging Devices Market Value Share, by Country, 2018 and 2027
Figure 43: North America Handheld Imaging Devices Market Attractiveness, by Country, 2019–2027
Figure 44: North America Handheld Imaging Devices Market Value Share, by Product, 2018 and 2027
Figure 45: North America Handheld Imaging Devices Market Attractiveness, by Product, 2019–2027
Figure 46: North America Home Blood Pressure Monitoring Market Value Share, by Component, 2018 and 2027
Figure 47: North America Home Blood Pressure Monitoring Market Attractiveness, by Component, 2019–2027
Figure 48: North America Handheld Imaging Devices Market Value Share, by Application, 2018 and 2027
Figure 49: North America Handheld Imaging Devices Market Attractiveness, by Application, 2019–2027
Figure 50: North America Handheld Imaging Devices Market Value Share, by End-user, 2018 and 2027
Figure 51: North America Handheld Imaging Devices Market Attractiveness, by End-user, 2019–2027
Figure 52: Europe Handheld Imaging Devices Market Value (US$ Mn) Forecast and Y-o-Y Growth Projection (%), 2017–2027
Figure 53: Europe Handheld Imaging Devices Market Value Share, by Country/Sub-region, 2018 and 2027
Figure 54: Europe Handheld Imaging Devices Market Attractiveness, by Country/Sub-region, 2019–2027
Figure 55: Europe Handheld Imaging Devices Market Value Share, by Product, 2018 and 2027
Figure 56: Europe Handheld Imaging Devices Market Attractiveness, by Product, 2019–2027
Figure 57: Europe Handheld Imaging Devices Market Value Share, by Component, 2018 and 2027
Figure 58: Europe Handheld Imaging Devices Market Attractiveness, by Component, 2019–2027
Figure 59: Europe Handheld Imaging Devices Market Value Share, by Application, 2018 and 2027
Figure 60: Europe Handheld Imaging Devices Market Attractiveness, by Application, 2019–2027
Figure 61: Europe Handheld Imaging Devices Market Value Share, by End-user, 2018 and 2027
Figure 62: Europe Handheld Imaging Devices Market Attractiveness, by End-user, 2019–2027
Figure 63: Asia Pacific Handheld Imaging Devices Market Value (US$ Mn) Forecast and Y-o-Y Growth Projection (%), 2017–2027
Figure 64: Asia Pacific Handheld Imaging Devices Market Value Share, by Country/Sub-region, 2018 and 2027
Figure 65: Asia Pacific Handheld Imaging Devices Market Attractiveness, by Country/Sub-region, 2019–2027
Figure 66: Asia Pacific Handheld Imaging Devices Market Value Share, by Product, 2018 and 2027
Figure 67: Asia Pacific Handheld Imaging Devices Market Attractiveness, by Product, 2019–2027
Figure 68: Asia Pacific Handheld Imaging Devices Market Value Share, by Component, 2018 and 2027
Figure 69: Asia Pacific Handheld Imaging Devices Market Attractiveness, by Component, 2019–2027
Figure 70: Asia Pacific Handheld Imaging Devices Market Value Share, by Application, 2018 and 2027
Figure 71: Asia Pacific Handheld Imaging Devices Market Attractiveness, by Application, 2019–2027
Figure 72: Asia Pacific Handheld Imaging Devices Market Value Share, by End-user, 2018 and 2027
Figure 73: Asia Pacific Handheld Imaging Devices Market Attractiveness, by End-user, 2019–2027
Figure 74: Latin America Handheld Imaging Devices Market Value (US$ Mn) Forecast and Y-o-Y Growth Projection (%), 2017–2027
Figure 75: Latin America Handheld Imaging Devices Market Value Share, by Country/Sub-region, 2018 and 2027
Figure 76: Latin America Handheld Imaging Devices Market Attractiveness, by Country/Sub-region, 2019–2027
Figure 77: Latin America Handheld Imaging Devices Market Value Share, by Product, 2018 and 2027
Figure 78: Latin America Handheld Imaging Devices Market Attractiveness, by Product, 2019–2027
Figure 79: Latin America Handheld Imaging Devices Market Value Share, by Component, 2018 and 2027
Figure 80: Latin America Handheld Imaging Devices Market Attractiveness, by Component, 2019–2027
Figure 81: Latin America Handheld Imaging Devices Market Value Share, by Application, 2018 and 2027
Figure 82: Latin America Handheld Imaging Devices Market Attractiveness, by Application, 2019–2027
Figure 83: Latin America Handheld Imaging Devices Market Value Share, by End-user, 2018 and 2027
Figure 84: Latin America Handheld Imaging Devices Market Attractiveness, by End-user, 2019–2027
Figure 85: Middle East & Africa Handheld Imaging Devices Market Value (US$ Mn) Forecast and Y-o-Y Growth Projection (%), 2017–2027
Figure 86: Middle East & Africa Handheld Imaging Devices Market Value Share, by Country/Sub-region, 2018 and 2027
Figure 87: Middle East & Africa Handheld Imaging Devices Market Attractiveness, by Country/Sub-region, 2019–2027
Figure 88: Middle East & Africa Handheld Imaging Devices Market Value Share, by Product, 2018 and 2027
Figure 89: Middle East & Africa Handheld Imaging Devices Market Attractiveness, by Product, 2019–2027
Figure 90: Middle East & Africa Handheld Imaging Devices Market Value Share, by Component, 2018 and 2027
Figure 91: Middle East & Africa Handheld Imaging Devices Market Attractiveness, by Component, 2019–2027
Figure 92: Middle East & Africa Handheld Imaging Devices Market Value Share, by Application, 2018 and 2027
Figure 93: Middle East & Africa Handheld Imaging Devices Market Attractiveness, by Application, 2019–2027
Figure 94: Middle East & Africa Handheld Imaging Devices Market Value Share, by End-user, 2018 and 2027
Figure 95: Middle East & Africa Handheld Imaging Devices Market Attractiveness, by End-user, 2019–2027
Figure 96: Market Position/Ranking Analysis, 2018, by Tier and Size of the Company
Copyright © Transparency Market Research, Inc. All Rights reserved
Trust Online

Handheld Imaging Devices Market