
Reports
Reports
Analysts’ Viewpoint on Glass Vials Market Scenario
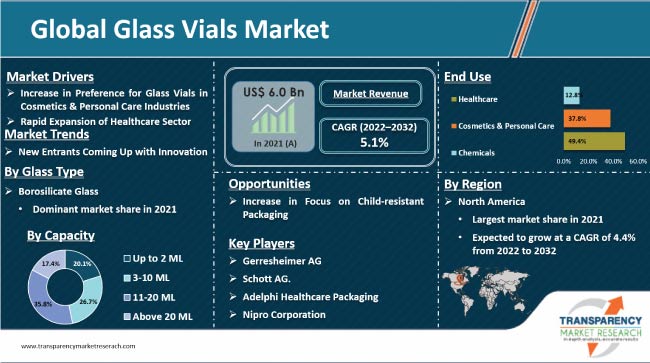
The global glass vials market is expected to grow at a steady pace during the forecast period due to the increase in demand for glass vials in end-use industries such as healthcare, chemicals, and cosmetics & personal care. Glass vials help maintain the quality of substances stored. They conform to the exact requirements of customers. They possess longer shelf-life and provide contamination-free storage. Glass vial is the preferred eco-friendly material among customers due to its easy recyclability. Development of various new drugs and medications requires proper containers for storage. This is augmenting the sales of glass vials. Availability of glass vials with child-resistant closures is creating lucrative opportunities for market players. Companies in the global glass vials market should tap into incremental opportunities by focusing on capacity expansion to broaden their revenue streams.
Increase in demand for safe packaging products in the healthcare industry is expected to drive the global glass vials market. Demand for glass vials is driven by their unique attributes. Unlike plastic, glass vials do not impart the essence into the drug stored in them. Glass vials maintain the quality of chemicals and drugs. Thus, demand for glass vials is increasing in the packaging of healthcare, cosmetics & personal care, and chemical products.
Glass vials are dust resistant, easy to clean, and non-reactive with liquids stored in them. Nowadays, manufacturers are increasingly inclined toward high-tech glasses to keep medicine solutions safe. They also prefer eco-friendly packaging solutions. Thus, the global glass vials market growth forecast appears positive during the forecast period. Government initiatives and increase in awareness about recyclable glass vials among customers are other positive glass vials market aspects.
Demand for medicines and other healthcare products increased significantly among hospitals as well as consumers during the peak of the coronavirus pandemic. This boosted the demand for a safe and better form of packaging for storing drugs and medications. Glass vial is a sustainable form of packaging solution for manufacturers, retailers, and consumers. Rise in emphasis on maintaining the purity of drugs has encouraged the packaging industry to adapt to packaging that is sustainable and recyclable. Changing situation of COVID-19 is augmenting the demand for safe and protective packaging of drugs, as safe packaging protects drugs and medicines from the external environment.
Outbreak of the Covid-19 disease adversely affected the global packaging industry. Production and supply activities of various end-use industries, except food and pharmaceuticals, came to a halt due to disruptions in supply chains. However, the healthcare industry, which was deemed ‘essential,’ grew significantly. Global sales of glass vials recorded positive growth in 2020. According to the International Federation of Pharmaceutical Manufacturers & Association (IFPMA), around 11 billion vaccines were produced in 2021. This showcases the fair impact on the glass vials market during the pandemic. Pharmaceutical packaging manufacturers expanded their production capacity to cater to the rising demand for glass vials during the peak of the COVID-19 pandemic.
Several healthcare companies have been using plastic vials to store pharmaceuticals and healthcare products. However, consumers are now shifting toward glass vials, which are 100% recyclable and have better properties than plastic vials. Glass vials protect drugs and chemicals from any contamination or spillage, and increase their shelf life. Therefore, manufacturers have started developing glass vials instead of plastic vials. This is providing lucrative opportunities for smaller players to enter the sustainability market. Additionally, the replacement of plastic vials with recyclable glass vials is expected to boost the glass vials market in the near future.
Glass vials are used in the cosmetics & personal care industry for applications such as oil, lip balms, and creams. Glass vials are primarily used for perfume samples. Glass vial used as a perfume sample allows the user to wear the fragrance of the scent before purchasing it in a store. Vials, therefore, are the ideal solution for perfume samples. High-quality care products such as anti-aging cosmetics are also offered in glass vials.
Glass vials are available in different sizes. The cosmetics industry is growing due to the increase in usage of cosmetic products among the millennial population. Thus, rise in awareness about the usage of cosmetics and personal care products is anticipated to drive the global market for glass vials during the forecast period.
Pharmaceutical, cosmetics, and other packaging manufacturers are striving to focus on child-resistant packaging. Pharmaceutical as well as cosmetics & personal care companies are expected to grab lucrative growth opportunities by developing innovative child-resistance packaging. Glass vials are available with child-resistance closures. Companies are also adopting different approaches to make packaging child-resistant. For instance, glass vial manufacturers are opting for single-dose packaging. Child-resistant packaging helps in preventing the intake of unintended and harmful medicinal products by children. Thus, introduction of child-resistant packaging is projected to create ample growth opportunities for glass vial manufacturers during the forecast period.
Asia Pacific is projected to be the fastest-growing market for glass vials. Key factors boosting the production of glass vials in the region are easy availability of raw materials and cost-effective labor. India is one of the largest markets for glass vials. Increase in demand for pharmaceutical products along with the entry of various local & global packaging manufacturers is projected to drive the market in India. Rise in awareness about eco-friendly packaging for drugs in the country is also driving the demand for glass vials. Furthermore, government initiatives and increase in expenditure on R&D are expected to augment the demand for glass vials in India during the forecast period.
Asia Pacific is expected to be the dominant region of the global market during the forecast period. However, the market in North America is projected to grow 1.5X its present market value by the end of the forecast period. The market in the region is anticipated to grow at a healthy CAGR of 4.4% by 2032. Rise in number of hospitals in the U.S. is the key factor augmenting the sales of glass vials in North America.
The global glass vials market is fragmented, with the presence of large numbers of manufacturers that control majority of the share. Mergers and acquisitions and development of product portfolios are major strategies adopted by key players. The global glass vials market assessment report includes various sections such as glass vials market drivers, glass vials market restraints, glass vials market challenges, glass vials market pricing analysis, glass vials market sales analysis, and glass vials market opportunities analysis. It also focuses on glass vials market competition analysis, glass vials market recent developments, and glass vials market demand analysis.
Key players operating in the global glass vials market are Gerresheimer AG, Schott AG, Adelphi Healthcare Packaging, Nipro Corporation, West Pharmaceutical Services, Inc., Pacific Vial Manufacturing Inc., SDG Pharma, Origin Pharma Packaging, and APG Pharma Packaging. These players have been profiled in the glass vials market report based on parameters such as company overview, financial overview, business strategies, product portfolio, business segments, and recent developments.
|
Attribute |
Detail |
|
Market Size Value in 2021 |
US$ 6.0 Bn |
|
Market Forecast Value in 2032 |
US$ 10.4 Bn |
|
Growth Rate (CAGR) |
5.1% |
|
Forecast Period |
2022–2032 |
|
Quantitative Units |
US$ Bn for Value, Units for Volume |
|
Market Analysis |
It includes cross-segment analysis at the global as well as regional levels. Moreover, the qualitative analysis includes drivers, restraints, opportunities, key trends, and a parent industry overview. |
|
Competition Landscape |
|
|
Format |
Electronic (PDF) + Excel |
|
Market Segmentation |
|
|
Regions Covered |
|
|
Countries Covered |
|
|
Companies Profiled |
|
|
Customization Scope |
Available upon request |
|
Pricing |
Available upon request |
The global glass vials market was valued at US$ 6.0 Bn in 2021.
The global glass vials market is expected to grow at a CAGR of 5.1% during 2022 to 2032.
The global glass vials market is projected to reach US$ 10.4 Bn by the end of 2032.
Rise in demand for glass vials in various end-use industries such as healthcare, cosmetics & personal care, and chemical.
Borosilicate glass is majorly preferred by glass vials manufacturers.
North America is estimated to showcase high demand for glass vials during 2022 to 2032.
Gerresheimer AG, Schott AG, Adelphi Healthcare Packaging, Nipro Corporation, West Pharmaceutical Services, Inc., and Pacific Vial Manufacturing Inc.
The China glass vials market is anticipated to grow 2.1X times the current market value during the forecast period.
1. Executive Summary
1.1. Market Overview
1.2. Market Analysis
1.3. TMR Analysis and Recommendations
2. Market Viewpoint
2.1. Market Definition
2.2. Market Taxonomy
3. Glass Vials Market Overview
3.1. Introduction
3.2. Global Glass Vials Market Overview
3.3. Glass Vials Market (US$ Bn) and Forecast
3.4. Value Chain Analysis
3.4.1. Exhaustive List of Active Participants
3.4.1.1. Raw Material Suppliers
3.4.1.2. Glass Vials Manufacturers/Distributor
3.4.1.3. End Users/Customers
3.4.2. Profitability Margins
3.5. Macro-economic Factors – Correlation Analysis
3.6. Forecast Factors – Relevance & Impact
4. Impact of COVID-19
4.1. Current Statistics and Probable Future Impact
4.2. Impact of COVID-19 on the Target Market
5. Glass Vials Market Analysis
5.1. Pricing Analysis
5.1.1. Pricing Assumption
5.1.2. Price Projections By Region
5.2. Market Size (US$ Bn) and Forecast
5.2.1. Market Size and Y-o-Y Growth
5.2.2. Absolute $ Opportunity
6. Glass Vials Market Dynamics
6.1. Drivers
6.2. Restraints
6.3. Opportunity Analysis
6.4. Trends
7. Global Glass Vials Market Analysis and Forecast, By Glass Type
7.1. Introduction
7.1.1. Market share and Basis Points (BPS) Analysis, By Glass Type
7.1.2. Y-o-Y Growth Projections, By Glass Type
7.2. Historical Market Value (US$ Bn) and Volume (Units), 2015-2021, By Glass Type
7.2.1. Borosilicate Glass
7.2.2. Fused Silica
7.3. Market Size (US$ Bn) and Volume (Units) Forecast Analysis 2022-2032, By Glass Type
7.3.1. Borosilicate Glass
7.3.2. Fused Silica
7.4. Market Attractiveness Analysis, By Glass Type
8. Global Glass Vials Market Analysis and Forecast, By Capacity
8.1. Introduction
8.1.1. Market share and Basis Points (BPS) Analysis, By Capacity
8.1.2. Y-o-Y Growth Projections, By Capacity
8.2. Historical Market Value (US$ Bn) and Volume (Units), 2015-2021, By Capacity
8.2.1. Up to 2 ML
8.2.2. 3-10 ML
8.2.3. 11-20 ML
8.2.4. Above 20 ML
8.3. Market Size (US$ Bn) and Volume (Units) Forecast Analysis 2022-2032, By Capacity
8.3.1. Up to 2 ML
8.3.2. 3-10 ML
8.3.3. 11-20 ML
8.3.4. Above 20 ML
8.4. Market Attractiveness Analysis, By Capacity
9. Global Glass Vials Market Analysis and Forecast, By End Use
9.1. Introduction
9.1.1. Market share and Basis Points (BPS) Analysis, By End Use
9.1.2. Y-o-Y Growth Projections, By End Use
9.2. Historical Market Value (US$ Bn) and Volume (Units), 2015-2021, By End Use
9.2.1. Healthcare
9.2.2. Cosmetics & Personal care
9.2.3. Chemicals
9.3. Market Size (US$ Bn) and Volume (Units) Forecast Analysis 2022-2032, By End Use
9.3.1. Healthcare
9.3.2. Cosmetics & Personal care
9.3.3. Chemicals
9.4. Market Attractiveness Analysis, By End Use
9.5. Prominent Trends
10. Global Glass Vials Market Analysis and Forecast, By Region
10.1. Introduction
10.1.1. Market share and Basis Points (BPS) Analysis By Region
10.1.2. Y-o-Y Growth Projections By Region
10.2. Historical Market Value (US$ Bn) and Volume (Units), 2015-2021, By Region
10.2.1. North America
10.2.2. Latin America
10.2.3. Europe
10.2.4. Asia Pacific
10.2.5. Middle East and Africa
10.3. Market Size (US$ Bn) and Volume (Units) Forecast Analysis 2022-2032 By Region
10.3.1. North America
10.3.2. Latin America
10.3.3. Europe
10.3.4. Asia Pacific
10.3.5. Middle East and Africa
10.4. Market Attractiveness Analysis By Region
11. North America Glass Vials Market Analysis and Forecast
11.1. Introduction
11.1.1. Market share and Basis Points (BPS) Analysis, By Country
11.1.2. Y-o-Y Growth Projections, By Country
11.2. Historical Market Value (US$ Bn) and Volume (Units), 2015-2021, By Country
11.3. Market Size (US$ Bn) and Volume (Units) Forecast Analysis 2022-2032, By Country
11.3.1. U.S.
11.3.2. Canada
11.4. Historical Market Value (US$ Bn) and Volume (Units), 2015-2021, By Glass Type
11.5. Market Size (US$ Bn) and Volume (Units) Forecast Analysis 2022-2032 Analysis 2022-2032, By Glass Type
11.5.1. Borosilicate Glass
11.5.2. Fused Silica
11.6. Historical Market Value (US$ Bn) and Volume (Units), 2015-2021, By Capacity
11.7. Market Size (US$ Bn) and Volume (Units) Forecast Analysis 2022-2032 Analysis 2022-2032, By Capacity
11.7.1. Up to 2 ML
11.7.2. 3-10 ML
11.7.3. 11-20 ML
11.7.4. Above 20 ML
11.8. Historical Market Value (US$ Bn) and Volume (Units), 2015-2021, By End Use
11.9. Market Size (US$ Bn) and Volume (Units) Forecast Analysis 2022-2032, By End Use
11.9.1. Healthcare
11.9.2. Cosmetics & Personal care
11.9.3. Chemicals
11.10. Market Attractiveness Analysis
11.10.1. By Country
11.10.2. By Glass Type
11.10.3. By Capacity
11.10.4. By End Use
12. Latin America Glass Vials Market Analysis and Forecast
12.1. Introduction
12.1.1. Market share and Basis Points (BPS) Analysis, By Country
12.1.2. Y-o-Y Growth Projections, By Country
12.2. Historical Market Value (US$ Bn) and Volume (Units), 2015-2021, By Country
12.3. Market Size (US$ Bn) and Volume (Units) Forecast Analysis 2022-2032, By Country
12.3.1. Brazil
12.3.2. Mexico
12.3.3. Argentina
12.3.4. Rest of Latin America
12.4. Historical Market Value (US$ Bn) and Volume (Units), 2015-2021, By Glass Type
12.5. Market Size (US$ Bn) and Volume (Units) Forecast Analysis 2022-2032 Analysis 2022-2032, By Glass Type
12.5.1. Borosilicate Glass
12.5.2. Fused Silica
12.6. Historical Market Value (US$ Bn) and Volume (Units), 2015-2021, By Capacity
12.7. Market Size (US$ Bn) and Volume (Units) Forecast Analysis 2022-2032 Analysis 2022-2032, By Capacity
12.7.1. Up to 2 ML
12.7.2. 3-10 ML
12.7.3. 11-20 ML
12.7.4. Above 20 ML
12.8. Historical Market Value (US$ Bn) and Volume (Units), 2015-2021, By End Use
12.9. Market Size (US$ Bn) and Volume (Units) Forecast Analysis 2022-2032, By End Use
12.9.1. Healthcare
12.9.2. Cosmetics & Personal care
12.9.3. Chemicals
12.10. Market Attractiveness Analysis
12.10.1. By Country
12.10.2. By Glass Type
12.10.3. By Capacity
12.10.4. By End Use
13. Europe Glass Vials Market Analysis and Forecast
13.1. Introduction
13.1.1. Market share and Basis Points (BPS) Analysis, By Country
13.1.2. Y-o-Y Growth Projections, By Country
13.2. Historical Market Value (US$ Bn) and Volume (Units), 2015-2021, By Country
13.3. Market Size (US$ Bn) and Volume (Units) Forecast Analysis 2022-2032, By Country
13.3.1. Germany
13.3.2. Italy
13.3.3. France
13.3.4. Spain
13.3.5. Nordics
13.3.6. U.K.
13.3.7. Benelux
13.3.8. Russia
13.3.9. Poland
13.3.10. Rest of Europe
13.4. Historical Market Value (US$ Bn) and Volume (Units), 2015-2021, By Glass Type
13.5. Market Size (US$ Bn) and Volume (Units) Forecast Analysis 2022-2032 Analysis 2022-2032, By Glass Type
13.5.1. Borosilicate Glass
13.5.2. Fused Silica
13.6. Historical Market Value (US$ Bn) and Volume (Units), 2015-2021, By Capacity
13.7. Market Size (US$ Bn) and Volume (Units) Forecast Analysis 2022-2032 Analysis 2022-2032, By Capacity
13.7.1. Up to 2 ML
13.7.2. 3-10 ML
13.7.3. 11-20 ML
13.7.4. Above 20 ML
13.8. Historical Market Value (US$ Bn) and Volume (Units), 2015-2021, By End Use
13.9. Market Size (US$ Bn) and Volume (Units) Forecast Analysis 2022-2032, By End Use
13.9.1. Healthcare
13.9.2. Cosmetics & Personal care
13.9.3. Chemicals
13.10. Market Attractiveness Analysis
13.10.1. By Country
13.10.2. By Glass Type
13.10.3. By Capacity
13.10.4. By End Use
14. Asia Pacific Glass Vials Market Analysis and Forecast
14.1. Introduction
14.1.1. Market share and Basis Points (BPS) Analysis, By Country
14.1.2. Y-o-Y Growth Projections, By Country
14.2. Historical Market Value (US$ Bn) and Volume (Units), 2015-2021, By Country
14.3. Market Size (US$ Bn) and Volume (Units) Forecast Analysis 2022-2032, By Country
14.3.1. China
14.3.2. India
14.3.3. ASEAN
14.3.4. Australia & New Zealand
14.3.5. Japan
14.3.6. Rest of APAC
14.4. Historical Market Value (US$ Bn) and Volume (Units), 2015-2021, By Glass Type
14.5. Market Size (US$ Bn) and Volume (Units) Forecast Analysis 2022-2032 Analysis 2022-2032, By Glass Type
14.5.1. Borosilicate Glass
14.5.2. Fused Silica
14.6. Historical Market Value (US$ Bn) and Volume (Units), 2015-2021, By Capacity
14.7. Market Size (US$ Bn) and Volume (Units) Forecast Analysis 2022-2032 Analysis 2022-2032, By Capacity
14.7.1. Up to 2 ML
14.7.2. 3-10 ML
14.7.3. 11-20 ML
14.7.4. Above 20 ML
14.8. Historical Market Value (US$ Bn) and Volume (Units), 2015-2021, By End Use
14.9. Market Size (US$ Bn) and Volume (Units) Forecast Analysis 2022-2032, By End Use
14.9.1. Healthcare
14.9.2. Cosmetics & Personal care
14.9.3. Chemicals
14.10. Market Attractiveness Analysis
14.10.1. By Country
14.10.2. By Glass Type
14.10.3. By Capacity
14.10.4. By End Use
15. Middle East and Africa Glass Vials Market Analysis and Forecast
15.1. Introduction
15.1.1. Market share and Basis Points (BPS) Analysis, By Country
15.1.2. Y-o-Y Growth Projections, By Country
15.2. Historical Market Value (US$ Bn) and Volume (Units), 2015-2021, By Country
15.3. Market Size (US$ Bn) and Volume (Units) Forecast Analysis 2022-2032, By Country
15.3.1. Northern Africa
15.3.2. GCC Countries
15.3.3. South Africa
15.3.4. Rest of MEA
15.4. Historical Market Value (US$ Bn) and Volume (Units), 2015-2021, By Glass Type
15.5. Market Size (US$ Bn) and Volume (Units) Forecast Analysis 2022-2032 Analysis 2022-2032, By Glass Type
15.5.1. Borosilicate Glass
15.5.2. Fused Silica
15.6. Historical Market Value (US$ Bn) and Volume (Units), 2015-2021, By Capacity
15.7. Market Size (US$ Bn) and Volume (Units) Forecast Analysis 2022-2032 Analysis 2022-2032, By Capacity
15.7.1. Up to 2 ML
15.7.2. 3-10 ML
15.7.3. 11-20 ML
15.7.4. Above 20 ML
15.8. Historical Market Value (US$ Bn) and Volume (Units), 2015-2021, By End Use
15.9. Market Size (US$ Bn) and Volume (Units) Forecast Analysis 2022-2032, By End Use
15.9.1. Healthcare
15.9.2. Cosmetics & Personal care
15.9.3. Chemicals
15.10. Market Attractiveness Analysis
15.10.1. By Country
15.10.2. By Glass Type
15.10.3. By Capacity
15.10.4. By End Use
16. Country wise Glass Vials Market Analysis, 2022-2032
16.1. U.S. Glass Vials Market Analysis
16.1.1. By Glass Type
16.1.2. By Capacity
16.1.3. By End Use
16.2. Canada Glass Vials Market Analysis
16.2.1. By Glass Type
16.2.2. By Capacity
16.2.3. By End Use
16.3. Brazil Glass Vials Market Analysis
16.3.1. By Glass Type
16.3.2. By Capacity
16.3.3. By End Use
16.4. Mexico Glass Vials Market Analysis
16.4.1. By Glass Type
16.4.2. By Capacity
16.4.3. By End Use
16.5. Germany Glass Vials Market Analysis
16.5.1. By Glass Type
16.5.2. By Capacity
16.5.3. By End Use
16.6. Spain Glass Vials Market Analysis
16.6.1. By Glass Type
16.6.2. By Capacity
16.6.3. By End Use
16.7. France Glass Vials Market Analysis
16.7.1. By Glass Type
16.7.2. By Capacity
16.7.3. By End Use
16.8. U.K. Glass Vials Market Analysis
16.8.1. By Glass Type
16.8.2. By Capacity
16.8.3. By End Use
16.9. Italy Glass Vials Market Analysis
16.9.1. By Glass Type
16.9.2. By Capacity
16.9.3. By End Use
16.10. Russia Glass Vials Market Analysis
16.10.1. By Glass Type
16.10.2. By Capacity
16.10.3. By End Use
16.11. China Glass Vials Market Analysis
16.11.1. By Glass Type
16.11.2. By Capacity
16.11.3. By End Use
16.12. India Glass Vials Market Analysis
16.12.1. By Glass Type
16.12.2. By Capacity
16.12.3. By End Use
16.13. Japan Glass Vials Market Analysis
16.13.1. By Glass Type
16.13.2. By Capacity
16.13.3. By End Use
16.14. GCC Countries Glass Vials Market Analysis
16.14.1. By Glass Type
16.14.2. By Capacity
16.14.3. By End Use
16.15. South Africa Glass Vials Market Analysis
16.15.1. By Glass Type
16.15.2. By Capacity
16.15.3. By End Use
17. Competitive Landscape
17.1. Market Structure
17.2. Competition Dashboard
17.3. Company Market Share Analysis
17.4. Company Profiles (Details – Overview, Financials, Strategy, Recent Developments, SWOT analysis)
17.5. Competition Deep Dive(Key Global Market Players)
17.5.1. Gerresheimer AG
17.5.1.1. Overview
17.5.1.2. Financials
17.5.1.3. Strategy
17.5.1.4. Recent Developments
17.5.1.5. SWOT Analysis
17.5.2. Schott AG
17.5.2.1. Overview
17.5.2.2. Financials
17.5.2.3. Strategy
17.5.2.4. Recent Developments
17.5.2.5. SWOT Analysis
17.5.3. Adelphi Healthcare Packaging
17.5.3.1. Overview
17.5.3.2. Financials
17.5.3.3. Strategy
17.5.3.4. Recent Developments
17.5.3.5. SWOT Analysis
17.5.4. Nipro Corporation
17.5.4.1. Overview
17.5.4.2. Financials
17.5.4.3. Strategy
17.5.4.4. Recent Developments
17.5.4.5. SWOT Analysis
17.5.5. West Pharmaceutical Services, Inc.
17.5.5.1. Overview
17.5.5.2. Financials
17.5.5.3. Strategy
17.5.5.4. Recent Developments
17.5.5.5. SWOT Analysis
17.5.6. Pacific Vial Manufacturing Inc
17.5.6.1. Overview
17.5.6.2. Financials
17.5.6.3. Strategy
17.5.6.4. Recent Developments
17.5.6.5. SWOT Analysis
17.5.7. Phoenix Glass
17.5.7.1. Overview
17.5.7.2. Financials
17.5.7.3. Strategy
17.5.7.4. Recent Developments
17.5.7.5. SWOT Analysis
17.5.8. APG Pharma Packaging
17.5.8.1. Overview
17.5.8.2. Financials
17.5.8.3. Strategy
17.5.8.4. Recent Developments
17.5.8.5. SWOT Analysis
17.5.9. Stevanato Group
17.5.9.1. Overview
17.5.9.2. Financials
17.5.9.3. Strategy
17.5.9.4. Recent Developments
17.5.9.5. SWOT Analysis
17.5.10. Sichuan Mianzhu Chengxin Pharmaceutical Glass Co., Ltd.
17.5.10.1. Overview
17.5.10.2. Financials
17.5.10.3. Strategy
17.5.10.4. Recent Developments
17.5.10.5. SWOT Analysis
17.5.11. Origin Pharma Packaging
17.5.11.1. Overview
17.5.11.2. Financials
17.5.11.3. Strategy
17.5.11.4. Recent Developments
17.5.11.5. SWOT Analysis
17.5.12. Neelam Global Pvt. Ltd.
17.5.12.1. Overview
17.5.12.2. Financials
17.5.12.3. Strategy
17.5.12.4. Recent Developments
17.5.12.5. SWOT Analysis
17.5.13. Merck KGaA
17.5.13.1. Overview
17.5.13.2. Financials
17.5.13.3. Strategy
17.5.13.4. Recent Developments
17.5.13.5. SWOT Analysis
17.5.14. DANYANG XIANGHE PHARMACEUTICAL PACKAGING CO., LTD.
17.5.14.1. Overview
17.5.14.2. Financials
17.5.14.3. Strategy
17.5.14.4. Recent Developments
17.5.14.5. SWOT Analysis
17.5.15. SGD Pharma
17.5.15.1. Overview
17.5.15.2. Financials
17.5.15.3. Strategy
17.5.15.4. Recent Developments
17.5.15.5. SWOT Analysis
18. Assumptions and Acronyms Used
19. Research Methodology
List of Tables
Table 01: Global Glass Vials Market Historic Value (US$ Bn), By Glass Type 2015(H)-2021(A)
Table 02: Global Glass Vials Market Forecast Value (US$ Bn), By Glass Type 2022(E)-2032(F)
Table 03: Global Glass Vials Market Historic Volume (Units), By Glass Type 2015(H)-2021(A)
Table 04: Global Glass Vials Market Forecast Volume (Units), By Glass Type 2022(E)-2032(F)
Table 05: Global Glass Vials Market Historic Value (US$ Bn), By Capacity 2015(H)-2021(A)
Table 06: Global Glass Vials Market Forecast Value (US$ Bn), By Capacity 2022(E)-2032(F)
Table 07: Global Glass Vials Market Historic Volume (Units), By Capacity 2015(H)-2021(A)
Table 08: Global Glass Vials Market Forecast Volume (Units), By Capacity 2022(E)-2032(F)
Table 09: Global Glass Vials Market Historic Value (US$ Bn), By End Use 2015(H)-2021(A)
Table 10: Global Glass Vials Market Forecast Value (US$ Bn), By End Use 2022(E)-2032(F)
Table 11: Global Glass Vials Market Historic Volume (Units), By End Use 2015(H)-2021(A)
Table 12: Global Glass Vials Market Forecast Volume (Units), By End Use 2022(E)-2032(F)
Table 13: Global Glass Vials Market Historic Value (US$ Bn), By Region 2015(H)-2021(A)
Table 14: Global Glass Vials Market Forecast Value (US$ Bn), By Region 2022(E)-2032(F)
Table 15: Global Glass Vials Market Historic Volume (Units), By Region 2015(H)-2021(A)
Table 16: Global Glass Vials Market Forecast Volume (Units), By Region 2022(E)-2032(F)
Table 17: North America Glass Vials Market Historic Value (US$ Bn), By Glass Type 2015(H)-2021(A)
Table 18: North America Glass Vials Market Forecast Value (US$ Bn), By Glass Type 2022(E)-2032(F)
Table 19: North America Glass Vials Market Historic Volume (Units), By Glass Type 2015(H)-2021(A)
Table 20: North America Glass Vials Market Forecast Volume (Units), By Glass Type 2022(E)-2032(F)
Table 21: North America Glass Vials Market Historic Value (US$ Bn), By Capacity 2015(H)-2021(A)
Table 22: North America Glass Vials Market Forecast Value (US$ Bn), By Capacity 2022(E)-2032(F)
Table 23: North America Glass Vials Market Historic Volume (Units), By Capacity 2015(H)-2021(A)
Table 24: North America Glass Vials Market Forecast Volume (Units), By Capacity 2022(E)-2032(F)
Table 25: North America Glass Vials Market Historic Value (US$ Bn), By End Use 2015(H)-2021(A)
Table 26: North America Glass Vials Market Forecast Value (US$ Bn), By End Use 2022(E)-2032(F)
Table 27: North America Glass Vials Market Historic Volume (Units), By End Use 2015(H)-2021(A)
Table 28: North America Glass Vials Market Forecast Volume (Units), By End Use 2022(E)-2032(F)
Table 29: North America Glass Vials Market Historic Value (US$ Bn), By Country 2015(H)-2021(A)
Table 30: North America Glass Vials Market Forecast Value (US$ Bn), By Country 2022(E)-2032(F)
Table 31: North America Glass Vials Market Historic Volume (Units), By Country 2015(H)-2021(A)
Table 32: North America Glass Vials Market Forecast Volume (Units), By Country 2022(E)-2032(F)
Table 33: Latin America Glass Vials Market Historic Value (US$ Bn), By Glass Type 2015(H)-2021(A)
Table 34: Latin America Glass Vials Market Forecast Value (US$ Bn), By Glass Type 2022(E)-2032(F)
Table 35: Latin America Glass Vials Market Historic Volume (Units), By Glass Type 2015(H)-2021(A)
Table 36: Latin America Glass Vials Market Forecast Volume (Units), By Glass Type 2022(E)-2032(F)
Table 37: Latin America Glass Vials Market Historic Value (US$ Bn), By Capacity 2015(H)-2021(A)
Table 38: Latin America Glass Vials Market Forecast Value (US$ Bn), By Capacity 2022(E)-2032(F)
Table 39: Latin America Glass Vials Market Historic Volume (Units), By Capacity 2015(H)-2021(A)
Table 40: Latin America Glass Vials Market Forecast Volume (Units), By Capacity 2022(E)-2032(F)
Table 41: Latin America Glass Vials Market Historic Value (US$ Bn), By End Use 2015(H)-2021(A)
Table 42: Latin America Glass Vials Market Forecast Value (US$ Bn), By End Use 2022(E)-2032(F)
Table 43: Latin America Glass Vials Market Historic Volume (Units), By End Use 2015(H)-2021(A)
Table 44: Latin America Glass Vials Market Forecast Volume (Units), By End Use 2022(E)-2032(F)
Table 45: Latin America Glass Vials Market Historic Value (US$ Bn), By Country 2015(H)-2021(A)
Table 46: Latin America Glass Vials Market Forecast Value (US$ Bn), By Country 2022(E)-2032(F)
Table 47: Latin America Glass Vials Market Historic Volume (Units), By Country 2015(H)-2021(A)
Table 48: Latin America Glass Vials Market Forecast Volume (Units), By Country 2022(E)-2032(F)
Table 49: Europe Glass Vials Market Historic Value (US$ Bn), By Glass Type 2015(H)-2021(A)
Table 50: Europe Glass Vials Market Forecast Value (US$ Bn), By Glass Type 2022(E)-2032(F)
Table 51: Europe Glass Vials Market Historic Volume (Units), By Glass Type 2015(H)-2021(A)
Table 52: Europe Glass Vials Market Forecast Volume (Units), By Glass Type 2022(E)-2032(F)
Table 53: Europe Glass Vials Market Historic Value (US$ Bn), By Capacity 2015(H)-2021(A)
Table 54: Europe Glass Vials Market Forecast Value (US$ Bn), By Capacity 2022(E)-2032(F)
Table 55: Europe Glass Vials Market Historic Volume (Units), By Capacity 2015(H)-2021(A)
Table 56: Europe Glass Vials Market Forecast Volume (Units), By Capacity 2022(E)-2032(F)
Table 57: Europe Glass Vials Market Historic Value (US$ Bn), By End Use 2015(H)-2021(A)
Table 58: Europe Glass Vials Market Forecast Value (US$ Bn), By End Use 2022(E)-2032(F)
Table 59: Europe Glass Vials Market Historic Volume (Units), By End Use 2015(H)-2021(A)
Table 60: Europe Glass Vials Market Forecast Volume (Units), By End Use 2022(E)-2032(F)
Table 61: Europe Glass Vials Market Historic Value (US$ Bn), By Country 2015(H)-2021(A)
Table 62: Europe Glass Vials Market Forecast Value (US$ Bn), By Country 2022(E)-2032(F)
Table 63: Europe Glass Vials Market Historic Volume (Units), By Country 2015(H)-2021(A)
Table 64: Europe Glass Vials Market Forecast Volume (Units), By Country 2022(E)-2032(F)
Table 65: Asia Pacific Glass Vials Market Historic Value (US$ Bn), By Glass Type 2015(H)-2021(A)
Table 66: Asia Pacific Glass Vials Market Forecast Value (US$ Bn), By Glass Type 2022(E)-2032(F)
Table 67: Asia Pacific Glass Vials Market Historic Volume (Units), By Glass Type 2015(H)-2021(A)
Table 68: Asia Pacific Glass Vials Market Forecast Volume (Units), By Glass Type 2022(E)-2032(F)
Table 69: Asia Pacific Glass Vials Market Historic Value (US$ Bn), By Capacity 2015(H)-2021(A)
Table 70: Asia Pacific Glass Vials Market Forecast Value (US$ Bn), By Capacity 2022(E)-2032(F)
Table 71: Asia Pacific Glass Vials Market Historic Volume (Units), By Capacity 2015(H)-2021(A)
Table 72: Asia Pacific Glass Vials Market Forecast Volume (Units), By Capacity 2022(E)-2032(F)
Table 73: Asia Pacific Glass Vials Market Historic Value (US$ Bn), By End Use 2015(H)-2021(A)
Table 74: Asia Pacific Glass Vials Market Forecast Value (US$ Bn), By End Use 2022(E)-2032(F)
Table 75: Asia Pacific Glass Vials Market Historic Volume (Units), By End Use 2015(H)-2021(A)
Table 76: Asia Pacific Glass Vials Market Forecast Volume (Units), By End Use 2022(E)-2032(F)
Table 77: Asia Pacific Glass Vials Market Historic Value (US$ Bn), By Country 2015(H)-2021(A)
Table 78: Asia Pacific Glass Vials Market Forecast Value (US$ Bn), By Country 2022(E)-2032(F)
Table 79: Asia Pacific Glass Vials Market Historic Volume (Units), By Country 2015(H)-2021(A)
Table 80: Asia Pacific Glass Vials Market Forecast Volume (Units), By Country 2022(E)-2032(F)
Table 81: MEA Glass Vials Market Historic Value (US$ Bn), By Glass Type 2015(H)-2021(A)
Table 82: MEA Glass Vials Market Forecast Value (US$ Bn), By Glass Type 2022(E)-2032(F)
Table 83: MEA Glass Vials Market Historic Volume (Units), By Glass Type 2015(H)-2021(A)
Table 84: MEA Glass Vials Market Forecast Volume (Units), By Glass Type 2022(E)-2032(F)
Table 85: MEA Glass Vials Market Historic Value (US$ Bn), By Capacity 2015(H)-2021(A)
Table 86: MEA Glass Vials Market Forecast Value (US$ Bn), By Capacity 2022(E)-2032(F)
Table 87: MEA Glass Vials Market Historic Volume (Units), By Capacity 2015(H)-2021(A)
Table 88: MEA Glass Vials Market Forecast Volume (Units), By Capacity 2022(E)-2032(F)
Table 89: MEA Glass Vials Market Historic Value (US$ Bn), By End Use 2015(H)-2021(A)
Table 90: MEA Glass Vials Market Forecast Value (US$ Bn), By End Use 2022(E)-2032(F)
Table 91: MEA Glass Vials Market Historic Volume (Units), By End Use 2015(H)-2021(A)
Table 92: MEA Glass Vials Market Forecast Volume (Units), By End Use 2022(E)-2032(F)
Table 93: MEA Glass Vials Market Historic Value (US$ Bn), By Country 2015(H)-2021(A)
Table 94: MEA Glass Vials Market Forecast Value (US$ Bn), By Country 2022(E)-2032(F)
Table 95: MEA Glass Vials Market Historic Volume (Units), By Country 2015(H)-2021(A)
Table 96: MEA Glass Vials Market Forecast Volume (Units), By Country 2022(E)-2032(F)
List of Figures
Figure 01: Global Glass Vials Market Share Analysis by Glass Type, 2022E & 2032F
Figure 02: Global Glass Vials Market Attractiveness Analysis by Glass Type, 2022E-2032F
Figure 03: Global Glass Vials Market Y-o-Y Analysis by Glass Type, 2015H-2032F
Figure 04: Global Glass Vials Market Share Analysis by Capacity, 2022E & 2032F
Figure 05: Global Glass Vials Market Attractiveness Analysis by Capacity, 2022E-2032F
Figure 06: Global Glass Vials Market Y-o-Y Analysis by Capacity, 2015H-2032F
Figure 07: Global Glass Vials Market Share Analysis by End Use, 2022E & 2032F
Figure 08: Global Glass Vials Market Attractiveness Analysis by End Use, 2022E-2032F
Figure 09: Global Glass Vials Market Y-o-Y Analysis by End Use, 2015H-2032F
Figure 10: Global Glass Vials Market Share Analysis by Region, 2022E & 2032F
Figure 11: Global Glass Vials Market Attractiveness Analysis by Region, 2022E-2032F
Figure 12: Global Glass Vials Market Y-o-Y Analysis by Region, 2015H-2032F
Figure 13: North America Glass Vials Market Share Analysis by Glass Type, 2022E & 2032F
Figure 14: North America Glass Vials Market Value Share Analysis by Capacity 2022(E)
Figure 15: North America Glass Vials Market Attractiveness Analysis by End Use, 2022E-2032F
Figure 16: North America Glass Vials Market Value Share Analysis by Country 2022(E)
Figure 17: Latin America Glass Vials Market Share Analysis by Glass Type, 2022E & 2032F
Figure 18: Latin America Glass Vials Market Value Share Analysis by Capacity 2022(E)
Figure 19: Latin America Glass Vials Market Attractiveness Analysis by End Use, 2022E-2032F
Figure 20: Latin America Glass Vials Market Value Share Analysis by Country 2022(E)
Figure 21: Europe Glass Vials Market Share Analysis by Glass Type, 2022E & 2032F
Figure 22: Europe Glass Vials Market Value Share Analysis by Capacity 2022(E)
Figure 23: Europe Glass Vials Market Attractiveness Analysis by End Use, 2022E-2032F
Figure 24: Europe Glass Vials Market Value Share Analysis by Country 2022(E)
Figure 25: Asia Pacific Glass Vials Market Share Analysis by Glass Type, 2022E & 2032F
Figure 26: Asia Pacific Glass Vials Market Value Share Analysis by Capacity 2022(E)
Figure 27: Asia Pacific Glass Vials Market Attractiveness Analysis by End Use, 2022E-2032F
Figure 28: Asia Pacific Glass Vials Market Value Share Analysis by Country 2022(E)
Figure 29: MEA Glass Vials Market Share Analysis by Glass Type, 2022E & 2032F
Figure 30: MEA Glass Vials Market Value Share Analysis by Capacity 2022(E)
Figure 31: MEA Glass Vials Market Attractiveness Analysis by End Use, 2022E-2032F
Figure 32: MEA Glass Vials Market Value Share Analysis by Country 2022(E)
Figure 33: U.S. Glass Vials Market Value Share Analysis, by Glass Type, 2022E & 2032F
Figure 34: U.S. Glass Vials Market Value Share Analysis, by Capacity, 2022E
Figure 35: U.S. Glass Vials Market Value Share Analysis, by End Use, 2022E & 2032F
Figure 36: Canada Glass Vials Market Value Share Analysis, by Glass Type, 2022E & 2032F
Figure 37: Canada Glass Vials Market Value Share Analysis, by Capacity, 2022E
Figure 38: Canada Glass Vials Market Value Share Analysis, by End Use, 2022E & 2032F
Figure 39: Brazil Glass Vials Market Value Share Analysis, by Glass Type, 2022E & 2032F
Figure 40: Brazil Glass Vials Market Value Share Analysis, by Capacity, 2022E
Figure 41: Brazil Glass Vials Market Value Share Analysis, by End Use, 2022E & 2032F
Figure 42: Mexico Glass Vials Market Value Share Analysis, by Glass Type, 2022E & 2032F
Figure 43: Mexico Glass Vials Market Value Share Analysis, by Capacity, 2022E
Figure 44: Mexico Glass Vials Market Value Share Analysis, by End Use, 2022E & 2032F
Figure 45: Germany Glass Vials Market Value Share Analysis, by Glass Type, 2022E & 2032F
Figure 46: Germany Glass Vials Market Value Share Analysis, by Capacity, 2022E
Figure 47: Germany Glass Vials Market Value Share Analysis, by End Use, 2022E & 2032F
Figure 48: Spain Glass Vials Market Value Share Analysis, by Glass Type, 2022E & 2032F
Figure 49: Spain Glass Vials Market Value Share Analysis, by Capacity, 2022E
Figure 50: Spain Glass Vials Market Value Share Analysis, by End Use, 2022E & 2032F
Figure 51: France Glass Vials Market Value Share Analysis, by Glass Type, 2022E & 2032F
Figure 52: France Glass Vials Market Value Share Analysis, by Capacity, 2022E
Figure 53: France Glass Vials Market Value Share Analysis, by End Use, 2022E & 2032F
Figure 54: U.K. Glass Vials Market Value Share Analysis, by Glass Type, 2022E & 2032F
Figure 55: U.K. Glass Vials Market Value Share Analysis, by Capacity, 2022E
Figure 56: U.K. Glass Vials Market Value Share Analysis, by End Use, 2022E & 2032F
Figure 57: Italy Glass Vials Market Value Share Analysis, by Glass Type, 2022E & 2032F
Figure 58: Italy Glass Vials Market Value Share Analysis, by Capacity, 2022E
Figure 59: Italy Glass Vials Market Value Share Analysis, by End Use, 2022E & 2032F
Figure 60: Russia Glass Vials Market Value Share Analysis, by Glass Type, 2022E & 2032F
Figure 61: Russia Glass Vials Market Value Share Analysis, by Capacity, 2022E
Figure 62: Russia Glass Vials Market Value Share Analysis, by End Use, 2022E & 2032F
Figure 63: China Glass Vials Market Value Share Analysis, by Glass Type, 2022E & 2032F
Figure 64: China Glass Vials Market Value Share Analysis, by Capacity, 2022E
Figure 65: China Glass Vials Market Value Share Analysis, by End Use, 2022E & 2032F
Figure 66: India Glass Vials Market Value Share Analysis, by Glass Type, 2022E & 2032F
Figure 67: India Glass Vials Market Value Share Analysis, by Capacity, 2022E
Figure 68: India Glass Vials Market Value Share Analysis, by End Use, 2022E & 2032F
Figure 69: Japan Glass Vials Market Value Share Analysis, by Glass Type, 2022E & 2032F
Figure 70: Japan Glass Vials Market Value Share Analysis, by Capacity, 2022E
Figure 71: Japan Glass Vials Market Value Share Analysis, by End Use, 2022E & 2032F
Figure 72: GCC Countries Glass Vials Market Value Share Analysis, by Glass Type, 2022E & 2032F
Figure 73: GCC Countries Glass Vials Market Value Share Analysis, by Capacity, 2022E
Figure 74: GCC Countries Glass Vials Market Value Share Analysis, by End Use, 2022E & 2032F
Figure 75: South Africa Glass Vials Market Value Share Analysis, by Glass Type, 2022E & 2032F
Figure 76: South Africa Glass Vials Market Value Share Analysis, by Capacity, 2022E
Figure 77: South Africa Glass Vials Market Value Share Analysis, by End Use, 2022E & 2032F
Copyright © Transparency Market Research, Inc. All Rights reserved
Trust Online

Glass Vials Market