
Reports
Reports
In the present times, one of the key concerns in the food & beverages industry is prevention of food wastage. Hence, manufacturers in the functional and barrier coatings for paper market are developing innovative barrier papers that help to reduce food wastage. For instance, Mitsubishi Hitec Paper Europe - a provider of specialty papers has gained expertise in ‘barricote barrier’ that are unique barrier papers extensively used in flexible packaging.
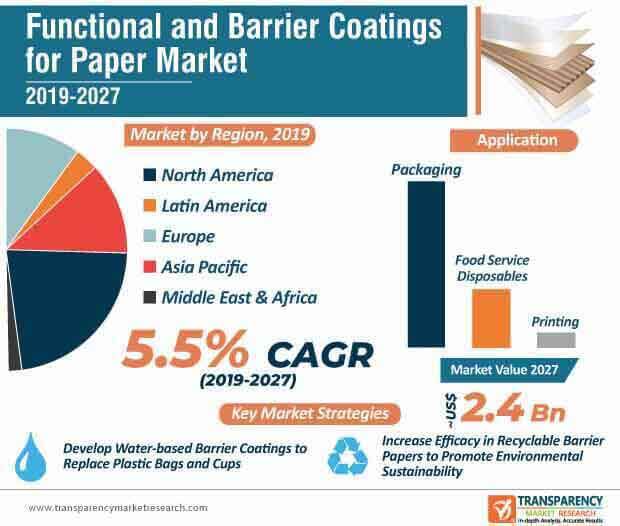
In terms of end use, the food segment of the functional and barrier coatings for paper market is estimated to reach an output of ~482,900 tons by the end of 2027. Thus, it is inevitable for manufacturers in the functional and barrier coatings for paper market to gain increased expertise in sustainable raw materials that prevent food wastage.
Unique barrier papers are gaining popularity for protection against vapor, aroma, and mineral oil migration. Companies in the functional and barrier coatings for paper market are increasing production capacities to produce fully recyclable barrier papers.
Companies in the functional and barrier coatings for paper market are looking beyond linear economy models, and are increasing efforts to fight plastic waste. For instance, Japanese manufacturer of materials, Kuraray, revealed that the company is aiming to fight plastic waste by introducing environment-friendly packaging with barrier coatings, such as EXCEVAL™ to increase the availability of packaging solutions for the paper industry.
Since plastic is causing strain on the environment, manufacturers in the functional and barrier coatings for paper market are introducing innovative packaging materials to address this issue. The aim to achieve reusable and recyclable plastic packaging by 2030 in the European Union is garnering the attention of manufacturers in the functional and barrier coatings for paper market. Thus, to create solutions in the current scenario, manufacturers are leveraging the advantages of specialty papers to contribute toward environment-friendly packaging solutions. Manufacturers in the functional and barrier coatings for paper market are increasing research efforts to develop high-performance barrier coatings using copolymers as a potential alternative to conventional plastic materials.
Repulpable paper packaging is another concern for manufacturers in the functional and barrier coatings for paper market. Renewed focus on paper materials has increased awareness about eco-friendly fiber-based solutions that are replacing plastic straws, disposable cups, bottles, and the likes. Companies in the functional and barrier coatings for paper market are increasing their efficacy in technologies that replace paraffin wax in paper materials and are exploring techniques that replace fluorocarbon for grease barriers in food-service applications.
Companies in the functional and barrier coatings for paper market are introducing novel materials such as barrier biowaxes that are not only used in food and beverages but also in other applications. They are streamlining their production activities to produce final system designs consisting of one to three different coatings that serve different functions, as per the end producers’ requirements. The trend of fiber-based materials is gaining the attention of manufacturers in order to contribute toward the development of repulpable paper materials.
The functional and barrier coatings for paper market is largely fragmented, since tier 2 regional and local companies account for ~70-75% of the market share. Thus, leading players are facing tough competition from emerging players. However, lack of clarity and understanding toward regulations pose as a challenge for market players. For instance, Asia Pacific accounts for the share of the functional and barrier coatings for paper market. India being one of the fastest growing economies in Asia Pacific faces challenges when it comes to compliance with regulations. This phenomenon has stunted the pace of innovation in India functional and barrier coatings for paper market.
In order to increase awareness about regulations in the India functional and barrier coatings for paper market, manufacturers are leading by example and are increasing R&D to develop water-based barrier coatings to promote sustainability. These novel innovations are replacing conventional plastic bags and cups.
Analysts’ Viewpoint
Sustainability, recyclability, and repulpable paper packaging are some of the key focus points for manufacturers in the functional and barrier coatings for paper market. Groundbreaking innovations include the introduction of bio-based barrier coating solutions, predominantly made for paper cups.
However, recycling in developing and developed economies, such as the U.S., only sum up to a fraction of the millions of single-use paper cups that are disposed daily worldwide. Hence, manufacturers should introduce biodegradable paper cups and increase awareness about importance and need for recycling.
Companies should participate in trade fairs to showcase their innovations in functional and barrier coatings for paper and bolster their credibility credential in the global market landscape.
1. Executive Summary
1.1. Market Overview
1.2. Market Analysis
1.3. TMR Analysis and Recommendations
1.4. Wheel of Opportunity
2. Market Introduction
2.1. Market Definition
2.2. Market Taxonomy
3. Market Viewpoint
3.1. Global Economic Outlook
3.2. Global Packaging Industry Outlook
3.3. Porters Five Forces Analysis
3.4. PESTLE Analysis for Key Countries
3.5. Key Trends Elaborating Features of Coated Paper
3.5.1. Food Contact Compliance
3.5.2. Water Resistance
3.5.3. Oil & Grease Resistant
3.5.4. Moisture Resistance
3.5.5. Abrasion Resistance
3.6. Macro-Economic Factors and Co-relation Analysis
3.6.1. Evolution and Advancement in Manufacturing Technology
3.6.2. Evolution and Advancement in Material Capabilities
3.6.3. Exports and Imports Scenario
3.6.4. Manufacturing Sector Value Added
3.7. Forecast Factors – Relevance and Impact
3.8. Value Chain Analysis
3.8.1. Exhaustive List of Active Participants
3.8.1.1. Raw Material Suppliers
3.8.1.2. Manufacturers
3.8.1.3. Distributors/End Users
3.8.2. Profitability Margins
3.9. Cost Teardown Analysis
3.10. Market Dynamics
3.10.1. Drivers
3.10.1.1. Supply Side
3.10.1.2. Demand Side
3.10.2. Restraints
3.10.3. Opportunities
4. Functional and Barrier Coating for Paper Market Analysis
4.1. Pricing Analysis
4.1.1. Pricing Assumption
4.1.2. Price Projections By Region
4.2. Market Value (US$ Mn) and Volume (Tonnes) Analysis & Forecast
4.3. Y-o-Y Growth Projections
4.4. Absolute $ Opportunity Analysis
5. Global Functional and Barrier Coating for Paper Analysis and Forecast, By Coating Type
5.1. Section Summary
5.2. Introduction
5.2.1. Market share and Basis Points (BPS) Analysis By Coating Type
5.2.2. Y-o-Y Growth Projections By Coating Type
5.3. Historical Market Size (US$ Mn) and Volume (Tonnes) Analysis 2014-2018 By Coating Type
5.3.1. Wax Coating
5.3.1.1. Natural Wax
5.3.1.2. Synthetic Wax
5.3.2. Poly Coating
5.3.2.1. Epoxy
5.3.2.2. Vinyl
5.3.2.3. Phenolic
5.3.2.4. Acrylic
5.3.2.5. Others (Polyester, Polyolefin, etc.)
5.3.3. Pigment Coating
5.3.4. UV Coating
5.4. Market Size (US$ Mn) and Volume (Tonnes) Forecast 2019-2027, By Coating Type
5.4.1. Wax Coating
5.4.1.1. Natural Wax
5.4.1.2. Synthetic Wax
5.4.2. Poly Coating
5.4.2.1. Epoxy
5.4.2.2. Vinyl
5.4.2.3. Phenolic
5.4.2.4. Acrylic
5.4.2.5. Others (Polyester, Polyolefin, etc.)
5.4.3. Pigment Coating
5.4.4. UV Coating
5.5. Market Attractiveness Analysis By Coating Type
6. Global Functional and Barrier Coating for Paper Analysis and Forecast, By Application
6.1. Section Summary
6.2. Introduction
6.2.1. Market share and Basis Points (BPS) Analysis By Application
6.2.2. Y-o-Y Growth Projections By Application
6.3. Historical Market Size (US$ Mn) and Volume (Tonnes) Analysis 2014-2018 By Application
6.3.1. Printing
6.3.1.1. Banknotes
6.3.1.2. Passport & Visa Paper
6.3.1.3. Lottery & Gaming Paper
6.3.1.4. Stamp Paper
6.3.1.5. Ticket & Voucher Paper
6.3.2. Packaging
6.3.2.1. Corrugated Boxes
6.3.2.2. Folding Cartons
6.3.2.3. Labels & Tags
6.3.3. Food Service Disposables
6.3.3.1. Plates
6.3.3.2. Cups & Glass
6.3.3.3. Trays & Clamshell
6.3.3.4. Bowls & Tubs
6.4. Market Size (US$ Mn) and Volume (Tonnes) Forecast 2019-2027, By Application
6.4.1. Printing
6.4.1.1. Banknotes
6.4.1.2. Passport & Visa Paper
6.4.1.3. Lottery & Gaming Paper
6.4.1.4. Stamp Paper
6.4.1.5. Ticket & Voucher Paper
6.4.2. Packaging
6.4.2.1. Corrugated Boxes
6.4.2.2. Folding Cartons
6.4.2.3. Labels & Tags
6.4.3. Food Service Disposables
6.4.3.1. Plates
6.4.3.2. Cups & Glass
6.4.3.3. Trays & Clamshell
6.4.3.4. Bowls & Tubs
6.5. Market Attractiveness Analysis By Application
7. Global Functional and Barrier Coating for Paper Analysis and Forecast, By End Use
7.1. Section Summary
7.2. Introduction
7.2.1. Market share and Basis Points (BPS) Analysis By End Use
7.2.2. Y-o-Y Growth Projections By End Use
7.3. Historical Market Size (US$ Mn) and Volume (Tonnes) Analysis 2014-2018 By End Use
7.3.1. Food
7.3.1.1. Meat, Seafood & Poultry
7.3.1.2. Dairy Products
7.3.1.3. Fruits and Vegetables
7.3.1.4. Soups and Sauces
7.3.1.5. Ready to Eat Meals
7.3.1.6. Other Food Products
7.3.2. Beverages
7.3.3. Pharmaceuticals
7.3.4. Homecare & Toiletries
7.3.5. Personal Care & Cosmetics
7.3.6. Banking & Financial Institutions
7.4. Market Size (US$ Mn) and Volume (Tonnes) Forecast 2019-2027, By End Use
7.4.1. Food
7.4.1.1. Meat, Seafood & Poultry
7.4.1.2. Dairy Products
7.4.1.3. Fruits and Vegetables
7.4.1.4. Soups and Sauces
7.4.1.5. Ready to Eat Meals
7.4.1.6. Other Food Products
7.4.2. Beverages
7.4.3. Pharmaceuticals
7.4.4. Homecare & Toiletries
7.4.5. Personal Care & Cosmetics
7.4.6. Banking & Financial Institutions
7.5. Market Attractiveness Analysis By End Use
8. Global Functional and Barrier Coating for Paper Market Analysis and Forecast, By Region
8.1. Section Summary
8.2. Introduction
8.2.1. Market share and Basis Points (BPS) Analysis By Region
8.2.2. Y-o-Y Growth Projections By Region
8.3. Historical Market Size (US$ Mn) and Volume (Tonnes) Analysis 2014-2018 By Region
8.3.1. North America
8.3.2. Latin America
8.3.3. Europe
8.3.4. Asia Pacific (APAC)
8.3.5. Middle East and Africa (MEA)
8.4. Market Size (US$ Mn) and Volume (Tonnes) Forecast 2019-2027 By Region
8.4.1. North America
8.4.2. Latin America
8.4.3. Europe
8.4.4. Asia Pacific (APAC)
8.4.5. Middle East and Africa (MEA)
8.5. Market Attractiveness Analysis By Region
9. North America Functional and Barrier Coating for Paper Market Analysis and Forecast
9.1. Section Summary
9.2. Introduction
9.2.1. Market share and Basis Points (BPS) Analysis By Country
9.2.2. Y-o-Y Growth Projections By Country
9.3. Historical Market Size (US$ Mn) and Volume (Tonnes) Analysis 2014-2018 By Country
9.3.1. U.S.
9.3.2. Canada
9.4. Market Size (US$ Mn) and Volume (Tonnes) Forecast 2019-2027 By Country
9.4.1. U.S.
9.4.2. Canada
9.5. Historical Market Size (US$ Mn) and Volume (Tonnes) Analysis 2014-2018 By Coating Type
9.5.1. Wax Coating
9.5.1.1. Natural Wax
9.5.1.2. Synthetic Wax
9.5.2. Poly Coating
9.5.2.1. Epoxy
9.5.2.2. Vinyl
9.5.2.3. Phenolic
9.5.2.4. Acrylic
9.5.2.5. Others (Polyester, Polyolefin, etc.)
9.5.3. Pigment Coating
9.5.4. UV Coating
9.6. Market Size (US$ Mn) and Volume (Tonnes) Forecast 2019-2027, By Coating Type
9.6.1. Wax Coating
9.6.1.1. Natural Wax
9.6.1.2. Synthetic Wax
9.6.2. Poly Coating
9.6.2.1. Epoxy
9.6.2.2. Vinyl
9.6.2.3. Phenolic
9.6.2.4. Acrylic
9.6.2.5. Others (Polyester, Polyolefin, etc.)
9.6.3. Pigment Coating
9.6.4. UV Coating
9.7. Historical Market Size (US$ Mn) and Volume (Tonnes) Analysis 2014-2018 By Application
9.7.1. Printing
9.7.1.1. Banknotes
9.7.1.2. Passport & Visa Paper
9.7.1.3. Lottery & Gaming Paper
9.7.1.4. Stamp Paper
9.7.1.5. Ticket & Voucher Paper
9.7.2. Packaging
9.7.2.1. Corrugated Boxes
9.7.2.2. Folding Cartons
9.7.2.3. Labels & Tags
9.7.3. Food Service Disposables
9.7.3.1. Plates
9.7.3.2. Cups & Glass
9.7.3.3. Trays & Clamshell
9.7.3.4. Bowls & Tubs
9.8. Market Size (US$ Mn) and Volume (Tonnes) Forecast 2019-2027, By Application
9.8.1. Printing
9.8.1.1. Banknotes
9.8.1.2. Passport & Visa Paper
9.8.1.3. Lottery & Gaming Paper
9.8.1.4. Stamp Paper
9.8.1.5. Ticket & Voucher Paper
9.8.2. Packaging
9.8.2.1. Corrugated Boxes
9.8.2.2. Folding Cartons
9.8.2.3. Labels & Tags
9.8.3. Food Service Disposables
9.8.3.1. Plates
9.8.3.2. Cups & Glass
9.8.3.3. Trays & Clamshell
9.8.3.4. Bowls & Tubs
9.9. Historical Market Size (US$ Mn) and Volume (Tonnes) Analysis 2014-2018 By End Use
9.9.1. Food
9.9.1.1. Meat, Seafood & Poultry
9.9.1.2. Dairy Products
9.9.1.3. Fruits and Vegetables
9.9.1.4. Soups and Sauces
9.9.1.5. Ready to Eat Meals
9.9.1.6. Other Food Products
9.9.2. Beverages
9.9.3. Pharmaceuticals
9.9.4. Homecare & Toiletries
9.9.5. Personal Care & Cosmetics
9.9.6. Banking & Financial Institutions
9.10. Market Size (US$ Mn) and Volume (Tonnes) Forecast 2019-2027, By End Use
9.10.1. Food
9.10.1.1. Meat, Seafood & Poultry
9.10.1.2. Dairy Products
9.10.1.3. Fruits and Vegetables
9.10.1.4. Soups and Sauces
9.10.1.5. Ready to Eat Meals
9.10.1.6. Other Food Products
9.10.2. Beverages
9.10.3. Pharmaceuticals
9.10.4. Homecare & Toiletries
9.10.5. Personal Care & Cosmetics
9.10.6. Banking & Financial Institutions
9.11. Key Market Participants – Intensity Mapping
10. Latin America Functional and Barrier Coating for Paper Market Analysis and Forecast
10.1. Section Summary
10.2. Introduction
10.2.1. Market share and Basis Points (BPS) Analysis By Country
10.2.2. Y-o-Y Growth Projections By Country
10.3. Historical Market Size (US$ Mn) and Volume (Tonnes) Analysis 2014-2018 By Country
10.3.1. Brazil
10.3.2. Mexico
10.3.3. Argentina
10.3.4. Rest of Latin America
10.4. Market Size (US$ Mn) and Volume (Tonnes) Forecast 2019-2027By Country
10.4.1. Brazil
10.4.2. Mexico
10.4.3. Argentina
10.4.4. Rest of Latin America
10.5. Historical Market Size (US$ Mn) and Volume (Tonnes) Analysis 2014-2018 By Coating Type
10.5.1. Wax Coating
10.5.1.1. Natural Wax
10.5.1.2. Synthetic Wax
10.5.2. Poly Coating
10.5.2.1. Epoxy
10.5.2.2. Vinyl
10.5.2.3. Phenolic
10.5.2.4. Acrylic
10.5.2.5. Others (Polyester, Polyolefin, etc.)
10.5.3. Pigment Coating
10.5.4. UV Coating
10.6. Market Size (US$ Mn) and Volume (Tonnes) Forecast 2019-2027, By Coating Type
10.6.1. Wax Coating
10.6.1.1. Natural Wax
10.6.1.2. Synthetic Wax
10.6.2. Poly Coating
10.6.2.1. Epoxy
10.6.2.2. Vinyl
10.6.2.3. Phenolic
10.6.2.4. Acrylic
10.6.2.5. Others (Polyester, Polyolefin, etc.)
10.6.3. Pigment Coating
10.6.4. UV Coating
10.7. Historical Market Size (US$ Mn) and Volume (Tonnes) Analysis 2014-2018 By Application
10.7.1. Printing
10.7.1.1. Banknotes
10.7.1.2. Passport & Visa Paper
10.7.1.3. Lottery & Gaming Paper
10.7.1.4. Stamp Paper
10.7.1.5. Ticket & Voucher Paper
10.7.2. Packaging
10.7.2.1. Corrugated Boxes
10.7.2.2. Folding Cartons
10.7.2.3. Labels & Tags
10.7.3. Food Service Disposables
10.7.3.1. Plates
10.7.3.2. Cups & Glass
10.7.3.3. Trays & Clamshell
10.7.3.4. Bowls & Tubs
10.8. Market Size (US$ Mn) and Volume (Tonnes) Forecast 2019-2027, By Application
10.8.1. Printing
10.8.1.1. Banknotes
10.8.1.2. Passport & Visa Paper
10.8.1.3. Lottery & Gaming Paper
10.8.1.4. Stamp Paper
10.8.1.5. Ticket & Voucher Paper
10.8.2. Packaging
10.8.2.1. Corrugated Boxes
10.8.2.2. Folding Cartons
10.8.2.3. Labels & Tags
10.8.3. Food Service Disposables
10.8.3.1. Plates
10.8.3.2. Cups & Glass
10.8.3.3. Trays & Clamshell
10.8.3.4. Bowls & Tubs
10.9. Historical Market Size (US$ Mn) and Volume (Tonnes) Analysis 2014-2018 By End Use
10.9.1. Food
10.9.1.1. Meat, Seafood & Poultry
10.9.1.2. Dairy Products
10.9.1.3. Fruits and Vegetables
10.9.1.4. Soups and Sauces
10.9.1.5. Ready to Eat Meals
10.9.1.6. Other Food Products
10.9.2. Beverages
10.9.3. Pharmaceuticals
10.9.4. Homecare & Toiletries
10.9.5. Personal Care & Cosmetics
10.9.6. Banking & Financial Institutions
10.10. Market Size (US$ Mn) and Volume (Tonnes) Forecast 2019-2027, By End Use
10.10.1. Food
10.10.1.1. Meat, Seafood & Poultry
10.10.1.2. Dairy Products
10.10.1.3. Fruits and Vegetables
10.10.1.4. Soups and Sauces
10.10.1.5. Ready to Eat Meals
10.10.1.6. Other Food Products
10.10.2. Beverages
10.10.3. Pharmaceuticals
10.10.4. Homecare & Toiletries
10.10.5. Personal Care & Cosmetics
10.10.6. Banking & Financial Institutions
10.11. Key Market Participants – Intensity Mapping
11. Europe Functional and Barrier Coating for Paper Market Analysis and Forecast
11.1. Section Summary
11.2. Introduction
11.2.1. Market share and Basis Points (BPS) Analysis By Country
11.2.2. Y-o-Y Growth Projections By Country
11.3. Historical Market Size (US$ Mn) and Volume (Tonnes) Analysis 2014-2018 By Country
11.3.1. Germany
11.3.2. Spain
11.3.3. Italy
11.3.4. France
11.3.5. U.K.
11.3.6. BENELUX
11.3.7. NORDIC
11.3.8. Russia
11.3.9. Poland
11.3.10. Rest of Europe
11.4. Market Size (US$ Mn) and Volume (Tonnes) Forecast 2019-2027By Country
11.4.1. Germany
11.4.2. Spain
11.4.3. Italy
11.4.4. France
11.4.5. U.K.
11.4.6. BENELUX
11.4.7. NORDIC
11.4.8. Russia
11.4.9. Poland
11.4.10. Rest of Europe
11.5. Historical Market Size (US$ Mn) and Volume (Tonnes) Analysis 2014-2018 By Coating Type
11.5.1. Wax Coating
11.5.1.1. Natural Wax
11.5.1.2. Synthetic Wax
11.5.2. Poly Coating
11.5.2.1. Epoxy
11.5.2.2. Vinyl
11.5.2.3. Phenolic
11.5.2.4. Acrylic
11.5.2.5. Others (Polyester, Polyolefin, etc.)
11.5.3. Pigment Coating
11.5.4. UV Coating
11.6. Market Size (US$ Mn) and Volume (Tonnes) Forecast 2019-2027, By Coating Type
11.6.1. Wax Coating
11.6.1.1. Natural Wax
11.6.1.2. Synthetic Wax
11.6.2. Poly Coating
11.6.2.1. Epoxy
11.6.2.2. Vinyl
11.6.2.3. Phenolic
11.6.2.4. Acrylic
11.6.2.5. Others (Polyester, Polyolefin, etc.)
11.6.3. Pigment Coating
11.6.4. UV Coating
11.7. Historical Market Size (US$ Mn) and Volume (Tonnes) Analysis 2014-2018 By Application
11.7.1. Printing
11.7.1.1. Banknotes
11.7.1.2. Passport & Visa Paper
11.7.1.3. Lottery & Gaming Paper
11.7.1.4. Stamp Paper
11.7.1.5. Ticket & Voucher Paper
11.7.2. Packaging
11.7.2.1. Corrugated Boxes
11.7.2.2. Folding Cartons
11.7.2.3. Labels & Tags
11.7.3. Food Service Disposables
11.7.3.1. Plates
11.7.3.2. Cups & Glass
11.7.3.3. Trays & Clamshell
11.7.3.4. Bowls & Tubs
11.8. Market Size (US$ Mn) and Volume (Tonnes) Forecast 2019-2027, By Application
11.8.1. Printing
11.8.1.1. Banknotes
11.8.1.2. Passport & Visa Paper
11.8.1.3. Lottery & Gaming Paper
11.8.1.4. Stamp Paper
11.8.1.5. Ticket & Voucher Paper
11.8.2. Packaging
11.8.2.1. Corrugated Boxes
11.8.2.2. Folding Cartons
11.8.2.3. Labels & Tags
11.8.3. Food Service Disposables
11.8.3.1. Plates
11.8.3.2. Cups & Glass
11.8.3.3. Trays & Clamshell
11.8.3.4. Bowls & Tubs
11.9. Historical Market Size (US$ Mn) and Volume (Tonnes) Analysis 2014-2018 By End Use
11.9.1. Food
11.9.1.1. Meat, Seafood & Poultry
11.9.1.2. Dairy Products
11.9.1.3. Fruits and Vegetables
11.9.1.4. Soups and Sauces
11.9.1.5. Ready to Eat Meals
11.9.1.6. Other Food Products
11.9.2. Beverages
11.9.3. Pharmaceuticals
11.9.4. Homecare & Toiletries
11.9.5. Personal Care & Cosmetics
11.9.6. Banking & Financial Institutions
11.10. Market Size (US$ Mn) and Volume (Tonnes) Forecast 2019-2027, By End Use
11.10.1. Food
11.10.1.1. Meat, Seafood & Poultry
11.10.1.2. Dairy Products
11.10.1.3. Fruits and Vegetables
11.10.1.4. Soups and Sauces
11.10.1.5. Ready to Eat Meals
11.10.1.6. Other Food Products
11.10.2. Beverages
11.10.3. Pharmaceuticals
11.10.4. Homecare & Toiletries
11.10.5. Personal Care & Cosmetics
11.10.6. Banking & Financial Institutions
11.11. Key Market Participants – Intensity Mapping
12. Asia Pacific Functional and Barrier Coating for Paper Market Analysis and Forecast
12.1. Section Summary
12.2. Introduction
12.2.1. Market share and Basis Points (BPS) Analysis By Country
12.2.2. Y-o-Y Growth Projections By Country
12.3. Historical Market Size (US$ Mn) and Volume (Tonnes) Analysis 2014-2018 By Country
12.3.1. China
12.3.2. India
12.3.3. Japan
12.3.4. ASEAN Countries
12.3.5. Australia and New Zealand
12.3.6. Rest of APAC
12.4. Market Size (US$ Mn) and Volume (Tonnes) Forecast 2019-2027 By Country
12.4.1. China
12.4.2. India
12.4.3. Japan
12.4.4. ASEAN Countries
12.4.5. Australia and New Zealand
12.4.6. Rest of APAC
12.5. Historical Market Size (US$ Mn) and Volume (Tonnes) Analysis 2014-2018 By Coating Type
12.5.1. Wax Coating
12.5.1.1. Natural Wax
12.5.1.2. Synthetic Wax
12.5.2. Poly Coating
12.5.2.1. Epoxy
12.5.2.2. Vinyl
12.5.2.3. Phenolic
12.5.2.4. Acrylic
12.5.2.5. Others (Polyester, Polyolefin, etc.)
12.5.3. Pigment Coating
12.5.4. UV Coating
12.6. Market Size (US$ Mn) and Volume (Tonnes) Forecast 2019-2027, By Coating Type
12.6.1. Wax Coating
12.6.1.1. Natural Wax
12.6.1.2. Synthetic Wax
12.6.2. Poly Coating
12.6.2.1. Epoxy
12.6.2.2. Vinyl
12.6.2.3. Phenolic
12.6.2.4. Acrylic
12.6.2.5. Others (Polyester, Polyolefin, etc.)
12.6.3. Pigment Coating
12.6.4. UV Coating
12.7. Historical Market Size (US$ Mn) and Volume (Tonnes) Analysis 2014-2018 By Application
12.7.1. Printing
12.7.1.1. Banknotes
12.7.1.2. Passport & Visa Paper
12.7.1.3. Lottery & Gaming Paper
12.7.1.4. Stamp Paper
12.7.1.5. Ticket & Voucher Paper
12.7.2. Packaging
12.7.2.1. Corrugated Boxes
12.7.2.2. Folding Cartons
12.7.2.3. Labels & Tags
12.7.3. Food Service Disposables
12.7.3.1. Plates
12.7.3.2. Cups & Glass
12.7.3.3. Trays & Clamshell
12.7.3.4. Bowls & Tubs
12.8. Market Size (US$ Mn) and Volume (Tonnes) Forecast 2019-2027, By Application
12.8.1. Printing
12.8.1.1. Banknotes
12.8.1.2. Passport & Visa Paper
12.8.1.3. Lottery & Gaming Paper
12.8.1.4. Stamp Paper
12.8.1.5. Ticket & Voucher Paper
12.8.2. Packaging
12.8.2.1. Corrugated Boxes
12.8.2.2. Folding Cartons
12.8.2.3. Labels & Tags
12.8.3. Food Service Disposables
12.8.3.1. Plates
12.8.3.2. Cups & Glass
12.8.3.3. Trays & Clamshell
12.8.3.4. Bowls & Tubs
12.9. Historical Market Size (US$ Mn) and Volume (Tonnes) Analysis 2014-2018 By End Use
12.9.1. Food
12.9.1.1. Meat, Seafood & Poultry
12.9.1.2. Dairy Products
12.9.1.3. Fruits and Vegetables
12.9.1.4. Soups and Sauces
12.9.1.5. Ready to Eat Meals
12.9.1.6. Other Food Products
12.9.2. Beverages
12.9.3. Pharmaceuticals
12.9.4. Homecare & Toiletries
12.9.5. Personal Care & Cosmetics
12.9.6. Banking & Financial Institutions
12.10. Market Size (US$ Mn) and Volume (Tonnes) Forecast 2019-2027, By End Use
12.10.1. Food
12.10.1.1. Meat, Seafood & Poultry
12.10.1.2. Dairy Products
12.10.1.3. Fruits and Vegetables
12.10.1.4. Soups and Sauces
12.10.1.5. Ready to Eat Meals
12.10.1.6. Other Food Products
12.10.2. Beverages
12.10.3. Pharmaceuticals
12.10.4. Homecare & Toiletries
12.10.5. Personal Care & Cosmetics
12.10.6. Banking & Financial Institutions
12.11. Key Market Participants – Intensity Mapping
13. Middle East and Africa Functional and Barrier Coating for Paper Market Analysis and Forecast
13.1. Section Summary
13.2. Introduction
13.2.1. Market share and Basis Points (BPS) Analysis By Country
13.2.2. Y-o-Y Growth Projections By Country
13.3. Historical Market Size (US$ Mn) and Volume (Tonnes) Analysis 2014-2018 By Country
13.3.1. GCC countries
13.3.2. Northern Africa
13.3.3. South Africa
13.3.4. Turkey
13.3.5. Rest of MEA
13.4. Market Size (US$ Mn) and Volume (Tonnes) Forecast 2019-2027 By Country
13.4.1. GCC countries
13.4.2. Northern Africa
13.4.3. South Africa
13.4.4. Turkey
13.4.5. Rest of MEA
13.5. Historical Market Size (US$ Mn) and Volume (Tonnes) Analysis 2014-2018 By Coating Type
13.5.1. Wax Coating
13.5.1.1. Natural Wax
13.5.1.2. Synthetic Wax
13.5.2. Poly Coating
13.5.2.1. Epoxy
13.5.2.2. Vinyl
13.5.2.3. Phenolic
13.5.2.4. Acrylic
13.5.2.5. Others (Polyester, Polyolefin, etc.)
13.5.3. Pigment Coating
13.5.4. UV Coating
13.6. Market Size (US$ Mn) and Volume (Tonnes) Forecast 2019-2027, By Coating Type
13.6.1. Wax Coating
13.6.1.1. Natural Wax
13.6.1.2. Synthetic Wax
13.6.2. Poly Coating
13.6.2.1. Epoxy
13.6.2.2. Vinyl
13.6.2.3. Phenolic
13.6.2.4. Acrylic
13.6.2.5. Others (Polyester, Polyolefin, etc.)
13.6.3. Pigment Coating
13.6.4. UV Coating
13.7. Historical Market Size (US$ Mn) and Volume (Tonnes) Analysis 2014-2018 By Application
13.7.1. Printing
13.7.1.1. Banknotes
13.7.1.2. Passport & Visa Paper
13.7.1.3. Lottery & Gaming Paper
13.7.1.4. Stamp Paper
13.7.1.5. Ticket & Voucher Paper
13.7.2. Packaging
13.7.2.1. Corrugated Boxes
13.7.2.2. Folding Cartons
13.7.2.3. Labels & Tags
13.7.3. Food Service Disposables
13.7.3.1. Plates
13.7.3.2. Cups & Glass
13.7.3.3. Trays & Clamshell
13.7.3.4. Bowls & Tubs
13.8. Market Size (US$ Mn) and Volume (Tonnes) Forecast 2019-2027, By Application
13.8.1. Printing
13.8.1.1. Banknotes
13.8.1.2. Passport & Visa Paper
13.8.1.3. Lottery & Gaming Paper
13.8.1.4. Stamp Paper
13.8.1.5. Ticket & Voucher Paper
13.8.2. Packaging
13.8.2.1. Corrugated Boxes
13.8.2.2. Folding Cartons
13.8.2.3. Labels & Tags
13.8.3. Food Service Disposables
13.8.3.1. Plates
13.8.3.2. Cups & Glass
13.8.3.3. Trays & Clamshell
13.8.3.4. Bowls & Tubs
13.9. Historical Market Size (US$ Mn) and Volume (Tonnes) Analysis 2014-2018 By End Use
13.9.1. Food
13.9.1.1. Meat, Seafood & Poultry
13.9.1.2. Dairy Products
13.9.1.3. Fruits and Vegetables
13.9.1.4. Soups and Sauces
13.9.1.5. Ready to Eat Meals
13.9.1.6. Other Food Products
13.9.2. Beverages
13.9.3. Pharmaceuticals
13.9.4. Homecare & Toiletries
13.9.5. Personal Care & Cosmetics
13.9.6. Banking & Financial Institutions
13.10. Market Size (US$ Mn) and Volume (Tonnes) Forecast 2019-2027, By End Use
13.10.1. Food
13.10.1.1. Meat, Seafood & Poultry
13.10.1.2. Dairy Products
13.10.1.3. Fruits and Vegetables
13.10.1.4. Soups and Sauces
13.10.1.5. Ready to Eat Meals
13.10.1.6. Other Food Products
13.10.2. Beverages
13.10.3. Pharmaceuticals
13.10.4. Homecare & Toiletries
13.10.5. Personal Care & Cosmetics
13.10.6. Banking & Financial Institutions
13.11. Key Market Participants – Intensity Mapping
14. Market Structure Analysis
14.1. Market Analysis, by Tier of Companies
14.2. Production Capacity Share Analysis
14.3. Market Presence Analysis
14.3.1. By Regional footprint of Players
14.3.2. Channel footprint by Players
15. Competitive Landscape
15.1. Competition Dashboard
15.2. Company Market Share Analysis
15.3. Market Tier Structure Analysis
15.4. Company Profiles (Details – Overview, Financials, Strategy, Recent Developments, SWOT analysis)
15.5. Competition Deep Dive
15.5.1. Paramelt B.V
15.5.1.1. Overview
15.5.1.2. Product Portfolio
15.5.1.3. Profitability
15.5.1.4. Production Footprint
15.5.1.5. Sales Footprint
15.5.1.6. Channel Footprint
15.5.1.7. Competition Benchmarking
15.5.1.8. Strategy
15.5.1.8.1. Marketing Strategy
15.5.1.8.2. Product Strategy
15.5.1.8.3. Channel Strategy
15.5.2. Cortec Corporation
15.5.2.1. Overview
15.5.2.2. Product Portfolio
15.5.2.3. Profitability
15.5.2.4. Production Footprint
15.5.2.5. Sales Footprint
15.5.2.6. Channel Footprint
15.5.2.7. Competition Benchmarking
15.5.2.8. Strategy
15.5.2.8.1. Marketing Strategy
15.5.2.8.2. Product Strategy
15.5.2.8.3. Channel Strategy
15.5.3. Sierra Coating Technologies LLC Overview
15.5.3.1. Product Portfolio
15.5.3.2. Profitability
15.5.3.3. Production Footprint
15.5.3.4. Sales Footprint
15.5.3.5. Channel Footprint
15.5.3.6. Competition Benchmarking
15.5.3.7. Strategy
15.5.3.7.1. Marketing Strategy
15.5.3.7.2. Product Strategy
15.5.3.7.3. Channel Strategy
15.5.3. Stora Enso Oyj
15.5.3.1. Overview
15.5.3.2. Product Portfolio
15.5.3.3. Profitability
15.5.3.4. Production Footprint
15.5.3.5. Sales Footprint
15.5.3.6. Channel Footprint
15.5.3.7. Competition Benchmarking
15.5.3.8. Strategy
15.5.3.8.1. Marketing Strategy
15.5.3.8.2. Product Strategy
15.5.3.8.3. Channel Strategy
15.5.4. Michelman, Inc.
15.5.4.1. Overview
15.5.4.2. Product Portfolio
15.5.4.3. Profitability
15.5.4.4. Production Footprint
15.5.4.5. Sales Footprint
15.5.4.6. Channel Footprint
15.5.4.7. Competition Benchmarking
15.5.4.8. Strategy
15.5.4.8.1. Marketing Strategy
15.5.4.8.2. Product Strategy
15.5.4.8.3. Channel Strategy
15.5.5. Coatings & Adhesives Corp
15.5.5.1. Overview
15.5.5.2. Product Portfolio
15.5.5.3. Profitability
15.5.5.4. Production Footprint
15.5.5.5. Sales Footprint
15.5.5.6. Channel Footprint
15.5.5.7. Competition Benchmarking
15.5.5.8. Strategy
15.5.5.8.1. Marketing Strategy
15.5.5.8.2. Product Strategy
15.5.5.8.3. Channel Strategy
15.5.6. Omnova Solutions Inc.
15.5.6.1. Overview
15.5.6.2. Product Portfolio
15.5.6.3. Profitability
15.5.6.4. Production Footprint
15.5.6.5. Sales Footprint
15.5.6.6. Channel Footprint
15.5.6.7. Competition Benchmarking
15.5.6.8. Strategy
15.5.6.8.1. Marketing Strategy
15.5.6.8.2. Product Strategy
15.5.6.8.3. Channel Strategy
15.5.7. Cattie Adhesive Solutions Llc
15.5.7.1. Overview
15.5.7.2. Product Portfolio
15.5.7.3. Profitability
15.5.7.4. Production Footprint
15.5.7.5. Sales Footprint
15.5.7.6. Channel Footprint
15.5.7.7. Competition Benchmarking
15.5.7.8. Strategy
15.5.7.8.1. Marketing Strategy
15.5.7.8.2. Product Strategy
15.5.7.8.3. Channel Strategy
15.5.8. SNP, Inc.
15.5.8.1. Overview
15.5.8.2. Product Portfolio
15.5.8.3. Profitability
15.5.8.4. Production Footprint
15.5.8.5. Sales Footprint
15.5.8.6. Channel Footprint
15.5.8.7. Competition Benchmarking
15.5.8.8. Strategy
15.5.8.8.1. Marketing Strategy
15.5.8.8.2. Product Strategy
15.5.8.8.3. Channel Strategy
15.5.9. ALTANA Group
15.5.9.1. Overview
15.5.9.2. Product Portfolio
15.5.9.3. Profitability
15.5.9.4. Production Footprint
15.5.9.5. Sales Footprint
15.5.9.6. Channel Footprint
15.5.9.7. Competition Benchmarking
15.5.9.8. Strategy
15.5.9.8.1. Marketing Strategy
15.5.9.8.2. Product Strategy
15.5.9.8.3. Channel Strategy
15.5.10. CH-Polymers Oy
15.5.10.1. Overview
15.5.10.2. Product Portfolio
15.5.10.3. Profitability
15.5.10.4. Production Footprint
15.5.10.5. Sales Footprint
15.5.10.6. Channel Footprint
15.5.10.7. Competition Benchmarking
15.5.10.8. Strategy
15.5.10.8.1. Marketing Strategy
15.5.10.8.2. Product Strategy
15.5.10.8.3. Channel Strategy
15.5.11. Sonoco Products Company
15.5.11.1. Overview
15.5.11.2. Product Portfolio
15.5.11.3. Profitability
15.5.11.4. Production Footprint
15.5.11.5. Sales Footprint
15.5.11.6. Channel Footprint
15.5.11.7. Competition Benchmarking
15.5.11.8. Strategy
15.5.11.8.1. Marketing Strategy
15.5.11.8.2. Product Strategy
15.5.11.8.3. Channel Strategy
15.5.12. Koninklijke DSM NV
15.5.12.1. Overview
15.5.12.2. Product Portfolio
15.5.12.3. Profitability
15.5.12.4. Production Footprint
15.5.12.5. Sales Footprint
15.5.12.6. Channel Footprint
15.5.12.7. Competition Benchmarking
15.5.12.8. Strategy
15.5.12.8.1. Marketing Strategy
15.5.12.8.2. Product Strategy
15.5.12.8.3. Channel Strategy
15.5.13. BASF S.E.
15.5.13.1. Overview
15.5.13.2. Product Portfolio
15.5.13.3. Profitability
15.5.13.4. Production Footprint
15.5.13.5. Sales Footprint
15.5.13.6. Channel Footprint
15.5.13.7. Competition Benchmarking
15.5.13.8. Strategy
15.5.13.8.1. Marketing Strategy
15.5.13.8.2. Product Strategy
15.5.13.8.3. Channel Strategy
15.5.14. Dow Chemical Company
15.5.14.1. Overview
15.5.14.2. Product Portfolio
15.5.14.3. Profitability
15.5.14.4. Production Footprint
15.5.14.5. Sales Footprint
15.5.14.6. Channel Footprint
15.5.14.7. Competition Benchmarking
15.5.14.8. Strategy
15.5.14.8.1. Marketing Strategy
15.5.14.8.2. Product Strategy
15.5.14.8.3. Channel Strategy
16. Assumptions and Acronyms
17. Research Methodology
List of Table
Table 01: Global Functional and Barrier Coatings for Paper Market Value (US$ Mn) and Volume (Thousand Tons) 2014-2027, By Coating Type
Table 02: Global Functional and Barrier Coatings for Paper Market Value (US$ Mn) and Volume (Thousand Tons) 2014-2027, By Coating Type
Table 03: Global Functional and Barrier Coatings for Paper Market Value (US$ Mn) and Volume (Thousand Tons) 2014-2027, By Application
Table 04: Global Functional and Barrier Coatings for Paper Market Value (US$ Mn) and Volume (Thousand Tons) 2014-2027, By Application
Table 05: Global Functional and Barrier Coatings for Paper Market Value (US$ Mn) and Volume (Thousand Tons) 2014-2027, By Application
Table 06: Global Functional and Barrier Coatings for Paper Market Value (US$ Mn) and Volume (Thousand Tons) 2014-2027, By End Use
Table 07: Global Functional and Barrier Coatings for Paper Market Value (US$ Mn) and Volume (Thousand Tons) 2014-2027, By End Use
Table 08: Global Functional and Barrier Coatings for Paper Market Value (US$ Mn) and Volume (Thousand Tons) 2014-2027, By Region
Table 09: North America Functional and Barrier Coatings for Paper Market Value (US$ Mn) and Volume (Thousand Tons) 2014-2027, By Country
Table 10: North America Functional and Barrier Coatings for Paper Market Value (US$ Mn) and Volume (Thousand Tons) 2014-2027, By Coating Type
Table 11: North America Functional and Barrier Coatings for Paper Market Value (US$ Mn) and Volume (Thousand Tons) 2014-2027, By Coating Type
Table 12: North America Functional and Barrier Coatings for Paper Market Value (US$ Mn) and Volume (Thousand Tons) 2014-2027, By Application
Table 13: North America Functional and Barrier Coatings for Paper Market Value (US$ Mn) and Volume (Thousand Tons) 2014-2027, By Application
Table 14: North America Functional and Barrier Coatings for Paper Market Value (US$ Mn) and Volume (Thousand Tons) 2014-2027, By Application
Table 15: North America Functional and Barrier Coatings for Paper Market Value (US$ Mn) and Volume (Thousand Tons) 2014-2027, By End Use
Table 16: North America Functional and Barrier Coatings for Paper Market Value (US$ Mn) and Volume (Thousand Tons) 2014-2027, By End Use
Table 17: Latin America Functional and Barrier Coatings for Paper Market Value (US$ Mn) and Volume (Thousand Tons) 2014-2027, By Country
Table 18: Latin America Functional and Barrier Coatings for Paper Market Value (US$ Mn) and Volume (Thousand Tons) 2014-2027, By Coating Type
Table 19: Latin America Functional and Barrier Coatings for Paper Market Value (US$ Mn) and Volume (Thousand Tons) 2014-2027, By Coating Type
Table 20: Latin America Functional and Barrier Coatings for Paper Market Value (US$ Mn) and Volume (Thousand Tons) 2014-2027, By Application
Table 21: Latin America Functional and Barrier Coatings for Paper Market Value (US$ Mn) and Volume (Thousand Tons) 2014-2027, By Application
Table 22: Latin America Functional and Barrier Coatings for Paper Market Value (US$ Mn) and Volume (Thousand Tons) 2014-2027, By Application
Table 23: Latin America Functional and Barrier Coatings for Paper Market Value (US$ Mn) and Volume (Thousand Tons) 2014-2027, By End Use
Table 24: Latin America Functional and Barrier Coatings for Paper Market Value (US$ Mn) and Volume (Thousand Tons) 2014-2027, By End Use
Table 25: Europe Functional and Barrier Coatings for Paper Market Value (US$ Mn) and Volume (Thousand Tons) 2014-2027, By Country
Table 26: Europe Functional and Barrier Coatings for Paper Market Value (US$ Mn) and Volume (Thousand Tons) 2014-2027, By Coating Type
Table 27: Europe Functional and Barrier Coatings for Paper Market Value (US$ Mn) and Volume (Thousand Tons) 2014-2027, By Coating Type
Table 28: Europe Functional and Barrier Coatings for Paper Market Value (US$ Mn) and Volume (Thousand Tons) 2014-2027, By Application
Table 29: Europe Functional and Barrier Coatings for Paper Market Value (US$ Mn) and Volume (Thousand Tons) 2014-2027, By Application
Table 30: Europe Functional and Barrier Coatings for Paper Market Value (US$ Mn) and Volume (Thousand Tons) 2014-2027, By Application
Table 31: Europe Functional and Barrier Coatings for Paper Market Value (US$ Mn) and Volume (Thousand Tons) 2014-2027, By End Use
Table 32: Europe Functional and Barrier Coatings for Paper Market Value (US$ Mn) and Volume (Thousand Tons) 2014-2027, By End Use
Table 33: Asia Pacific Functional and Barrier Coatings for Paper Market Value (US$ Mn) and Volume (Thousand Tons) 2014-2027, By Country
Table 34: Asia Pacific Functional and Barrier Coatings for Paper Market Value (US$ Mn) and Volume (Thousand Tons) 2014-2027, By Coating Type
Table 35: Asia Pacific Functional and Barrier Coatings for Paper Market Value (US$ Mn) and Volume (Thousand Tons) 2014-2027, By Coating Type
Table 36: Asia Pacific Functional and Barrier Coatings for Paper Market Value (US$ Mn) and Volume (Thousand Tons) 2014-2027, By Application
Table 37: Asia Pacific Functional and Barrier Coatings for Paper Market Value (US$ Mn) and Volume (Thousand Tons) 2014-2027, By Application
Table 38: Asia Pacific Functional and Barrier Coatings for Paper Market Value (US$ Mn) and Volume (Thousand Tons) 2014-2027, By Application
Table 39: Asia Pacific Functional and Barrier Coatings for Paper Market Value (US$ Mn) and Volume (Thousand Tons) 2014-2027, By End Use
Table 40: Asia Pacific Functional and Barrier Coatings for Paper Market Value (US$ Mn) and Volume (Thousand Tons) 2014-2027, By End Use
Table 41: Middle East & Africa Functional and Barrier Coatings for Paper Market Value (US$ Mn) and Volume (Thousand Tons) 2014-2027, By Country
Table 42: Middle East & Africa Functional and Barrier Coatings for Paper Market Value (US$ Mn) and Volume (Thousand Tons) 2014-2027, By Coating Type
Table 43: Middle East & Africa Functional and Barrier Coatings for Paper Market Value (US$ Mn) and Volume (Thousand Tons) 2014-2027, By Coating Type
Table 44: Middle East & Africa Functional and Barrier Coatings for Paper Market Value (US$ Mn) and Volume (Thousand Tons) 2014-2027, By Application
Table 45: Middle East & Africa Functional and Barrier Coatings for Paper Market Value (US$ Mn) and Volume (Thousand Tons) 2014-2027, By Application
Table 46: Middle East & Africa Functional and Barrier Coatings for Paper Market Value (US$ Mn) and Volume (Thousand Tons) 2014-2027, By Application
Table 47: Middle East & Africa Functional and Barrier Coatings for Paper Market Value (US$ Mn) and Volume (Thousand Tons) 2014-2027, By End Use
Table 48: Middle East & Africa Functional and Barrier Coatings for Paper Market Value (US$ Mn) and Volume (Thousand Tons) 2014-2027, By End Use
List of Figure
Figure 01: Global Functional and Barrier Coatings for Paper Market Value Share, by Coating Type, 2019(E)
Figure 02: Global Functional and Barrier Coatings for Paper Market Attractiveness Analysis, by Coating Type 2019(E)-2027(F)
Figure 04: Global Functional and Barrier Coatings for Paper Market Y-o-Y growth, by Application, 2019(E)-2027(F)
Figure 03: Global Functional and Barrier Coatings for Paper Market Value Share and BPS Analysis, By Application, 2019(E) & 2027(F)
Figure 05: Global Functional and Barrier Coatings for Paper Market Attractiveness Analysis, by End Use, 2019(E)-2027(F)
Figure 06: Global Functional and Barrier Coatings for Paper Market Value Share Analysis, By End Use, 2019(E)
Figure 08: Global Functional and Barrier Coatings for Paper Market Y-o-Y growth, by Region 2019(E)-2027(F)
Figure 07: Global Functional and Barrier Coatings for Paper Market Attractiveness Analysis, by Region 2019(E)-2027(F)
Figure 09: North America Functional and Barrier Coatings for Paper Market Value Share and BPS Analysis, By Country, 2019(E) & 2027(F)
Figure 10: North America Functional and Barrier Coatings for Paper Market Y-o-Y growth, by Country 2019(E)-2027(F)
Figure 11: North America Functional and Barrier Coatings for Paper Market Attractiveness Analysis, by Country, 2019(E)-2027(F)
Figure 12: North America Functional and Barrier Coatings for Paper Market Y-o-Y growth, by Coating Type 2019(E)-2027(F)
Figure 13: North America Functional and Barrier Coatings for Paper Market Attractiveness Analysis, by Coating Type, 2019(E)-2027(F)
Figure 14: North America Functional and Barrier Coatings for Paper Market Value Share Analysis, By Coating Type, 2019(E)
Figure 16: North America Functional and Barrier Coatings for Paper Market Value Share Analysis, By Application, 2019(E)
Figure 15: North America Functional and Barrier Coatings for Paper Market Attractiveness Analysis, by Application, 2019(E)-2027(F)
Figure 17: North America Functional and Barrier Coatings for Paper Market Y-o-Y growth, by Application 2019(E)-2027(F)
Figure 18: North America Functional and Barrier Coatings for Paper Market Y-o-Y growth, by End Use 2019(E)-2027(F)
Figure 19: North America Functional and Barrier Coatings for Paper Market Attractiveness Analysis, by End Use, 2019(E)-2027(F)
Figure 20: North America Functional and Barrier Coatings for Paper Market Value Share Analysis, By End Use, 2019(E)
Figure 21: Latin America Functional and Barrier Coatings for Paper Market Value Share and BPS Analysis, By Country, 2019(E) & 2027(F)
Figure 22: Latin America Functional and Barrier Coatings for Paper Market Y-o-Y growth, by Country 2019(E)-2027(F)
Figure 23: Latin America Functional and Barrier Coatings for Paper Market Attractiveness Analysis, by Country, 2019(E)-2027(F)
Figure 24: Latin America Functional and Barrier Coatings for Paper Market Y-o-Y growth, by Coating Type 2019(E)-2027(F)
Figure 25: Latin America Functional and Barrier Coatings for Paper Market Attractiveness Analysis, by Coating Type, 2019(E)-2027(F)
Figure 26: Latin America Functional and Barrier Coatings for Paper Market Value Share Analysis, By Coating Type, 2019(E)
Figure 28: Latin America Functional and Barrier Coatings for Paper Market Value Share Analysis, By Application, 2019(E)
Figure 27: Latin America Functional and Barrier Coatings for Paper Market Attractiveness Analysis, by Application, 2019(E)-2027(F)
Figure 29: Latin America Functional and Barrier Coatings for Paper Market Y-o-Y growth, by Application 2019(E)-2027(F)
Figure 30: Latin America Functional and Barrier Coatings for Paper Market Y-o-Y growth, by End Use 2019(E)-2027(F)
Figure 31: Latin America Functional and Barrier Coatings for Paper Market Attractiveness Analysis, by End Use, 2019(E)-2027(F)
Figure 32: Latin America Functional and Barrier Coatings for Paper Market Value Share Analysis, By End Use, 2019(E)
Figure 33: Europe Functional and Barrier Coatings for Paper Market Value Share and BPS Analysis, By Country, 2019(E) & 2027(F)
Figure 34: Europe Functional and Barrier Coatings for Paper Market Y-o-Y growth, by Country 2019(E)-2027(F)
Figure 35: Europe Functional and Barrier Coatings for Paper Market Attractiveness Analysis, by Country, 2019(E)-2027(F)
Figure 36: Europe Functional and Barrier Coatings for Paper Market Y-o-Y growth, by Coating Type 2019(E)-2027(F)
Figure 37: Europe Functional and Barrier Coatings for Paper Market Attractiveness Analysis, by Coating Type, 2019(E)-2027(F)
Figure 38: Europe Functional and Barrier Coatings for Paper Market Value Share Analysis, By Coating Type, 2019(E)
Figure 40: Europe Functional and Barrier Coatings for Paper Market Value Share Analysis, By Application, 2019(E)
Figure 39: Europe Functional and Barrier Coatings for Paper Market Attractiveness Analysis, by Application, 2019(E)-2027(F)
Figure 41: Europe Functional and Barrier Coatings for Paper Market Y-o-Y growth, by Application 2019(E)-2027(F)
Figure 42: Europe Functional and Barrier Coatings for Paper Market Y-o-Y growth, by End Use 2019(E)-2027(F)
Figure 43: Europe Functional and Barrier Coatings for Paper Market Attractiveness Analysis, by End Use, 2019(E)-2027(F)
Figure 44: Europe Functional and Barrier Coatings for Paper Market Value Share Analysis, By End Use, 2019(E)
Figure 45: Asia Pacific Functional and Barrier Coatings for Paper Market Value Share and BPS Analysis, By Country, 2019(E) & 2027(F)
Figure 46: Asia Pacific Functional and Barrier Coatings for Paper Market Y-o-Y growth, by Country 2019(E)-2027(F)
Figure 47: Asia Pacific Functional and Barrier Coatings for Paper Market Attractiveness Analysis, by Country, 2019(E)-2027(F)
Figure 48: Asia Pacific Functional and Barrier Coatings for Paper Market Y-o-Y growth, by Coating Type 2019(E)-2027(F)
Figure 49: Asia Pacific Functional and Barrier Coatings for Paper Market Attractiveness Analysis, by Coating Type, 2019(E)-2027(F)
Figure 50: Asia Pacific Functional and Barrier Coatings for Paper Market Value Share Analysis, By Coating Type, 2019(E)
Figure 52: Asia Pacific Functional and Barrier Coatings for Paper Market Value Share Analysis, By Application, 2019(E)
Figure 51: Asia Pacific Functional and Barrier Coatings for Paper Market Attractiveness Analysis, by Application, 2019(E)-2027(F)
Figure 53: Asia Pacific Functional and Barrier Coatings for Paper Market Y-o-Y growth, by Application 2019(E)-2027(F)
Figure 54: Asia Pacific Functional and Barrier Coatings for Paper Market Y-o-Y growth, by End Use 2019(E)-2027(F)
Figure 55: Asia Pacific Functional and Barrier Coatings for Paper Market Attractiveness Analysis, by End Use, 2019(E)-2027(F)
Figure 56: Asia Pacific Functional and Barrier Coatings for Paper Market Value Share Analysis, By End Use, 2019(E)
Figure 57: Middle East & Africa Functional and Barrier Coatings for Paper Market Value Share and BPS Analysis, By Country, 2019(E) & 2027(F)
Figure 58: Middle East & Africa Functional and Barrier Coatings for Paper Market Y-o-Y growth, by Country 2019(E)-2027(F)
Figure 59: Middle East & Africa Functional and Barrier Coatings for Paper Market Attractiveness Analysis, by Country, 2019(E)-2027(F)
Figure 60: Middle East & Africa Functional and Barrier Coatings for Paper Market Y-o-Y growth, by Coating Type 2019(E)-2027(F)
Figure 61: Middle East & Africa Functional and Barrier Coatings for Paper Market Attractiveness Analysis, by Coating Type, 2019(E)-2027(F)
Figure 62: Middle East & Africa Functional and Barrier Coatings for Paper Market Value Share Analysis, By Coating Type, 2019(E)
Figure 64: Middle East & Africa Functional and Barrier Coatings for Paper Market Value Share Analysis, By Application, 2019(E)
Figure 63: Middle East & Africa Functional and Barrier Coatings for Paper Market Attractiveness Analysis, by Application, 2019(E)-2027(F)
Figure 65: Middle East & Africa Functional and Barrier Coatings for Paper Market Y-o-Y growth, by Application 2019(E)-2027(F)
Figure 66: Middle East & Africa Functional and Barrier Coatings for Paper Market Y-o-Y growth, by End Use 2019(E)-2027(F)
Figure 67: Middle East & Africa Functional and Barrier Coatings for Paper Market Attractiveness Analysis, by End Use, 2019(E)-2027(F)
Figure 68: Middle East & Africa Functional and Barrier Coatings for Paper Market Value Share Analysis, By End Use, 2019(E)
Copyright © Transparency Market Research, Inc. All Rights reserved
Trust Online

Functional and Barrier Coatings for Paper Market