
Reports
Reports
Analysts’ Viewpoint on Market Scenario
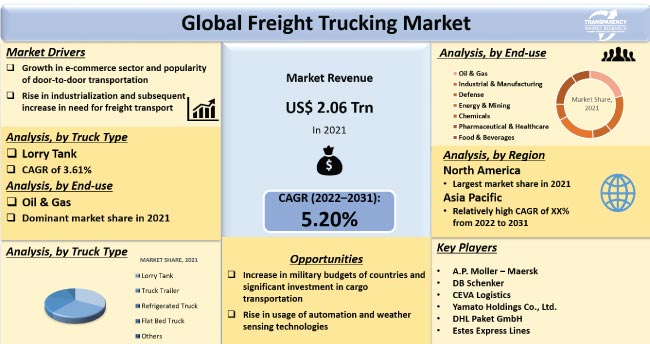
Significant growth in the e-commerce sector is driving the demand for door-to-door transportation of goods. This, in turn, is augmenting the global freight trucking market. Rise in need for transportation in oil & gas, energy, mining, and chemicals sectors is also boosting the demand for fright trucking. However, lack of efficient transport infrastructure in developing and underdeveloped economies is hampering the market.
Importance of freight transportation in tackling weather challenges has encouraged companies to incorporate environmental considerations in various areas of operations, from warehousing to transportation and procurement. Companies are increasingly adopting electric truck transportation, especially in developed regions such as Europe and North America.
They are also providing complete logistics tracking support, with a wide range of value added services such as GPS tracking, 24/7 real-time monitoring, and temperature-controlled trucks. Key freight and logistic trucking companies are actively carrying out mergers and acquisitions to expand their global footprint.
Freight trucks are large, powerful vehicles used to move cargo, merchandise, and other items from one location to another. These trucks are equipped with powerful engines and sturdy chassis, which allow them to carry bigger loads with ease. Typically, these trucks transport freight between factories, warehouses, wholesalers, and retailers. Fright transportation types of trucks include lorry tanks, truck trailers, refrigerated trucks, and flatbed trucks.
Growth of the freight trucking market can be ascribed to the rise in demand for house-to-house transport owing to the highly developing e-commerce sector. Increase in middle-class population and rise in disposable income level of the people are propelling the e-commerce industry. This, in turn, is leading to an increase in demand for freight trucking, thereby augmenting the revenue of freight trucking companies. Surge in industrialization, urbanization, and import-export activities is anticipated to offer lucrative opportunities to the market.
The e-commerce sector has created lucrative opportunities for dry van trucking. Getting things at fingertips has become a key trend owing to the ever evolving technologies, smartphones, and internet. This has resulted in significant growth in the door-to-door transportation industry. Increase in demand for consumer goods is also key factor propelling the demand for fright trucking transportation. Rise in demand for food and food-related products due to the growth in population has led to a significant increase in demand for refrigerated trucking.
Rapid growth in industries across the globe has led to a rise in demand for heavy haul trucking and flatbed trucking. Flatbed trucking is used for heavy machineries, irregular or complex shaped equipment, and other heavy industrial goods. Surge in urbanization and industrialization has prompted significant investments in construction and infrastructure. This, in turn, is boosting the demand for heavy haul trucking. Demand for lorry freight has also increased substantially across the globe due to the growth of the consumer goods industry.
Rise in cross-border tensions in Europe and Asia Pacific has led to an increase in demand for military cargo transport. For instance, Russia plans to invest US$ 600 Bn in national defense, security, and transportation during the on-going Russia-Ukraine war. Thus, growth in demand for cargo transportation is offering lucrative opportunities for heavy haul trucking.
In Asia, China, India, and Pakistan are investing substantially in military infrastructure amid border disputes. North Korea and South Korea are also engaged in cross-border tensions. These countries are investing significantly in the military sector. This is driving the transportation management system market in the region.
In terms of truck type, the lorry tank segment is expected to hold major share of the global freight trucking market during the forecast period. Crude oil is one of most transported commodities across the world. Transportation of crude oil is continuously increasing in developed and developing countries. This is boosting the demand for lorry tank freight trucking. Demand for lorry tank fright trucking is expected to be followed by the demand for truck trailer and refrigerated truck freight. Increase in need for food products hauling is likely to bolster the truck trailer and refrigerated truck segments.
Rise in volume of transportation of oil and gas across the globe is fueling the demand for freight trucks. Increase in export of oil, gasoline, and diesel also propelling the freight trucking market. The need for transportation of oil and gas has increased significantly owing to the rise in number of on-road vehicles, and surge in industrialization and urbanization.
North America is expected to dominate the global freight trucking market during the forecast period. Currently, the U.S. is one of the key markets for truck logistics in the region, with a highly integrated supply chain network that links producers and consumers. Besides transportation and distribution services, many niche players offer specialized services such as reverse logistics, IT services, and consulting in the country.
Asia Pacific is anticipated to be one of the fastest growing markets for freight trucking. Growth of the market in the region can be ascribed to the presence of developing economies such as China, India, Japan, and South Korea. Robust industrial development in China and India, and rapid growth of the e-commerce sector are likely to boost the freight trucking market in Asia Pacific. Transportation of FMCG goods is quite high in the region. Additionally, rise in military cargo transportation owing to the increase in military budgets in China, India, and Pakistan is driving the freight trucking industry in Asia Pacific.
In terms of revenue, Europe is also estimated to hold key share of the global market during the forecast period. As per the International Forwarding Association, road transport accounts for more than 75% share of freight transport in the European Union. Containerized cargo constitutes 23.9% share of all commodities, followed by dry bulk (23.2%).
The global freight trucking market is fragmented, with a large number of service providers controlling the majority of the share. Expansion of product portfolios and mergers and acquisitions are key strategies adopted by the leading players. Prominent players operating in the global market are A.P. Moller Maersk, Canadian National, CEVA Logistics, CMA CGM, DB SCHENKER, Deutsche Post, DHL Paket GmbH, Estes Express Lines, FedEx Corporation, Kuehne + Nagel, Nippon Express Co., Ltd., R+L Carriers, Saia Motor Freight Line, SNCF Geodis, Swift Transportation, TNT Holding B.V., UPS Freight, XPO Logistics, Yamato Holdings Co., Ltd., and YRC Worldwide Inc.
Each of these players has been profiled in the freight trucking market report based on parameters such as company overview, financial overview, business strategies, product portfolio, business segments, and recent developments.
|
Attribute |
Detail |
|
Market Size Value in 2021 |
US$ 2.06 Trn |
|
Market Forecast Value in 2031 |
US$ 3.43 Trn |
|
Growth Rate (CAGR) |
5.20% |
|
Forecast Period |
2022–2031 |
|
Historical Data Available for |
2017–2021 |
|
Quantitative Units |
US$ Trn for Value and Million Tons for Volume |
|
Market Analysis |
It includes cross segment analysis at global as well as regional level. Furthermore, qualitative analysis includes drivers, restraints, opportunities, key trends, Porter’s Five Forces analysis, value chain analysis, and key trend analysis. |
|
Competition Landscape |
|
|
Format |
Electronic (PDF) + Excel |
|
Market Segmentation |
|
|
Regions Covered |
|
|
Countries Covered |
|
|
Companies Profile |
|
|
Customization Scope |
Available upon request |
|
Pricing |
Available upon request |
The market was valued at US$ 2.06 Trn in 2021
The market is expected to grow at a CAGR of 5.20% by 2031
The industr is likely to be valued at US$ 3.43 Trn in 2031
Increase in demand for door-to-door transportation due to growth in e-commerce platforms, and rise in military cargo transportation
Based on end-use, the oil & gas segment accounts for the major share of the market
North America is anticipated to be a highly lucrative region of the global freight trucking market
A.P. Moller Maersk, Canadian National, CEVA Logistics, CMA CGM, DB SCHENKER, Deutsche Post, DHL Paket GmbH, Estes Express Lines, FedEx Corporation, Kuehne + Nagel, Nippon Express Co., Ltd., R+L Carriers, Saia Motor Freight Line, SNCF Geodis, Swift Transportation, TNT Holding B.V., UPS Freight, XPO Logistics, Yamato Holdings Co., Ltd., and YRC Worldwide Inc.
1. Executive Summary
1.1. Global Market Outlook
1.1.1. Market Size in Million Tons, Value US$ Bn, 2017-2031
1.2. TMR Analysis and Recommendations
1.3. Competitive Dashboard Analysis
2. Market Overview
2.1. Market Coverage / Taxonomy
2.2. Market Definition / Scope / Limitations
2.3. Market Dynamics
2.3.1. Drivers
2.3.2. Restraints
2.3.3. Opportunities
2.4. Market Factor Analysis
2.4.1. Porter’s Five Forces Analysis
2.4.2. SWOT Analysis
2.5. Regulatory Scenario
2.6. Key Trend Analysis
2.7. Value Chain Analysis
2.8. Cost Structure Analysis
2.9. Profit Margin Analysis
3. COVID-19 Impact Analysis – Freight Trucking Market
4. Global Freight Trucking Market, By Truck Type
4.1. Market Snapshot
4.1.1. Introduction, Definition, and Key Findings
4.1.2. Market Growth & Y-o-Y Projections
4.1.3. Base Point Share Analysis
4.2. Global Freight Trucking Market Size Volume (Million Tons), Revenue (US$ Bn) Analysis & Forecast, 2017-2031, By Truck Type
4.2.1. Lorry Tank
4.2.2. Truck Trailer
4.2.3. Refrigerated Truck
4.2.4. Flat Bed Truck
4.2.5. Others
5. Global Freight Trucking Market, By Distance
5.1. Market Snapshot
5.1.1. Introduction, Definition, and Key Findings
5.1.2. Market Growth & Y-o-Y Projections
5.1.3. Base Point Share Analysis
5.2. Global Freight Trucking Market Size Volume (Million Tons), Revenue (US$ Bn) Analysis & Forecast, 2017-2031, By Distance
5.2.1. 50 Miles or Less
5.2.2. 51 to 100 Miles
5.2.3. 101-200 Miles
5.2.4. 201-500 Miles
5.2.5. Above 500 Miles
6. Global Freight Trucking Market, By Cargo Type
6.1. Market Snapshot
6.1.1. Introduction, Definition, and Key Findings
6.1.2. Market Growth & Y-o-Y Projections
6.1.3. Base Point Share Analysis
6.2. Global Freight Trucking Market Size Volume (Million Tons), Revenue (US$ Bn) Analysis & Forecast, 2017-2031, By Cargo Type
6.2.1. Dry Bulk Goods
6.2.2. Oil & Diesel
6.2.3. Postal
6.2.4. Others
7. Global Freight Trucking Market, By End-use
7.1. Market Snapshot
7.1.1. Introduction, Definition, and Key Findings
7.1.2. Market Growth & Y-o-Y Projections
7.1.3. Base Point Share Analysis
7.2. Global Freight Trucking Market Size Volume (Million Tons), Revenue (US$ Bn) Analysis & Forecast, 2017-2031, By End-use
7.2.1. Oil & Gas
7.2.2. Industrial & Manufacturing
7.2.3. Defense
7.2.4. Energy and Mining
7.2.5. Chemicals
7.2.6. Pharmaceutical & Healthcare
7.2.7. Food & Beverages
8. Global Freight Trucking Market, by Region
8.1. Market Snapshot
8.1.1. Introduction, Definition, and Key Findings
8.1.2. Market Growth & Y-o-Y Projections
8.1.3. Base Point Share Analysis
8.2. Global Freight Trucking Market Size Volume (Million Tons), Revenue (US$ Bn) Analysis & Forecast, 2017-2031, By Region
8.2.1. North America
8.2.2. Europe
8.2.3. Asia Pacific
8.2.4. Middle East & Africa
8.2.5. South America
9. North America Freight Trucking Market
9.1. Market Snapshot
9.2. Freight Trucking Market Size Volume (Million Tons), Revenue (US$ Bn) Analysis & Forecast, 2017-2031, By Truck Type
9.2.1. Lorry Tank
9.2.2. Truck Trailer
9.2.3. Refrigerated Truck
9.2.4. Flat Bed Truck
9.2.5. Others
9.3. Freight Trucking Market Size Volume (Million Tons), Revenue (US$ Bn) Analysis & Forecast, 2017-2031, By Distance
9.3.1. 50 Miles or Less
9.3.2. 51 to 100 Miles
9.3.3. 101-200 Miles
9.3.4. 201-500 Miles
9.3.5. Above 500 Miles
9.4. Freight Trucking Market Size Volume (Million Tons), Revenue (US$ Bn) Analysis & Forecast, 2017-2031, By Cargo Type
9.4.1. Dry Bulk Goods
9.4.2. Oil & Diesel
9.4.3. Postal
9.4.4. Others
9.5. Freight Trucking Market Size Volume (Million Tons), Revenue (US$ Bn) Analysis & Forecast, 2017-2031, By End-use
9.5.1. Oil & Gas
9.5.2. Industrial & Manufacturing
9.5.3. Defense
9.5.4. Energy and Mining
9.5.5. Chemicals
9.5.6. Pharmaceutical & Healthcare
9.5.7. Food & Beverages
9.6. Key Country Analysis – North America Freight Trucking Market Size Volume Analysis & Forecast, 2017-2031
9.6.1. U.S.
9.6.2. Canada
9.6.3. Mexico
10. Europe Freight Trucking Market
10.1. Market Snapshot
10.2. Freight Trucking Market Size Volume (Million Tons), Revenue (US$ Bn) Analysis & Forecast, 2017-2031, By Truck Type
10.2.1. Lorry Tank
10.2.2. Truck Trailer
10.2.3. Refrigerated Truck
10.2.4. Flat Bed Truck
10.2.5. Others
10.3. Freight Trucking Market Size Volume (Million Tons), Revenue (US$ Bn) Analysis & Forecast, 2017-2031, By Distance
10.3.1. 50 Miles or Less
10.3.2. 51 to 100 Miles
10.3.3. 101-200 Miles
10.3.4. 201-500 Miles
10.3.5. Above 500 Miles
10.4. Freight Trucking Market Size Volume (Million Tons), Revenue (US$ Bn) Analysis & Forecast, 2017-2031, By Cargo Type
10.4.1. Dry Bulk Goods
10.4.2. Oil & Diesel
10.4.3. Postal
10.4.4. Others
10.5. Freight Trucking Market Size Volume (Million Tons), Revenue (US$ Bn) Analysis & Forecast, 2017-2031, By End-use
10.5.1. Oil & Gas
10.5.2. Industrial & Manufacturing
10.5.3. Defense
10.5.4. Energy and Mining
10.5.5. Chemicals
10.5.6. Pharmaceutical & Healthcare
10.5.7. Food & Beverages
10.6. Key Country Analysis – Europe Freight Trucking Market Size Volume Analysis & Forecast, 2017-2031
10.6.1. Germany
10.6.2. France
10.6.3. U.K.
10.6.4. Italy
10.6.5. Spain
10.6.6. Nordic Region
10.6.7. Rest of Europe
11. Asia-Pacific Freight Trucking Market
11.1. Market Snapshot
11.2. Freight Trucking Market Size Volume (Million Tons), Revenue (US$ Bn) Analysis & Forecast, 2017-2031, By Truck Type
11.2.1. Lorry Tank
11.2.2. Truck Trailer
11.2.3. Refrigerated Truck
11.2.4. Flat Bed Truck
11.2.5. Others
11.3. Freight Trucking Market Size Volume (Million Tons), Revenue (US$ Bn) Analysis & Forecast, 2017-2031, By Distance
11.3.1. 50 Miles or Less
11.3.2. 51 to 100 Miles
11.3.3. 101-200 Miles
11.3.4. 201-500 Miles
11.3.5. Above 500 Miles
11.4. Freight Trucking Market Size Volume (Million Tons), Revenue (US$ Bn) Analysis & Forecast, 2017-2031, By Cargo Type
11.4.1. Dry Bulk Goods
11.4.2. Oil & Diesel
11.4.3. Postal
11.4.4. Others
11.5. Freight Trucking Market Size Volume (Million Tons), Revenue (US$ Bn) Analysis & Forecast, 2017-2031, By End-use
11.5.1. Oil & Gas
11.5.2. Industrial & Manufacturing
11.5.3. Defense
11.5.4. Energy and Mining
11.5.5. Chemicals
11.5.6. Pharmaceutical & Healthcare
11.5.7. Food & Beverages
11.6. Key Country Analysis – Asia-Pacific Freight Trucking Market Size Volume Analysis & Forecast, 2017-2031
11.6.1. China
11.6.2. India
11.6.3. Japan
11.6.4. ASEAN Countries
11.6.5. South Korea
11.6.6. ANZ
11.6.7. Rest of Asia Pacific
12. Middle East & Africa Freight Trucking Market
12.1. Market Snapshot
12.2. Freight Trucking Market Size Volume (Million Tons), Revenue (US$ Bn) Analysis & Forecast, 2017-2031, By Truck Type
12.2.1. Lorry Tank
12.2.2. Truck Trailer
12.2.3. Refrigerated Truck
12.2.4. Flat Bed Truck
12.2.5. Others
12.3. Freight Trucking Market Size Volume (Million Tons), Revenue (US$ Bn) Analysis & Forecast, 2017-2031, By Distance
12.3.1. 50 Miles or Less
12.3.2. 51 to 100 Miles
12.3.3. 101-200 Miles
12.3.4. 201-500 Miles
12.3.5. Above 500 Miles
12.4. Freight Trucking Market Size Volume (Million Tons), Revenue (US$ Bn) Analysis & Forecast, 2017-2031, By Cargo Type
12.4.1. Dry Bulk Goods
12.4.2. Oil & Diesel
12.4.3. Postal
12.4.4. Others
12.5. Freight Trucking Market Size Volume (Million Tons), Revenue (US$ Bn) Analysis & Forecast, 2017-2031, By End-use
12.5.1. Oil & Gas
12.5.2. Industrial & Manufacturing
12.5.3. Defense
12.5.4. Energy and Mining
12.5.5. Chemicals
12.5.6. Pharmaceutical & Healthcare
12.5.7. Food & Beverages
12.6. Key Country Analysis – Middle East & Africa Freight Trucking Market Size Volume Analysis & Forecast, 2017-2031
12.6.1. GCC
12.6.2. South Africa
12.6.3. Turkey
12.6.4. Rest of Middle East & Africa
13. South America Freight Trucking Market
13.1. Market Snapshot
13.2. Freight Trucking Market Size Volume (Million Tons), Revenue (US$ Bn) Analysis & Forecast, 2017-2031, By Truck Type
13.2.1. Lorry Tank
13.2.2. Truck Trailer
13.2.3. Refrigerated Truck
13.2.4. Flat Bed Truck
13.2.5. Others
13.3. Freight Trucking Market Size Volume (Million Tons), Revenue (US$ Bn) Analysis & Forecast, 2017-2031, By Distance
13.3.1. 50 Miles or Less
13.3.2. 51 to 100 Miles
13.3.3. 101-200 Miles
13.3.4. 201-500 Miles
13.3.5. Above 500 Miles
13.4. Freight Trucking Market Size Volume (Million Tons), Revenue (US$ Bn) Analysis & Forecast, 2017-2031, By Cargo Type
13.4.1. Dry Bulk Goods
13.4.2. Oil & Diesel
13.4.3. Postal
13.4.4. Others
13.5. Freight Trucking Market Size Volume (Million Tons), Revenue (US$ Bn) Analysis & Forecast, 2017-2031, By End-use
13.5.1. Oil & Gas
13.5.2. Industrial & Manufacturing
13.5.3. Defense
13.5.4. Energy and Mining
13.5.5. Chemicals
13.5.6. Pharmaceutical & Healthcare
13.5.7. Food & Beverages
13.6. Key Country Analysis – South America Freight Trucking Market Size Volume Analysis & Forecast, 2017-2031
13.6.1. Brazil
13.6.2. Argentina
13.6.3. Rest of South America
14. Competitive Landscape
14.1. Company Share Analysis/ Brand Share Analysis, 2021
14.2. Company Analysis for each player (Company Overview, Company Footprints, Production Locations, Product Portfolio, Competitors & Customers, Subsidiaries & Parent Organization, Recent Developments, Financial Analysis, Profitability, Revenue Share)
14.3. Company Profile/ Key Players
14.3.1. A.P.Moller Maersk
14.3.1.1. Company Overview
14.3.1.2. Company Footprints
14.3.1.3. Production Locations
14.3.1.4. Product Portfolio
14.3.1.5. Competitors & Customers
14.3.1.6. Subsidiaries & Parent Organization
14.3.1.7. Recent Developments
14.3.1.8. Financial Analysis
14.3.1.9. Profitability
14.3.1.10. Revenue Share
14.3.2. Canadian National
14.3.2.1. Company Overview
14.3.2.2. Company Footprints
14.3.2.3. Production Locations
14.3.2.4. Product Portfolio
14.3.2.5. Competitors & Customers
14.3.2.6. Subsidiaries & Parent Organization
14.3.2.7. Recent Developments
14.3.2.8. Financial Analysis
14.3.2.9. Profitability
14.3.2.10. Revenue Share
14.3.3. CEVA Logistics
14.3.3.1. Company Overview
14.3.3.2. Company Footprints
14.3.3.3. Production Locations
14.3.3.4. Product Portfolio
14.3.3.5. Competitors & Customers
14.3.3.6. Subsidiaries & Parent Organization
14.3.3.7. Recent Developments
14.3.3.8. Financial Analysis
14.3.3.9. Profitability
14.3.3.10. Revenue Share
14.3.4. CMA CGM
14.3.4.1. Company Overview
14.3.4.2. Company Footprints
14.3.4.3. Production Locations
14.3.4.4. Product Portfolio
14.3.4.5. Competitors & Customers
14.3.4.6. Subsidiaries & Parent Organization
14.3.4.7. Recent Developments
14.3.4.8. Financial Analysis
14.3.4.9. Profitability
14.3.4.10. Revenue Share
14.3.5. DB SCHENKER
14.3.5.1. Company Overview
14.3.5.2. Company Footprints
14.3.5.3. Production Locations
14.3.5.4. Product Portfolio
14.3.5.5. Competitors & Customers
14.3.5.6. Subsidiaries & Parent Organization
14.3.5.7. Recent Developments
14.3.5.8. Financial Analysis
14.3.5.9. Profitability
14.3.5.10. Revenue Share
14.3.6. DHL Paket GmbH
14.3.6.1. Company Overview
14.3.6.2. Company Footprints
14.3.6.3. Production Locations
14.3.6.4. Product Portfolio
14.3.6.5. Competitors & Customers
14.3.6.6. Subsidiaries & Parent Organization
14.3.6.7. Recent Developments
14.3.6.8. Financial Analysis
14.3.6.9. Profitability
14.3.6.10. Revenue Share
14.3.7. Estes Express Lines
14.3.7.1. Company Overview
14.3.7.2. Company Footprints
14.3.7.3. Production Locations
14.3.7.4. Product Portfolio
14.3.7.5. Competitors & Customers
14.3.7.6. Subsidiaries & Parent Organization
14.3.7.7. Recent Developments
14.3.7.8. Financial Analysis
14.3.7.9. Profitability
14.3.7.10. Revenue Share
14.3.8. FedEx Corporation
14.3.8.1. Company Overview
14.3.8.2. Company Footprints
14.3.8.3. Production Locations
14.3.8.4. Product Portfolio
14.3.8.5. Competitors & Customers
14.3.8.6. Subsidiaries & Parent Organization
14.3.8.7. Recent Developments
14.3.8.8. Financial Analysis
14.3.8.9. Profitability
14.3.8.10. Revenue Share
14.3.9. Kuehne + Nagel
14.3.9.1. Company Overview
14.3.9.2. Company Footprints
14.3.9.3. Production Locations
14.3.9.4. Product Portfolio
14.3.9.5. Competitors & Customers
14.3.9.6. Subsidiaries & Parent Organization
14.3.9.7. Recent Developments
14.3.9.8. Financial Analysis
14.3.9.9. Profitability
14.3.9.10. Revenue Share
14.3.10. Nippon Express Co., Ltd.
14.3.10.1. Company Overview
14.3.10.2. Company Footprints
14.3.10.3. Production Locations
14.3.10.4. Product Portfolio
14.3.10.5. Competitors & Customers
14.3.10.6. Subsidiaries & Parent Organization
14.3.10.7. Recent Developments
14.3.10.8. Financial Analysis
14.3.10.9. Profitability
14.3.10.10. Revenue Share
14.3.11. R+L Carriers
14.3.11.1. Company Overview
14.3.11.2. Company Footprints
14.3.11.3. Production Locations
14.3.11.4. Product Portfolio
14.3.11.5. Competitors & Customers
14.3.11.6. Subsidiaries & Parent Organization
14.3.11.7. Recent Developments
14.3.11.8. Financial Analysis
14.3.11.9. Profitability
14.3.11.10. Revenue Share
14.3.12. Saia Motor Freight Line
14.3.12.1. Company Overview
14.3.12.2. Company Footprints
14.3.12.3. Production Locations
14.3.12.4. Product Portfolio
14.3.12.5. Competitors & Customers
14.3.12.6. Subsidiaries & Parent Organization
14.3.12.7. Recent Developments
14.3.12.8. Financial Analysis
14.3.12.9. Profitability
14.3.12.10. Revenue Share
14.3.13. SNCF Geodis
14.3.13.1. Company Overview
14.3.13.2. Company Footprints
14.3.13.3. Production Locations
14.3.13.4. Product Portfolio
14.3.13.5. Competitors & Customers
14.3.13.6. Subsidiaries & Parent Organization
14.3.13.7. Recent Developments
14.3.13.8. Financial Analysis
14.3.13.9. Profitability
14.3.13.10. Revenue Share
14.3.14. Swift Transportation
14.3.14.1. Company Overview
14.3.14.2. Company Footprints
14.3.14.3. Production Locations
14.3.14.4. Product Portfolio
14.3.14.5. Competitors & Customers
14.3.14.6. Subsidiaries & Parent Organization
14.3.14.7. Recent Developments
14.3.14.8. Financial Analysis
14.3.14.9. Profitability
14.3.14.10. Revenue Share
14.3.15. TNT Holding B.V.
14.3.15.1. Company Overview
14.3.15.2. Company Footprints
14.3.15.3. Production Locations
14.3.15.4. Product Portfolio
14.3.15.5. Competitors & Customers
14.3.15.6. Subsidiaries & Parent Organization
14.3.15.7. Recent Developments
14.3.15.8. Financial Analysis
14.3.15.9. Profitability
14.3.15.10. Revenue Share
14.3.16. UPS Freight
14.3.16.1. Company Overview
14.3.16.2. Company Footprints
14.3.16.3. Production Locations
14.3.16.4. Product Portfolio
14.3.16.5. Competitors & Customers
14.3.16.6. Subsidiaries & Parent Organization
14.3.16.7. Recent Developments
14.3.16.8. Financial Analysis
14.3.16.9. Profitability
14.3.16.10. Revenue Share
14.3.17. XPO Logistics
14.3.17.1. Company Overview
14.3.17.2. Company Footprints
14.3.17.3. Production Locations
14.3.17.4. Product Portfolio
14.3.17.5. Competitors & Customers
14.3.17.6. Subsidiaries & Parent Organization
14.3.17.7. Recent Developments
14.3.17.8. Financial Analysis
14.3.17.9. Profitability
14.3.17.10. Revenue Share
14.3.18. Yamato Holdings Co., Ltd.
14.3.18.1. Company Overview
14.3.18.2. Company Footprints
14.3.18.3. Production Locations
14.3.18.4. Product Portfolio
14.3.18.5. Competitors & Customers
14.3.18.6. Subsidiaries & Parent Organization
14.3.18.7. Recent Developments
14.3.18.8. Financial Analysis
14.3.18.9. Profitability
14.3.18.10. Revenue Share
14.3.19. YRC Worldwide Inc.
14.3.19.1. Company Overview
14.3.19.2. Company Footprints
14.3.19.3. Production Locations
14.3.19.4. Product Portfolio
14.3.19.5. Competitors & Customers
14.3.19.6. Subsidiaries & Parent Organization
14.3.19.7. Recent Developments
14.3.19.8. Financial Analysis
14.3.19.9. Profitability
14.3.19.10. Revenue Share
14.3.20. Deutsche Post
14.3.20.1. Company Overview
14.3.20.2. Company Footprints
14.3.20.3. Production Locations
14.3.20.4. Product Portfolio
14.3.20.5. Competitors & Customers
14.3.20.6. Subsidiaries & Parent Organization
14.3.20.7. Recent Developments
14.3.20.8. Financial Analysis
14.3.20.9. Profitability
14.3.20.10. Revenue Share
List of Tables
Table 1: Global Freight Trucking Market Volume (Million Tons) Forecast, by Truck Type, 2017-2031
Table 2: Global Freight Trucking Market Revenue (US$ Bn) Forecast, by Truck Type, 2017-2031
Table 3: Global Freight Trucking Market Volume (Million Tons) Forecast, by Distance, 2017-2031
Table 4: Global Freight Trucking Market Revenue (US$ Bn) Forecast, by Distance, 2017-2031
Table 5: Global Freight Trucking Market Volume (Million Tons) Forecast, by Cargo Type, 2017-2031
Table 6: Global Freight Trucking Market Revenue (US$ Bn) Forecast, by Cargo Type, 2017-2031
Table 7: Global Freight Trucking Market Volume (Million Tons) Forecast, by End-use, 2017-2031
Table 8: Global Freight Trucking Market Revenue (US$ Bn) Forecast, by End-use, 2017-2031
Table 9: Global Freight Trucking Market Volume (Million Tons) Forecast, by Region, 2017-2031
Table 10: Global Freight Trucking Market Revenue (US$ Bn) Forecast, by Region, 2017-2031
Table 11: North America Freight Trucking Market Volume (Million Tons) Forecast, by Truck Type, 2017-2031
Table 12: North America Freight Trucking Market Revenue (US$ Bn) Forecast, by Truck Type, 2017-2031
Table 13: North America Freight Trucking Market Volume (Million Tons) Forecast, by Distance, 2017-2031
Table 14: North America Freight Trucking Market Revenue (US$ Bn) Forecast, by Distance, 2017-2031
Table 15: North America Freight Trucking Market Volume (Million Tons) Forecast, by Cargo Type, 2017-2031
Table 16: North America Freight Trucking Market Revenue (US$ Bn) Forecast, by Cargo Type, 2017-2031
Table 17: North America Freight Trucking Market Volume (Million Tons) Forecast, by End-use, 2017-2031
Table 18: North America Freight Trucking Market Revenue (US$ Bn) Forecast, by End-use, 2017-2031
Table 19: North America Freight Trucking Market Volume (Million Tons) Forecast, by Country 2017-2031
Table 20: North America Freight Trucking Market Revenue (US$ Bn) Forecast, by Country 2017-2031
Table 21: Europe Freight Trucking Market Volume (Million Tons) Forecast, by Truck Type, 2017-2031
Table 22: Europe Freight Trucking Market Revenue (US$ Bn) Forecast, by Truck Type, 2017-2031
Table 23: Europe Freight Trucking Market Volume (Million Tons) Forecast, by Distance, 2017-2031
Table 24: Europe Freight Trucking Market Revenue (US$ Bn) Forecast, by Distance, 2017-2031
Table 25: Europe Freight Trucking Market Volume (Million Tons) Forecast, by Cargo Type, 2017-2031
Table 26: Europe Freight Trucking Market Revenue (US$ Bn) Forecast, by Cargo Type, 2017-2031
Table 27: Europe Freight Trucking Market Volume (Million Tons) Forecast, by End-use, 2017-2031
Table 28: Europe Freight Trucking Market Revenue (US$ Bn) Forecast, by End-use, 2017-2031
Table 29: Europe Freight Trucking Market Volume (Million Tons) Forecast, by Country, 2017-2031
Table 30: Europe Freight Trucking Market Revenue (US$ Bn) Forecast, by Country, 2017-2031
Table 31: Asia Pacific Freight Trucking Market Volume (Million Tons) Forecast, by Truck Type, 2017-2031
Table 32: Asia Pacific Freight Trucking Market Revenue (US$ Bn) Forecast, by Truck Type, 2017-2031
Table 33: Asia Pacific Freight Trucking Market Volume (Million Tons) Forecast, by Distance, 2017-2031
Table 34: Asia Pacific Freight Trucking Market Revenue (US$ Bn) Forecast, by Distance, 2017-2031
Table 35: Asia Pacific Freight Trucking Market Volume (Million Tons) Forecast, by Cargo Type, 2017-2031
Table 36: Asia Pacific Freight Trucking Market Revenue (US$ Bn) Forecast, by Cargo Type, 2017-2031
Table 37: Asia Pacific Freight Trucking Market Volume (Million Tons) Forecast, by End-use, 2017-2031
Table 38: Asia Pacific Freight Trucking Market Revenue (US$ Bn) Forecast, by End-use, 2017-2031
Table 39: Asia Pacific Freight Trucking Market Volume (Million Tons) Forecast, by Country, 2017-2031
Table 40: Asia Pacific Freight Trucking Market Revenue (US$ Bn) Forecast, by Country, 2017-2031
Table 41: Middle East & Africa Freight Trucking Market Volume (Million Tons) Forecast, by Truck Type, 2017-2031
Table 42: Middle East & Africa Freight Trucking Market Revenue (US$ Bn) Forecast, by Truck Type, 2017-2031
Table 43: Middle East & Africa Freight Trucking Market Volume (Million Tons) Forecast, by Distance, 2017-2031
Table 44: Middle East & Africa Freight Trucking Market Revenue (US$ Bn) Forecast, by Distance, 2017-2031
Table 45: Middle East & Africa Freight Trucking Market Volume (Million Tons) Forecast, by Cargo Type, 2017-2031
Table 46: Middle East & Africa Freight Trucking Market Revenue (US$ Bn) Forecast, by Cargo Type, 2017-2031
Table 47: Middle East & Africa Freight Trucking Market Volume (Million Tons) Forecast, by End-use, 2017-2031
Table 48: Middle East & Africa Freight Trucking Market Revenue (US$ Bn) Forecast, by End-use, 2017-2031
Table 49: Middle East & Africa Freight Trucking Market Volume (Million Tons) Forecast, by Country, 2017-2031
Table 50: Middle East & Africa Freight Trucking Market Revenue (US$ Bn) Forecast, by Country, 2017-2031
Table 51: South America Freight Trucking Market Volume (Million Tons) Forecast, by Truck Type, 2017-2031
Table 52: South America Freight Trucking Market Revenue (US$ Bn) Forecast, by Truck Type, 2017-2031
Table 53: South America Freight Trucking Market Volume (Million Tons) Forecast, by Distance, 2017-2031
Table 54: South America Freight Trucking Market Revenue (US$ Bn) Forecast, by Distance, 2017-2031
Table 55: South America Freight Trucking Market Volume (Million Tons) Forecast, by Cargo Type, 2017-2031
Table 56: South America Freight Trucking Market Revenue (US$ Bn) Forecast, by Cargo Type, 2017-2031
Table 57: South America Freight Trucking Market Volume (Million Tons) Forecast, by End-use, 2017-2031
Table 58: South America Freight Trucking Market Revenue (US$ Bn) Forecast, by End-use, 2017-2031
Table 59: South America Freight Trucking Market Volume (Million Tons) Forecast, by Country, 2017-2031
Table 60: South America Freight Trucking Market Revenue (US$ Bn) Forecast, by Country, 2017-2031
List of Figures
Figure 1: Global Freight Trucking Market Volume (Million Tons) Forecast, by Truck Type, 2017-2031
Figure 2: Global Freight Trucking Market Revenue (US$ Bn) Forecast, by Truck Type, 2017-2031
Figure 3: Global Freight Trucking Market, Incremental Opportunity, by Truck Type, Value (US$ Bn), 2022-2031
Figure 4: Global Freight Trucking Market Volume (Million Tons) Forecast, by Distance, 2017-2031
Figure 5: Global Freight Trucking Market Revenue (US$ Bn) Forecast, by Distance, 2017-2031
Figure 6: Global Freight Trucking Market, Incremental Opportunity, by Distance, Value (US$ Bn), 2022-2031
Figure 7: Global Freight Trucking Market Volume (Million Tons) Forecast, by Cargo Type, 2017-2031
Figure 8: Global Freight Trucking Market Revenue (US$ Bn) Forecast, by Cargo Type, 2017-2031
Figure 9: Global Freight Trucking Market, Incremental Opportunity, by Cargo Type, Value (US$ Bn), 2022-2031
Figure 10: Global Freight Trucking Market Volume (Million Tons) Forecast, by End-use, 2017-2031
Figure 11: Global Freight Trucking Market Revenue (US$ Bn) Forecast, by End-use, 2017-2031
Figure 12: Global Freight Trucking Market, Incremental Opportunity, by End-use, Value (US$ Bn), 2022-2031
Figure 13: Global Freight Trucking Market Volume (Million Tons) Forecast, by Region, 2017-2031
Figure 14: Global Freight Trucking Market Revenue (US$ Bn) Forecast, by Region, 2017-2031
Figure 15: Global Freight Trucking Market, Incremental Opportunity, by Region, Value (US$ Bn), 2022-2031
Figure 16: North America Freight Trucking Market Volume (Million Tons) Forecast, by Truck Type, 2017-2031
Figure 17: North America Freight Trucking Market Revenue (US$ Bn) Forecast, by Truck Type, 2017-2031
Figure 18: North America Freight Trucking Market, Incremental Opportunity, by Truck Type, Value (US$ Bn), 2022-2031
Figure 19: North America Freight Trucking Market Volume (Million Tons) Forecast, by Distance, 2017-2031
Figure 20: North America Freight Trucking Market Revenue (US$ Bn) Forecast, by Distance, 2017-2031
Figure 21: North America Freight Trucking Market, Incremental Opportunity, by Distance, Value (US$ Bn), 2022-2031
Figure 22: North America Freight Trucking Market Volume (Million Tons) Forecast, by Cargo Type, 2017-2031
Figure 23: North America Freight Trucking Market Revenue (US$ Bn) Forecast, by Cargo Type, 2017-2031
Figure 24: North America Freight Trucking Market, Incremental Opportunity, by Cargo Type, Value (US$ Bn), 2022-2031
Figure 25: North America Freight Trucking Market Volume (Million Tons) Forecast, by End-use, 2017-2031
Figure 26: North America Freight Trucking Market Revenue (US$ Bn) Forecast, by End-use, 2017-2031
Figure 27: North America Freight Trucking Market, Incremental Opportunity, by End-use, Value (US$ Bn), 2022-2031
Figure 28: North America Freight Trucking Market Volume (Million Tons) Forecast, by Region, 2017-2031
Figure 29: North America Freight Trucking Market Revenue (US$ Bn) Forecast, by Region, 2017-2031
Figure 30: North America Freight Trucking Market, Incremental Opportunity, by Region, Value (US$ Bn), 2022-2031
Figure 31: Europe Freight Trucking Market Volume (Million Tons) Forecast, by Truck Type, 2017-2031
Figure 32: Europe Freight Trucking Market Revenue (US$ Bn) Forecast, by Truck Type, 2017-2031
Figure 33: Europe Freight Trucking Market, Incremental Opportunity, by Truck Type, Value (US$ Bn), 2022-2031
Figure 34: Europe Freight Trucking Market Volume (Million Tons) Forecast, by Distance, 2017-2031
Figure 35: Europe Freight Trucking Market Revenue (US$ Bn) Forecast, by Distance, 2017-2031
Figure 36: Europe Freight Trucking Market, Incremental Opportunity, by Distance, Value (US$ Bn), 2022-2031
Figure 37: Europe Freight Trucking Market Volume (Million Tons) Forecast, by Cargo Type, 2017-2031
Figure 38: Europe Freight Trucking Market Revenue (US$ Bn) Forecast, by Cargo Type, 2017-2031
Figure 39: Europe Freight Trucking Market, Incremental Opportunity, by Cargo Type, Value (US$ Bn), 2022-2031
Figure 40: Europe Freight Trucking Market Volume (Million Tons) Forecast, by End-use, 2017-2031
Figure 41: Europe Freight Trucking Market Revenue (US$ Bn) Forecast, by End-use, 2017-2031
Figure 42: Europe Freight Trucking Market, Incremental Opportunity, by End-use, Value (US$ Bn), 2022-2031
Figure 43: Europe Freight Trucking Market Volume (Million Tons) Forecast, by Region, 2017-2031
Figure 44: Europe Freight Trucking Market Revenue (US$ Bn) Forecast, by Region, 2017-2031
Figure 45: Europe Freight Trucking Market, Incremental Opportunity, by Region, Value (US$ Bn), 2022-2031
Figure 46: Asia Pacific Freight Trucking Market Volume (Million Tons) Forecast, by Truck Type, 2017-2031
Figure 47: Asia Pacific Freight Trucking Market Revenue (US$ Bn) Forecast, by Truck Type, 2017-2031
Figure 48: Asia Pacific Freight Trucking Market, Incremental Opportunity, by Truck Type, Value (US$ Bn), 2022-2031
Figure 49: Asia Pacific Freight Trucking Market Volume (Million Tons) Forecast, by Distance, 2017-2031
Figure 50: Asia Pacific Freight Trucking Market Revenue (US$ Bn) Forecast, by Distance, 2017-2031
Figure 51: Asia Pacific Freight Trucking Market, Incremental Opportunity, by Distance, Value (US$ Bn), 2022-2031
Figure 52: Asia Pacific Freight Trucking Market Volume (Million Tons) Forecast, by Cargo Type, 2017-2031
Figure 53: Asia Pacific Freight Trucking Market Revenue (US$ Bn) Forecast, by Cargo Type, 2017-2031
Figure 54: Asia Pacific Freight Trucking Market, Incremental Opportunity, by Cargo Type, Value (US$ Bn), 2022-2031
Figure 55: Asia Pacific Freight Trucking Market Volume (Million Tons) Forecast, by End-use, 2017-2031
Figure 56: Asia Pacific Freight Trucking Market Revenue (US$ Bn) Forecast, by End-use, 2017-2031
Figure 57: Asia Pacific Freight Trucking Market, Incremental Opportunity, by End-use, Value (US$ Bn), 2022-2031
Figure 58: Asia Pacific Freight Trucking Market Volume (Million Tons) Forecast, by Region, 2017-2031
Figure 59: Asia Pacific Freight Trucking Market Revenue (US$ Bn) Forecast, by Region, 2017-2031
Figure 60: Asia Pacific Freight Trucking Market, Incremental Opportunity, by Region, Value (US$ Bn), 2022-2031
Figure 61: Middle East & Africa Freight Trucking Market Volume (Million Tons) Forecast, by Truck Type, 2017-2031
Figure 62: Middle East & Africa Freight Trucking Market Revenue (US$ Bn) Forecast, by Truck Type, 2017-2031
Figure 63: Middle East & Africa Freight Trucking Market, Incremental Opportunity, by Truck Type, Value (US$ Bn), 2022-2031
Figure 64: Middle East & Africa Freight Trucking Market Volume (Million Tons) Forecast, by Distance, 2017-2031
Figure 65: Middle East & Africa Freight Trucking Market Revenue (US$ Bn) Forecast, by Distance, 2017-2031
Figure 66: Middle East & Africa Freight Trucking Market, Incremental Opportunity, by Distance, Value (US$ Bn), 2022-2031
Figure 67: Middle East & Africa Freight Trucking Market Volume (Million Tons) Forecast, by Cargo Type, 2017-2031
Figure 68: Middle East & Africa Freight Trucking Market Revenue (US$ Bn) Forecast, by Cargo Type, 2017-2031
Figure 69: Middle East & Africa Freight Trucking Market, Incremental Opportunity, by Cargo Type, Value (US$ Bn), 2022-2031
Figure 70: Middle East & Africa Freight Trucking Market Volume (Million Tons) Forecast, by End-use, 2017-2031
Figure 71: Middle East & Africa Freight Trucking Market Revenue (US$ Bn) Forecast, by End-use, 2017-2031
Figure 72: Middle East & Africa Freight Trucking Market, Incremental Opportunity, by End-use, Value (US$ Bn), 2022-2031
Figure 73: Middle East & Africa Freight Trucking Market Volume (Million Tons) Forecast, by Region, 2017-2031
Figure 74: Middle East & Africa Freight Trucking Market Revenue (US$ Bn) Forecast, by Region, 2017-2031
Figure 75: Middle East & Africa Freight Trucking Market, Incremental Opportunity, by Region, Value (US$ Bn), 2022-2031
Figure 76: South America Freight Trucking Market Volume (Million Tons) Forecast, by Truck Type, 2017-2031
Figure 77: South America Freight Trucking Market Revenue (US$ Bn) Forecast, by Truck Type, 2017-2031
Figure 78: South America Freight Trucking Market, Incremental Opportunity, by Truck Type, Value (US$ Bn), 2022-2031
Figure 79: South America Freight Trucking Market Volume (Million Tons) Forecast, by Distance, 2017-2031
Figure 80: South America Freight Trucking Market Revenue (US$ Bn) Forecast, by Distance, 2017-2031
Figure 81: South America Freight Trucking Market, Incremental Opportunity, by Distance, Value (US$ Bn), 2022-2031
Figure 82: South America Freight Trucking Market Volume (Million Tons) Forecast, by Cargo Type, 2017-2031
Figure 83: South America Freight Trucking Market Revenue (US$ Bn) Forecast, by Cargo Type, 2017-2031
Figure 84: South America Freight Trucking Market, Incremental Opportunity, by Cargo Type, Value (US$ Bn), 2022-2031
Figure 85: South America Freight Trucking Market Volume (Million Tons) Forecast, by End-use, 2017-2031
Figure 86: South America Freight Trucking Market Revenue (US$ Bn) Forecast, by End-use, 2017-2031
Figure 87: South America Freight Trucking Market, Incremental Opportunity, by End-use, Value (US$ Bn), 2022-2031
Figure 88: South America Freight Trucking Market Volume (Million Tons) Forecast, by Region, 2017-2031
Figure 89: South America Freight Trucking Market Revenue (US$ Bn) Forecast, by Region, 2017-2031
Figure 90: South America Freight Trucking Market, Incremental Opportunity, by Region, Value (US$ Bn), 2022-2031
Copyright © Transparency Market Research, Inc. All Rights reserved
Trust Online

Freight Trucking Market