
Reports
Reports
Analysts’ Viewpoint on Market Scenario
Key players, such as NORTEC, Yokohama Rubber Co. Ltd., Deere & Company, Nokian Tires Plc, Balkrishna Industries Ltd., Maxxis International, and Trelleborg AB, operating in the global forestry tire industry are focusing on the upgrade of performance of forestry tires to offer their customers with a product portfolio, which is innovative, and offers cutting-edge benefits that are cost-effective and diverse. Consequently, the market growth is likely to be at decent pace during the forecast period. Forestry tires are designed to improve the efficiency of forestry vehicles by enhancing their safety features. Furthermore, manufacturers are emphasizing on the development of forestry tires that perform well on different terrain and in diverse weather conditions to ensure safety and reduce the chances of failure or accidents. Rise in demand for larger land area, which we can be fulfilled by converting forests into even land, is a key factor driving market expansion.
Forestry tires use a unique tread composition and feature extremely thick sidewalls and under tread. The strengthened bead of these tires provide exceptional improvement in performance. Moreover, the lower lug angle of the tire demonstrates self-cleaning properties and offers great grip due to its broad inter-lug gap, which is essential in logging applications. Forestry tires have a reinforced structure to cope with terrain that is majorly rough and uneven, this structure provides additional resisting capacity. The diagonal belted construction offers higher rigidity to the forestry tires.
Furthermore, the forestry tire market prospects appear fairly promising due to an increase in movement of population from villages and small towns to urban areas, which is creating a gap between demand and supply of land area.
Rise in public and private sector investments in infrastructure development projects is a key factor boosting the demand for forestry tires globally. This, together with growing urbanization, is contributing to market expansion. Furthermore, rise in disposable income among the general public and increase in global population are also contributing to the global demand for forestry tires.
Ongoing improvements in the forestry sector; a significant population shift from rural to urban areas; the rapid adoption of technological innovation in the forest sector, which necessitates the most advanced tires; and the introduction of new generation tires that can operate in various terrains are also driving market development.
The market for forestry vehicles is constantly expanding owing to rapid expansion of plants and factories. Forestry work is repetitive, precise, and time-sensitive, which makes it a perfect application for advanced machines. Autonomous forestry equipment is being developed by manufacturers that can communicate wirelessly by interfering with the radio signals of other machinery, asking for guidance, and reporting its status. It ensures increased output, a reduction in unplanned maintenance, and improved safety.
Increased demand for increased work efficiency of forestry vehicles is encouraging the use of forestry material handling equipment and other forestry vehicles that help minimize the overall cost of the operation by minimizing human errors.
Forestry tire manufacturers are incorporating technical advancements into their tyres, such as radialization, tire pressure monitoring systems, cut and chip resistance, etc., to cater to the demand from equipment manufacturers. High abrasion resistance and fuel and energy-efficient characteristics are being included in modern forestry tires. The newest technological developments in forestry tires are likely to focus on achieving larger weight bearing capacities, faster speeds, and low rolling resistance.
One of the top features of bias tires is that they offer maximum stability for all types of operations performed in sparse or dense forest areas. Their precise tread design and features ensure maximum adhesion at any time, even while operating on the toughest surfaces. This makes loading and moving operations efficient and smooth and ensures highest resistance to accidental damages, including cuts and ruptures.
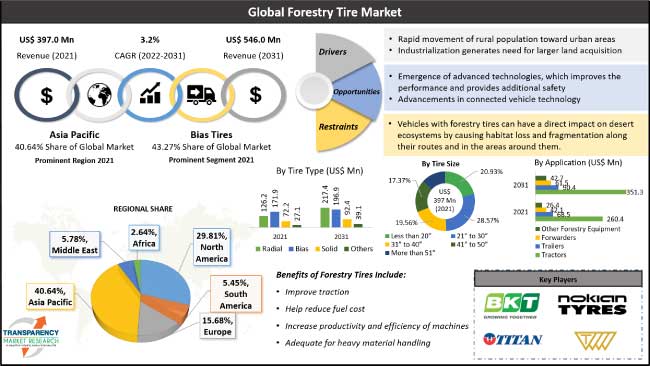
Bias tires are the most common type of tires used worldwide. A key market trend likely to be witnessed during the forecast period is the switch from bias to radial tires. The preference for radial tyres is expected to change rather rapidly in North America and Europe. However, in South America and Asia Pacific, bias tires are still commonly utilized.
In terms of tire size, the 21" to 30" segment led the global industry demand, in terms of volume and revenue, in 2021. The segment and is anticipated to maintain its dominance during the forecast period. This is due to the existence of medium- to large-sized forestry vehicles in various nations. Various equipment are used in forestry areas, including tractors, trailers, and forwarders, to ensure easy material handling and transportation. These equipment are equipped with mid-sized forestry tires; however, but it becomes necessary to replace them with new ones because of continuous use on rough terrain, which drives the price of these tires.
In terms of region, the global market analysis reveals that, Asia Pacific dominates the global industry owing to the presence of two of the highest populated countries China and India, which are also the second- and fifth-largest economies in the world, respectively. China is one of the top manufacturers of forestry tires in Asia Pacific. The region is expected to account for a prominent share of the global market demand for forest tires by the end of the forecast period, followed by North America and Europe, in terms of volume and revenue, respectively.
North America was also a prominent market for forestry tire in 2021. The crash of the construction market in the U.S. has played a huge role in the forestry products industry in North America in the last few years. The global economic downturn has also impacted exports of lumber from the region.
The global forestry tire business is fairly consolidated with the largest players controlling a majority of the global market share. A majority of the firms are focusing on introduction of high performance tires through extensive R&D activities. Major business strategies adopted by key forest tire manufacturers include acquisitions, mergers, and expansion of product portfolios. Yokohama Rubber Co. Ltd., Apollo Tyres Ltd., JK Tire & Industries Ltd, Continental AG, Deere & Company, Trelleborg AB, Nokian Tires Plc, NORTEC, Maxxis International, Sumitomo Rubber Industries Ltd., Nexen Tire Corporation, Titan International Inc., Balkrishna Industries Ltd. are a few of the prominent market players.
Key players in the market research report have been analyzed in terms of financial overview, business strategies, business segments, product portfolio, and recent developments.
|
Attribute |
Detail |
|
Market Size Value in 2021 (Base Year) |
US$ 397.0 Mn |
|
Market Forecast Value in 2031 |
US$ 546.0 Mn |
|
Growth Rate (CAGR) |
3.2% |
|
Forecast Period |
2022-2031 |
|
Quantitative Units |
Thousand Units for Volume US$ Mn for Value |
|
Market Analysis |
It includes cross segment analysis at global as well as regional level. Furthermore, qualitative analysis includes drivers, restraints, opportunities, key trends, Porters Five Forces analysis, Value chain analysis, Forestry Tire industry analysis, Forestry Tire market size, Forestry Tire market growth etc. |
|
Competition Landscape |
|
|
Format |
Electronic (PDF) + Excel |
|
Market Segmentation |
|
|
Regions Covered |
|
|
Countries Covered |
|
|
Companies Profiled |
|
|
Customization Scope |
Available upon Request |
|
Pricing |
Available upon Request |
The market was valued at US$ 397.0 Mn in 2021
It is expected to grow at a CAGR of 3.22% by 2031
It is estimated to reach a value of US$ 546.0 Mn in 2031
NORTEC, Yokohama Rubber Co. Ltd., Deere & Company, Nokian Tires Plc, Balkrishna Industries Ltd., Maxxis International, Trelleborg AB, Interco Tire Corporation, Apollo Tyres Ltd., Sumitomo Rubber Industries Ltd., and Nexen Tire Corporation.
China is a prominent market for forestry tires due to the presence of notable manufacturing industry players and large forests in the region, which drives the need of material handling equipment to ensure the ease in transportation of forestry goods.
The bias tire segment accounted for the largest share (43.27%) in 2021.
Ply rating is the major parameter determining the efficiency and durability of the any forestry tire because an equipment consistently deals with higher weighted materials.
Asia Pacific is the most lucrative region for the forestry tire and holds the dominant market share.
1. Executive Summary
1.1. Global Market Outlook
1.1.1. Market Value US$ Mn, 2017-2031
1.2. Competitive Dashboard Analysis
2. Market Overview
2.1. TMR Analysis and Recommendations
2.2. Market Coverage / Taxonomy
2.3. Market Definition / Scope / Limitations
2.4. Macro-Economic Factors
2.5. Market Dynamics
2.5.1. Drivers
2.5.2. Restraints
2.5.3. Opportunity
2.6. Market Factor Analysis
2.6.1. Porter’s Five Force Analysis
2.6.2. SWOT Analysis
2.7. Regulatory Scenario
2.8. Key Trend Analysis
3. Industry Ecosystem Analysis
3.1. Value Chain Analysis
3.2. Gross Margin Analysis
4. COVID-19 Impact Analysis – Forestry Tire Market
5. Pricing Analysis
6. Global Forestry Tire Market, by Material Type
6.1. Market Snapshot
6.1.1. Introduction, Definition, and Key Findings
6.1.2. Market Growth & Y-o-Y Projections
6.1.3. Base Point Share Analysis
6.2. Global Forestry Tire Market Size Analysis & Forecast, 2017-2031, by Material Type
6.2.1. Synthetic Rubber
6.2.2. Natural Rubber
6.2.3. Carbon Black
6.2.4. Fabrics & Wire
7. Global Forestry Tire Market, by Tire Size
7.1. Market Snapshot
7.1.1. Introduction, Definition, and Key Findings
7.1.2. Market Growth & Y-o-Y Projections
7.1.3. Base Point Share Analysis
7.2. Global Forestry Tire Market Size Analysis & Forecast, 2017-2031, by Tire Size
7.2.1. Less than 20”
7.2.2. 21” to 30”
7.2.3. 31” to 40”
7.2.4. 41” to 50”
7.2.5. More than 51”
8. Global Forestry Tire Market, by Tire Type
8.1. Market Snapshot
8.1.1. Introduction, Definition, and Key Findings
8.1.2. Market Growth & Y-o-Y Projections
8.1.3. Base Point Share Analysis
8.2. Global Forestry Tire Market Size Analysis & Forecast, 2017-2031, by Tire Type
8.2.1. Radial
8.2.2. Bias
8.2.3. Solid
8.2.4. Others
9. Global Forestry Tire Market, by Application
9.1. Market Snapshot
9.1.1. Introduction, Definition, and Key Findings
9.1.2. Market Growth & Y-o-Y Projections
9.1.3. Base Point Share Analysis
9.2. Global Forestry Tire Market Size Analysis & Forecast, 2017-2031, by Application
9.2.1. Tractors
9.2.2. Trailers
9.2.3. Forwarders
9.2.4. Other Forestry Equipment
10. Global Forestry Tire Market, by Sales Channel
10.1. Market Snapshot
10.1.1. Introduction, Definition, and Key Findings
10.1.2. Market Growth & Y-o-Y Projections
10.1.3. Base Point Share Analysis
10.2. Global Forestry Tire Market Size Analysis & Forecast, 2017-2031, by Sales Channel
10.2.1. OEM
10.2.2. Aftermarket
11. Global Forestry Tire Market, by Region
11.1. Market Snapshot
11.1.1. Introduction, Definition, and Key Findings
11.1.2. Market Growth & Y-o-Y Projections
11.1.3. Base Point Share Analysis
11.2. Global Forestry Tire Market Size Analysis & Forecast, 2017-2031, by Region
11.2.1. North America
11.2.2. Europe
11.2.3. Asia Pacific
11.2.4. Middle East & Africa
11.2.5. South America
12. North America Forestry Tire Market
12.1. Market Snapshot
12.2. North America Forestry Tire Market Size Analysis & Forecast, 2017-2031, by Material Type
12.2.1. Synthetic Rubber
12.2.2. Natural Rubber
12.2.3. Carbon Black
12.2.4. Fabrics & Wire
12.3. North America Forestry Tire Market Size Analysis & Forecast, 2017-2031, by Tire Size
12.3.1. Less than 20”
12.3.2. 21” to 30”
12.3.3. 31” to 40”
12.3.4. 41” to 50”
12.3.5. More than 51”
12.4. North America Forestry Tire Market Size Analysis & Forecast, 2017-2031, by Tire Type
12.4.1. Radial
12.4.2. Bias
12.4.3. Solid
12.4.4. Others
12.5. North America Forestry Tire Market Size Analysis & Forecast, 2017-2031, by Application
12.5.1. Tractors
12.5.2. Trailers
12.5.3. Forwarders
12.5.4. Other Forestry Equipment
12.6. North America Forestry Tire Market Size Analysis & Forecast, 2017-2031, by Sales Channel
12.6.1. OEM
12.6.2. Aftermarket
12.7. Key Country Analysis – North America Forestry Tire Market Size Analysis & Forecast, 2017-2031
12.7.1. U.S.
12.7.2. Canada
12.7.3. Mexico
13. Europe Forestry Tire Market
13.1. Market Snapshot
13.2. Europe Forestry Tire Market Size Analysis & Forecast, 2017-2031, by Material Type
13.2.1. Synthetic Rubber
13.2.2. Natural Rubber
13.2.3. Carbon Black
13.2.4. Fabrics & Wire
13.3. Europe Forestry Tire Market Size Analysis & Forecast, 2017-2031, by Tire Size
13.3.1. Less than 20”
13.3.2. 21” to 30”
13.3.3. 31” to 40”
13.3.4. 41” to 50”
13.3.5. More than 51”
13.4. Europe Forestry Tire Market Size Analysis & Forecast, 2017-2031, by Tire Type
13.4.1. Radial
13.4.2. Bias
13.4.3. Solid
13.4.4. Others
13.5. Europe Forestry Tire Market Size Analysis & Forecast, 2017-2031, by Application
13.5.1. Tractors
13.5.2. Trailers
13.5.3. Forwarders
13.5.4. Other Forestry Equipment
13.6. Europe Forestry Tire Market Size Analysis & Forecast, 2017-2031, by Sales Channel
13.6.1. OEM
13.6.2. Aftermarket
13.7. Key Country Analysis – Europe Forestry Tire Market Size Analysis & Forecast, 2017-2031
13.7.1. Germany
13.7.2. U. K.
13.7.3. France
13.7.4. Italy
13.7.5. Spain
13.7.6. Nordic Countries
13.7.7. Russia & CIS
13.7.8. Rest of Europe
14. Asia Pacific Forestry Tire Market
14.1. Market Snapshot
14.2. Asia Pacific Forestry Tire Market Size Analysis & Forecast, 2017-2031, by Material Type
14.2.1. Synthetic Rubber
14.2.2. Natural Rubber
14.2.3. Carbon Black
14.2.4. Fabrics & Wire
14.3. Asia Pacific Forestry Tire Market Size Analysis & Forecast, 2017-2031, by Tire Size
14.3.1. Less than 20”
14.3.2. 21” to 30”
14.3.3. 31” to 40”
14.3.4. 41” to 50”
14.3.5. More than 51”
14.4. Asia Pacific Forestry Tire Market Size Analysis & Forecast, 2017-2031, by Tire Type
14.4.1. Radial
14.4.2. Bias
14.4.3. Solid
14.4.4. Others
14.5. Asia Pacific Forestry Tire Market Size Analysis & Forecast, 2017-2031, by Application
14.5.1. Tractors
14.5.2. Trailers
14.5.3. Forwarders
14.5.4. Other Forestry Equipment
14.6. Asia Pacific Forestry Tire Market Size Analysis & Forecast, 2017-2031, by Sales Channel
14.6.1. OEM
14.6.2. Aftermarket
14.7. Key Country Analysis – Asia Pacific Forestry Tire Market Size Analysis & Forecast, 2017-2031
14.7.1. China
14.7.2. India
14.7.3. Japan
14.7.4. ASEAN Countries
14.7.5. South Korea
14.7.6. ANZ
14.7.7. Rest of Asia Pacific
15. Middle East & Africa Forestry Tire Market
15.1. Market Snapshot
15.2. Middle East & Africa Forestry Tire Market Size Analysis & Forecast, 2017-2031, by Material Type
15.2.1. Synthetic Rubber
15.2.2. Natural Rubber
15.2.3. Carbon Black
15.2.4. Fabrics & Wire
15.3. Middle East & Africa Forestry Tire Market Size Analysis & Forecast, 2017-2031, by Tire Size
15.3.1. Less than 20”
15.3.2. 21” to 30”
15.3.3. 31” to 40”
15.3.4. 41” to 50”
15.3.5. More than 51”
15.4. Middle East & Africa Forestry Tire Market Size Analysis & Forecast, 2017-2031, by Tire Type
15.4.1. Radial
15.4.2. Bias
15.4.3. Solid
15.4.4. Others
15.5. Middle East & Africa Forestry Tire Market Size Analysis & Forecast, 2017-2031, by Application
15.5.1. Tractors
15.5.2. Trailers
15.5.3. Forwarders
15.5.4. Other Forestry Equipment
15.6. Middle East & Africa Forestry Tire Market Size Analysis & Forecast, 2017-2031, by Sales Channel
15.6.1. OEM
15.6.2. Aftermarket
15.7. Key Country Analysis – Middle East & Africa Forestry Tire Market Size Analysis & Forecast, 2017-2031
15.7.1. GCC
15.7.2. South Africa
15.7.3. Turkey
15.7.4. Rest of Middle East & Africa
16. South America Forestry Tire Market
16.1. Market Snapshot
16.2. South America Forestry Tire Market Size Analysis & Forecast, 2017-2031, by Material Type
16.2.1. Synthetic Rubber
16.2.2. Natural Rubber
16.2.3. Carbon Black
16.2.4. Fabrics & Wire
16.3. South America Forestry Tire Market Size Analysis & Forecast, 2017-2031, by Tire Size
16.3.1. Less than 20”
16.3.2. 21” to 30”
16.3.3. 31” to 40”
16.3.4. 41” to 50”
16.3.5. More than 51”
16.4. South America Forestry Tire Market Size Analysis & Forecast, 2017-2031, by Tire Type
16.4.1. Radial
16.4.2. Bias
16.4.3. Solid
16.4.4. Others
16.5. South America Forestry Tire Market Size Analysis & Forecast, 2017-2031, by Application
16.5.1. Tractors
16.5.2. Trailers
16.5.3. Forwarders
16.5.4. Other Forestry Equipment
16.6. South America Forestry Tire Market Size Analysis & Forecast, 2017-2031, by Sales Channel
16.6.1. OEM
16.6.2. Aftermarket
16.7. Key Country Analysis – South America Forestry Tire Market Size Analysis & Forecast, 2017-2031
16.7.1. Brazil
16.7.2. Argentina
16.7.3. Rest of South America
17. Competitive Landscape
17.1. Company Share Analysis/ Brand Share Analysis, 2021
17.2. Pricing comparison among key players
17.3. Company Analysis for each player (Company Overview, Company Footprints, Production Locations, Product Portfolio, Competitors & Customers, Subsidiaries & Parent Organization, Recent Developments, Financial Analysis, Profitability, Revenue Share)
18. Company Profile/ Key Players
18.1. NORTEC
18.1.1. Company Overview
18.1.2. Company Footprints
18.1.3. Production Locations
18.1.4. Product Portfolio
18.1.5. Competitors & Customers
18.1.6. Subsidiaries & Parent Organization
18.1.7. Recent Developments
18.1.8. Financial Analysis
18.1.9. Profitability
18.1.10. Revenue Share
18.2. Interco Tire Corporation
18.2.1. Company Overview
18.2.2. Company Footprints
18.2.3. Production Locations
18.2.4. Product Portfolio
18.2.5. Competitors & Customers
18.2.6. Subsidiaries & Parent Organization
18.2.7. Recent Developments
18.2.8. Financial Analysis
18.2.9. Profitability
18.2.10. Revenue Share
18.3. Yokohama Rubber Co. Ltd.
18.3.1. Company Overview
18.3.2. Company Footprints
18.3.3. Production Locations
18.3.4. Product Portfolio
18.3.5. Competitors & Customers
18.3.6. Subsidiaries & Parent Organization
18.3.7. Recent Developments
18.3.8. Financial Analysis
18.3.9. Profitability
18.3.10. Revenue Share
18.4. Apollo Tyres Ltd.
18.4.1. Company Overview
18.4.2. Company Footprints
18.4.3. Production Locations
18.4.4. Product Portfolio
18.4.5. Competitors & Customers
18.4.6. Subsidiaries & Parent Organization
18.4.7. Recent Developments
18.4.8. Financial Analysis
18.4.9. Profitability
18.4.10. Revenue Share
18.5. JK Tire & Industries Ltd
18.5.1. Company Overview
18.5.2. Company Footprints
18.5.3. Production Locations
18.5.4. Product Portfolio
18.5.5. Competitors & Customers
18.5.6. Subsidiaries & Parent Organization
18.5.7. Recent Developments
18.5.8. Financial Analysis
18.5.9. Profitability
18.5.10. Revenue Share
18.6. Bridgestone Corporation
18.6.1. Company Overview
18.6.2. Company Footprints
18.6.3. Production Locations
18.6.4. Product Portfolio
18.6.5. Competitors & Customers
18.6.6. Subsidiaries & Parent Organization
18.6.7. Recent Developments
18.6.8. Financial Analysis
18.6.9. Profitability
18.6.10. Revenue Share
18.7. Continental AG
18.7.1. Company Overview
18.7.2. Company Footprints
18.7.3. Production Locations
18.7.4. Product Portfolio
18.7.5. Competitors & Customers
18.7.6. Subsidiaries & Parent Organization
18.7.7. Recent Developments
18.7.8. Financial Analysis
18.7.9. Profitability
18.7.10. Revenue Share
18.8. Michelin
18.8.1. Company Overview
18.8.2. Company Footprints
18.8.3. Production Locations
18.8.4. Product Portfolio
18.8.5. Competitors & Customers
18.8.6. Subsidiaries & Parent Organization
18.8.7. Recent Developments
18.8.8. Financial Analysis
18.8.9. Profitability
18.8.10. Revenue Share
18.9. Deere & Company
18.9.1. Company Overview
18.9.2. Company Footprints
18.9.3. Production Locations
18.9.4. Product Portfolio
18.9.5. Competitors & Customers
18.9.6. Subsidiaries & Parent Organization
18.9.7. Recent Developments
18.9.8. Financial Analysis
18.9.9. Profitability
18.9.10. Revenue Share
18.10. Trelleborg AB
18.10.1. Company Overview
18.10.2. Company Footprints
18.10.3. Production Locations
18.10.4. Product Portfolio
18.10.5. Competitors & Customers
18.10.6. Subsidiaries & Parent Organization
18.10.7. Recent Developments
18.10.8. Financial Analysis
18.10.9. Profitability
18.10.10. Revenue Share
18.11. Nokian Tires Plc
18.11.1. Company Overview
18.11.2. Company Footprints
18.11.3. Production Locations
18.11.4. Product Portfolio
18.11.5. Competitors & Customers
18.11.6. Subsidiaries & Parent Organization
18.11.7. Recent Developments
18.11.8. Financial Analysis
18.11.9. Profitability
18.11.10. Revenue Share
18.12. Maxxis International
18.12.1. Company Overview
18.12.2. Company Footprints
18.12.3. Production Locations
18.12.4. Product Portfolio
18.12.5. Competitors & Customers
18.12.6. Subsidiaries & Parent Organization
18.12.7. Recent Developments
18.12.8. Financial Analysis
18.12.9. Profitability
18.12.10. Revenue Share
18.13. Sumitomo Rubber Industries Ltd.
18.13.1. Company Overview
18.13.2. Company Footprints
18.13.3. Production Locations
18.13.4. Product Portfolio
18.13.5. Competitors & Customers
18.13.6. Subsidiaries & Parent Organization
18.13.7. Recent Developments
18.13.8. Financial Analysis
18.13.9. Profitability
18.13.10. Revenue Share
18.14. Nexen Tire Corporation
18.14.1. Company Overview
18.14.2. Company Footprints
18.14.3. Production Locations
18.14.4. Product Portfolio
18.14.5. Competitors & Customers
18.14.6. Subsidiaries & Parent Organization
18.14.7. Recent Developments
18.14.8. Financial Analysis
18.14.9. Profitability
18.14.10. Revenue Share
18.15. Titan International Inc.
18.15.1. Company Overview
18.15.2. Company Footprints
18.15.3. Production Locations
18.15.4. Product Portfolio
18.15.5. Competitors & Customers
18.15.6. Subsidiaries & Parent Organization
18.15.7. Recent Developments
18.15.8. Financial Analysis
18.15.9. Profitability
18.15.10. Revenue Share
18.16. Balkrishna Industries Ltd
18.16.1. Company Overview
18.16.2. Company Footprints
18.16.3. Production Locations
18.16.4. Product Portfolio
18.16.5. Competitors & Customers
18.16.6. Subsidiaries & Parent Organization
18.16.7. Recent Developments
18.16.8. Financial Analysis
18.16.9. Profitability
18.16.10. Revenue Share
18.17. Other Key Players
List of Tables
Table 1: Global Forestry Tire Market Volume (Thousand Units) Forecast, by Material Type, 2017‒2031
Table 2: Global Forestry Tire Market Value (US$ Mn) Forecast, by Material Type, 2017‒2031
Table 3: Global Forestry Tire Market Volume (Thousand Units) Forecast, by Tire Size, 2017‒2031
Table 4: Global Forestry Tire Market Value (US$ Mn) Forecast, by Tire Size, 2017‒2031
Table 5: Global Forestry Tire Market Volume (Thousand Units) Forecast, by Tire Type, 2017‒2031
Table 6: Global Forestry Tire Market Value (US$ Mn) Forecast, by Tire Type, 2017‒2031
Table 7: Global Forestry Tire Market Volume (Thousand Units) Forecast, by Application, 2017‒2031
Table 8: Global Forestry Tire Market Value (US$ Mn) Forecast, by Application, 2017‒2031
Table 9: Global Forestry Tire Market Volume (Thousand Units) Forecast, by Sales Channel, 2017‒2031
Table 10: Global Forestry Tire Market Value (US$ Mn) Forecast, by Sales Channel, 2017‒2031
Table 11: Global Forestry Tire Market Volume (Thousand Units) Forecast, by Region, 2017‒2031
Table 12: Global Forestry Tire Market Value (US$ Mn) Forecast, by Region, 2017‒2031
Table 13: North America Forestry Tire Market Volume (Thousand Units) Forecast, by Material Type, 2017‒2031
Table 14: North America Forestry Tire Market Value (US$ Mn) Forecast, by Material Type, 2017‒2031
Table 15: North America Forestry Tire Market Volume (Thousand Units) Forecast, by Tire Size, 2017‒2031
Table 16: North America Forestry Tire Market Value (US$ Mn) Forecast, by Tire Size, 2017‒2031
Table 17: North America Forestry Tire Market Volume (Thousand Units) Forecast, by Tire Type, 2017‒2031
Table 18: North America Forestry Tire Market Value (US$ Mn) Forecast, by Tire Type, 2017‒2031
Table 19: North America Forestry Tire Market Volume (Thousand Units) Forecast, by Application, 2017‒2031
Table 20: North America Forestry Tire Market Value (US$ Mn) Forecast, by Application, 2017‒2031
Table 21: North America Forestry Tire Market Volume (Thousand Units) Forecast, by Sales Channel, 2017‒2031
Table 22: North America Forestry Tire Market Value (US$ Mn) Forecast, by Sales Channel, 2017‒2031
Table 23: North America Forestry Tire Market Volume (Thousand Units) Forecast, by Country, 2017‒2031
Table 24: North America Forestry Tire Market Value (US$ Mn) Forecast, by Country, 2017‒2031
Table 25: Europe Forestry Tire Market Volume (Thousand Units) Forecast, by Material Type, 2017‒2031
Table 26: Europe Forestry Tire Market Value (US$ Mn) Forecast, by Material Type, 2017‒2031
Table 27: Europe Forestry Tire Market Volume (Thousand Units) Forecast, by Tire Size, 2017‒2031
Table 28: Europe Forestry Tire Market Value (US$ Mn) Forecast, by Tire Size, 2017‒2031
Table 29: Europe Forestry Tire Market Volume (Thousand Units) Forecast, by Tire Type, 2017‒2031
Table 30: Europe Forestry Tire Market Value (US$ Mn) Forecast, by Tire Type, 2017‒2031
Table 31: Europe Forestry Tire Market Volume (Thousand Units) Forecast, by Application, 2017‒2031
Table 32: Europe Forestry Tire Market Value (US$ Mn) Forecast, by Application, 2017‒2031
Table 33: Europe Forestry Tire Market Volume (Thousand Units) Forecast, by Sales Channel, 2017‒2031
Table 34: Europe Forestry Tire Market Value (US$ Mn) Forecast, by Sales Channel, 2017‒2031
Table 35: Europe Forestry Tire Market Volume (Thousand Units) Forecast, by Country, 2017‒2031
Table 36: Europe Forestry Tire Market Value (US$ Mn) Forecast, by Country, 2017‒2031
Table 37: Asia Pacific Forestry Tire Market Volume (Thousand Units) Forecast, by Material Type, 2017‒2031
Table 38: Asia Pacific Forestry Tire Market Value (US$ Mn) Forecast, by Material Type, 2017‒2031
Table 39: Asia Pacific Forestry Tire Market Volume (Thousand Units) Forecast, by Tire Size, 2017‒2031
Table 40: Asia Pacific Forestry Tire Market Value (US$ Mn) Forecast, by Tire Size, 2017‒2031
Table 41: Asia Pacific Forestry Tire Market Volume (Thousand Units) Forecast, by Tire Type, 2017‒2031
Table 42: Asia Pacific Forestry Tire Market Value (US$ Mn) Forecast, by Tire Type, 2017‒2031
Table 43: Asia Pacific Forestry Tire Market Volume (Thousand Units) Forecast, by Application, 2017‒2031
Table 44: Asia Pacific Forestry Tire Market Value (US$ Mn) Forecast, by Application, 2017‒2031
Table 45: Asia Pacific Forestry Tire Market Volume (Thousand Units) Forecast, by Sales Channel, 2017‒2031
Table 46: Asia Pacific Forestry Tire Market Value (US$ Mn) Forecast, by Sales Channel, 2017‒2031
Table 47: Asia Pacific Forestry Tire Market Volume (Thousand Units) Forecast, by Country, 2017‒2031
Table 48: Asia Pacific Forestry Tire Market Value (US$ Mn) Forecast, by Country, 2017‒2031
Table 49: Middle East & Africa Forestry Tire Market Volume (Thousand Units) Forecast, by Material Type, 2017‒2031
Table 50: Middle East & Africa Forestry Tire Market Value (US$ Mn) Forecast, by Material Type, 2017‒2031
Table 51: Middle East & Africa Forestry Tire Market Volume (Thousand Units) Forecast, by Tire Size, 2017‒2031
Table 52: Middle East & Africa Forestry Tire Market Value (US$ Mn) Forecast, by Tire Size, 2017‒2031
Table 53: Middle East & Africa Forestry Tire Market Volume (Thousand Units) Forecast, by Tire Type, 2017‒2031
Table 54: Middle East & Africa Forestry Tire Market Value (US$ Mn) Forecast, by Tire Type, 2017‒2031
Table 55: Middle East & Africa Forestry Tire Market Volume (Thousand Units) Forecast, by Application, 2017‒2031
Table 56: Middle East & Africa Forestry Tire Market Value (US$ Mn) Forecast, by Application, 2017‒2031
Table 57: Middle East & Africa Forestry Tire Market Volume (Thousand Units) Forecast, by Sales Channel, 2017‒2031
Table 58: Middle East & Africa Forestry Tire Market Value (US$ Mn) Forecast, by Sales Channel, 2017‒2031
Table 59: Middle East & Africa Forestry Tire Market Volume (Thousand Units) Forecast, by Country, 2017‒2031
Table 60: Middle East & Africa Forestry Tire Market Value (US$ Mn) Forecast, by Country, 2017‒2031
Table 61: South America Forestry Tire Market Volume (Thousand Units) Forecast, by Material Type, 2017‒2031
Table 62: South America Forestry Tire Market Value (US$ Mn) Forecast, by Material Type, 2017‒2031
Table 63: South America Forestry Tire Market Volume (Thousand Units) Forecast, by Tire Size, 2017‒2031
Table 64: South America Forestry Tire Market Value (US$ Mn) Forecast, by Tire Size, 2017‒2031
Table 65: South America Forestry Tire Market Volume (Thousand Units) Forecast, by Tire Type, 2017‒2031
Table 66: South America Forestry Tire Market Value (US$ Mn) Forecast, by Tire Type, 2017‒2031
Table 67: South America Forestry Tire Market Volume (Thousand Units) Forecast, by Application, 2017‒2031
Table 68: South America Forestry Tire Market Value (US$ Mn) Forecast, by Application, 2017‒2031
Table 69: South America Forestry Tire Market Volume (Thousand Units) Forecast, by Sales Channel, 2017‒2031
Table 70: South America Forestry Tire Market Value (US$ Mn) Forecast, by Sales Channel, 2017‒2031
Table 71: South America Forestry Tire Market Volume (Thousand Units) Forecast, by Country, 2017‒2031
Table 72: South America Forestry Tire Market Value (US$ Mn) Forecast, by Country, 2017‒2031
List of Figures
Figure 1: Global Forestry Tire Market Volume (Thousand Units) Forecast, by Material Type, 2017‒2031
Figure 2: Global Forestry Tire Market Value (US$ Mn) Forecast, by Material Type, 2017‒2031
Figure 3: Global Forestry Tire Market, Incremental Opportunity, by Material Type, Value (US$ Mn), 2022‒2031
Figure 4: Global Forestry Tire Market Volume (Thousand Units) Forecast, by Tire Size, 2017‒2031
Figure 5: Global Forestry Tire Market Value (US$ Mn) Forecast, by Tire Size, 2017‒2031
Figure 6: Global Forestry Tire Market, Incremental Opportunity, by Tire Size, Value (US$ Mn), 2022‒2031
Figure 7: Global Forestry Tire Market Volume (Thousand Units) Forecast, by Tire Type, 2017‒2031
Figure 8: Global Forestry Tire Market Value (US$ Mn) Forecast, by Tire Type, 2017‒2031
Figure 9: Global Forestry Tire Market, Incremental Opportunity, by Tire Type, Value (US$ Mn), 2022‒2031
Figure 10: Global Forestry Tire Market Volume (Thousand Units) Forecast, by Application, 2017‒2031
Figure 11: Global Forestry Tire Market Value (US$ Mn) Forecast, by Application, 2017‒2031
Figure 12: Global Forestry Tire Market, Incremental Opportunity, by Application, Value (US$ Mn), 2022‒2031
Figure 13: Global Forestry Tire Market Volume (Thousand Units) Forecast, by Sales Channel, 2017‒2031
Figure 14: Global Forestry Tire Market Value (US$ Mn) Forecast, by Sales Channel, 2017‒2031
Figure 15: Global Forestry Tire Market, Incremental Opportunity, by Sales Channel, Value (US$ Mn), 2022‒2031
Figure 16: Global Forestry Tire Market Volume (Thousand Units) Forecast, by Region, 2017‒2031
Figure 17: Global Forestry Tire Market Value (US$ Mn) Forecast, by Region, 2017‒2031
Figure 18: Global Forestry Tire Market, Incremental Opportunity, by Region, Value (US$ Mn), 2022‒2031
Figure 19: North America Forestry Tire Market Volume (Thousand Units) Forecast, by Material Type, 2017‒2031
Figure 20: North America Forestry Tire Market Value (US$ Mn) Forecast, by Material Type, 2017‒2031
Figure 21: North America Forestry Tire Market, Incremental Opportunity, by Material Type, Value (US$ Mn), 2022‒2031
Figure 22: North America Forestry Tire Market Volume (Thousand Units) Forecast, by Tire Size, 2017‒2031
Figure 23: North America Forestry Tire Market Value (US$ Mn) Forecast, by Tire Size, 2017‒2031
Figure 24: North America Forestry Tire Market, Incremental Opportunity, by Tire Size, Value (US$ Mn), 2022‒2031
Figure 25: North America Forestry Tire Market Volume (Thousand Units) Forecast, by Tire Type, 2017‒2031
Figure 26: North America Forestry Tire Market Value (US$ Mn) Forecast, by Tire Type, 2017‒2031
Figure 27: North America Forestry Tire Market, Incremental Opportunity, by Tire Type, Value (US$ Mn), 2022‒2031
Figure 28: North America Forestry Tire Market Volume (Thousand Units) Forecast, by Application, 2017‒2031
Figure 29: North America Forestry Tire Market Value (US$ Mn) Forecast, by Application, 2017‒2031
Figure 30: North America Forestry Tire Market, Incremental Opportunity, by Application, Value (US$ Mn), 2022‒2031
Figure 31: North America Forestry Tire Market Volume (Thousand Units) Forecast, by Sales Channel, 2017‒2031
Figure 32: North America Forestry Tire Market Value (US$ Mn) Forecast, by Sales Channel, 2017‒2031
Figure 33: North America Forestry Tire Market, Incremental Opportunity, by Sales Channel, Value (US$ Mn), 2022‒2031
Figure 34: North America Forestry Tire Market Volume (Thousand Units) Forecast, by Country, 2017‒2031
Figure 35: North America Forestry Tire Market Value (US$ Mn) Forecast, by Country, 2017‒2031
Figure 36: North America Forestry Tire Market, Incremental Opportunity, by Country, Value (US$ Mn), 2022‒2031
Figure 37: Europe Forestry Tire Market Volume (Thousand Units) Forecast, by Material Type, 2017‒2031
Figure 38: Europe Forestry Tire Market Value (US$ Mn) Forecast, by Material Type, 2017‒2031
Figure 39: Europe Forestry Tire Market, Incremental Opportunity, by Material Type, Value (US$ Mn), 2022‒2031
Figure 40: Europe Forestry Tire Market Volume (Thousand Units) Forecast, by Tire Size, 2017‒2031
Figure 41: Europe Forestry Tire Market Value (US$ Mn) Forecast, by Tire Size, 2017‒2031
Figure 42: Europe Forestry Tire Market, Incremental Opportunity, by Tire Size, Value (US$ Mn), 2022‒2031
Figure 43: Europe Forestry Tire Market Volume (Thousand Units) Forecast, by Tire Type, 2017‒2031
Figure 44: Europe Forestry Tire Market Value (US$ Mn) Forecast, by Tire Type, 2017‒2031
Figure 45: Europe Forestry Tire Market, Incremental Opportunity, by Tire Type, Value (US$ Mn), 2022‒2031
Figure 46: Europe Forestry Tire Market Volume (Thousand Units) Forecast, by Application, 2017‒2031
Figure 47: Europe Forestry Tire Market Value (US$ Mn) Forecast, by Application, 2017‒2031
Figure 48: Europe Forestry Tire Market, Incremental Opportunity, by Application, Value (US$ Mn), 2022‒2031
Figure 49: Europe Forestry Tire Market Volume (Thousand Units) Forecast, by Sales Channel, 2017‒2031
Figure 50: Europe Forestry Tire Market Value (US$ Mn) Forecast, by Sales Channel, 2017‒2031
Figure 51: Europe Forestry Tire Market, Incremental Opportunity, by Sales Channel, Value (US$ Mn), 2022‒2031
Figure 52: Europe Forestry Tire Market Volume (Thousand Units) Forecast, by Country, 2017‒2031
Figure 53: Europe Forestry Tire Market Value (US$ Mn) Forecast, by Country, 2017‒2031
Figure 54: Europe Forestry Tire Market, Incremental Opportunity, by Country, Value (US$ Mn), 2022‒2031
Figure 55: Asia Pacific Forestry Tire Market Volume (Thousand Units) Forecast, by Material Type, 2017‒2031
Figure 56: Asia Pacific Forestry Tire Market Value (US$ Mn) Forecast, by Material Type, 2017‒2031
Figure 57: Asia Pacific Forestry Tire Market, Incremental Opportunity, by Material Type, Value (US$ Mn), 2022‒2031
Figure 58: Asia Pacific Forestry Tire Market Volume (Thousand Units) Forecast, by Tire Size, 2017‒2031
Figure 59: Asia Pacific Forestry Tire Market Value (US$ Mn) Forecast, by Tire Size, 2017‒2031
Figure 60: Asia Pacific Forestry Tire Market, Incremental Opportunity, by Tire Size, Value (US$ Mn), 2022‒2031
Figure 61: Asia Pacific Forestry Tire Market Volume (Thousand Units) Forecast, by Tire Type, 2017‒2031
Figure 62: Asia Pacific Forestry Tire Market Value (US$ Mn) Forecast, by Tire Type, 2017‒2031
Figure 63: Asia Pacific Forestry Tire Market, Incremental Opportunity, by Tire Type, Value (US$ Mn), 2022‒2031
Figure 64: Asia Pacific Forestry Tire Market Volume (Thousand Units) Forecast, by Application, 2017‒2031
Figure 65: Asia Pacific Forestry Tire Market Value (US$ Mn) Forecast, by Application, 2017‒2031
Figure 66: Asia Pacific Forestry Tire Market, Incremental Opportunity, by Application, Value (US$ Mn), 2022‒2031
Figure 67: Asia Pacific Forestry Tire Market Volume (Thousand Units) Forecast, by Sales Channel, 2017‒2031
Figure 68: Asia Pacific Forestry Tire Market Value (US$ Mn) Forecast, by Sales Channel, 2017‒2031
Figure 69: Asia Pacific Forestry Tire Market, Incremental Opportunity, by Sales Channel, Value (US$ Mn), 2022‒2031
Figure 70: Asia Pacific Forestry Tire Market Volume (Thousand Units) Forecast, by Country, 2017‒2031
Figure 71: Asia Pacific Forestry Tire Market Value (US$ Mn) Forecast, by Country, 2017‒2031
Figure 72: Asia Pacific Forestry Tire Market, Incremental Opportunity, by Country, Value (US$ Mn), 2022‒2031
Figure 73: Middle East & Africa Forestry Tire Market Volume (Thousand Units) Forecast, by Material Type, 2017‒2031
Figure 74: Middle East & Africa Forestry Tire Market Value (US$ Mn) Forecast, by Material Type, 2017‒2031
Figure 75: Middle East & Africa Forestry Tire Market, Incremental Opportunity, by Material Type, Value (US$ Mn), 2022‒2031
Figure 76: Middle East & Africa Forestry Tire Market Volume (Thousand Units) Forecast, by Tire Size, 2017‒2031
Figure 77: Middle East & Africa Forestry Tire Market Value (US$ Mn) Forecast, by Tire Size, 2017‒2031
Figure 78: Middle East & Africa Forestry Tire Market, Incremental Opportunity, by Tire Size, Value (US$ Mn), 2022‒2031
Figure 79: Middle East & Africa Forestry Tire Market Volume (Thousand Units) Forecast, by Tire Type, 2017‒2031
Figure 80: Middle East & Africa Forestry Tire Market Value (US$ Mn) Forecast, by Tire Type, 2017‒2031
Figure 81: Middle East & Africa Forestry Tire Market, Incremental Opportunity, by Tire Type, Value (US$ Mn), 2022‒2031
Figure 82: Middle East & Africa Forestry Tire Market Volume (Thousand Units) Forecast, by Application, 2017‒2031
Figure 83: Middle East & Africa Forestry Tire Market Value (US$ Mn) Forecast, by Application, 2017‒2031
Figure 84: Middle East & Africa Forestry Tire Market, Incremental Opportunity, by Application, Value (US$ Mn), 2022‒2031
Figure 85: Middle East & Africa Forestry Tire Market Volume (Thousand Units) Forecast, by Sales Channel, 2017‒2031
Figure 86: Middle East & Africa Forestry Tire Market Value (US$ Mn) Forecast, by Sales Channel, 2017‒2031
Figure 87: Middle East & Africa Forestry Tire Market, Incremental Opportunity, by Sales Channel, Value (US$ Mn), 2022‒2031
Figure 88: Middle East & Africa Forestry Tire Market Volume (Thousand Units) Forecast, by Country, 2017‒2031
Figure 89: Middle East & Africa Forestry Tire Market Value (US$ Mn) Forecast, by Country, 2017‒2031
Figure 90: Middle East & Africa Forestry Tire Market, Incremental Opportunity, by Country, Value (US$ Mn), 2022‒2031
Figure 91: South America Forestry Tire Market Volume (Thousand Units) Forecast, by Material Type, 2017‒2031
Figure 92: South America Forestry Tire Market Value (US$ Mn) Forecast, by Material Type, 2017‒2031
Figure 93: South America Forestry Tire Market, Incremental Opportunity, by Material Type, Value (US$ Mn), 2022‒2031
Figure 94: South America Forestry Tire Market Volume (Thousand Units) Forecast, by Tire Size, 2017‒2031
Figure 95: South America Forestry Tire Market Value (US$ Mn) Forecast, by Tire Size, 2017‒2031
Figure 96: South America Forestry Tire Market, Incremental Opportunity, by Tire Size, Value (US$ Mn), 2022‒2031
Figure 97: South America Forestry Tire Market Volume (Thousand Units) Forecast, by Tire Type, 2017‒2031
Figure 98: South America Forestry Tire Market Value (US$ Mn) Forecast, by Tire Type, 2017‒2031
Figure 99: South America Forestry Tire Market, Incremental Opportunity, by Tire Type, Value (US$ Mn), 2022‒2031
Figure 100: South America Forestry Tire Market Volume (Thousand Units) Forecast, by Application, 2017‒2031
Figure 101: South America Forestry Tire Market Value (US$ Mn) Forecast, by Application, 2017‒2031
Figure 102: South America Forestry Tire Market, Incremental Opportunity, by Application, Value (US$ Mn), 2022‒2031
Figure 103: South America Forestry Tire Market Volume (Thousand Units) Forecast, by Sales Channel, 2017‒2031
Figure 104: South America Forestry Tire Market Value (US$ Mn) Forecast, by Sales Channel, 2017‒2031
Figure 105: South America Forestry Tire Market, Incremental Opportunity, by Sales Channel, Value (US$ Mn), 2022‒2031
Figure 106: South America Forestry Tire Market Volume (Thousand Units) Forecast, by Country, 2017‒2031
Figure 107: South America Forestry Tire Market Value (US$ Mn) Forecast, by Country, 2017‒2031
Figure 108: South America Forestry Tire Market, Incremental Opportunity, by Country, Value (US$ Mn), 2022‒2031
Copyright © Transparency Market Research, Inc. All Rights reserved
Trust Online

Forestry Tire Market