
Reports
Reports
For several decades, companies involved in the oil & gas sector are striving to reduce non-productive downtime (NPT) and increase the production of unconventional resources. The need to improve the production of unconventional resources is accelerating the development in the modern-day hydraulic fracturing technology. As companies are moving closer to reaching the tipping point of unconventional resource production, the focus on fast tracking and optimizing the entire process has gained significant momentum in the past few years. The process of optimization could vary due to various factors, and at present, stakeholders in the current fluid end assembly market are aiming to offer solutions that improve well and fracture replacement as well as the staging and sizing of frac clusters.
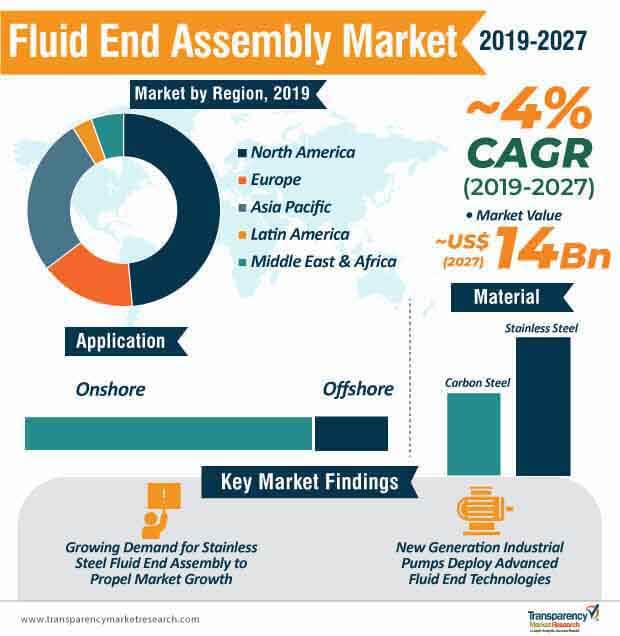
Stakeholders in the oil & gas industry are also focusing their resources on improving the durability and capabilities of their equipment. The growing need to improve efficiency and reduce downtime is likely to generate significant demand for fluid end assembly in the near future. Advancements in fluid end technologies are likely to address issues in frac pumps, which are at a higher risk of wearing out as corrosive materials are pumped through them. Thus, the global fluid end assembly market is expected to reach a market value of ~US$ 14 Bn by 2027 from ~US$ 10.2 Bn in 2019.
Over time, fluid ends have gained significant popularity as one of the most crucial components of a good service pump. Ever since fluid ends or fluid end assembly became mainstream in the 1950s, materials and designs used to produce fluid end have changed at a very slow pace. However, fluid ends are, time and again, exposed to a high degree of stress, subjected to high pressure, corrosive fluids, and abrasive materials at regular intervals, which significantly increases the chances of failure of fluid end assembly.
Stakeholders operating in the current fluid end assembly market are expected to provide optimum solutions to address these issues and make use of improved fluid end assembly designs and materials to gain a competitive edge. For several years, participants in the fluid end assembly market are in favor of using carbon steel to develop fluid ends. Although carbon steel offered the desired outcome, its vulnerability to corrosion led to a gradual decline in its adoption. On an average, the carbon steel fluid end has a lifecycle of around 250 to 450 hours, beyond which, it is prone to stress corrosion cracking. In their bid to address corrosion-related problems, participants in the fluid end assembly market have leaned toward the development and production of stainless steel fluid ends. The shift from carbon steel fluid ends to stainless steel fluid ends has played a key role in improving the end life of a fluid end assembly. Participants operating in the current fluid end assembly market landscape are also focusing on the quality of different grades of stainless steel. Despite the significant demand for carbon steel fluid end assembly, stainless steel fluid ends ultimately emerged as the most preferred choice of material. Within the fluid end assembly market, the stainless steel material segment is expected to account for over ~63% market share and reach a value of ~US$ 6.8 Bn in 2020.
In recent times, owing to the growing need to reduce downtime and improve efficiency across oil & gas and well service industries, pump manufacturers are introducing new and improved pumps, which, in turn, is expected to significantly impact the demand for fluid end assembly during the forecast period, thus driving the fluid end assembly market.
For instance, in December 2019, Gardner Denver manufactured a new pump, the Thunder 5,000 HP Quintuplex that was specifically developed for diesel engines, electric motors, gas turbine direct drives, and dual-fuel gas engines. The newly developed pump is developed using stainless steel and features the advanced fluid end technology.
Analysts’ Viewpoint
The fluid end assembly market is expected to grow at a steady CAGR of ~4% during the forecast period. Advancements in fluid end assembly designs, material, and geometry are some of the leading factors that are likely to propel the growth of the market for fluid end assembly. The demand for stainless steel fluid ends will continue during the forecast period, owing to favorable properties of stainless steel over carbon steel. Stakeholders should focus on improving the quality of their product offerings to gain an edge in the fluid end assembly market landscape. While offshore applications of fluid end assembly are likely to grow at a modest pace, fluid end assembly will be increasingly deployed in offshore applications.
Fluid End Assembly Market: Overview
Rise in Number of Enhanced Oil Recovery (EOR) Projects to Drive Fluid End Assembly Market
Volatility in Prices of Crude Oil to Hamper Fluid End Assembly Market
Technological Advancements in Fluid End Assembly to Offer Opportunities
Recent Developments, Expansions, Acquisitions, and New Contracts
North America to Lead Fluid End Assembly Market
Highly Competitive Fluid End Assembly Market
Fluid End Assembly Market is projected to reach US$ 14 Bn by the end of 2027
Fluid End Assembly Market is expected to grow at a CAGR of 4% during 2019 - 2027
Increase in number of EOR projects is expected to drive the fluid end assembly market during the forecast period
North America is a more attractive region for vendors in the Fluid End Assembly Market
Key vendors in the Fluid End Assembly Market are Halliburton, The Weir Group PLC, Forum Energy Technologies,, etc
1. Preface
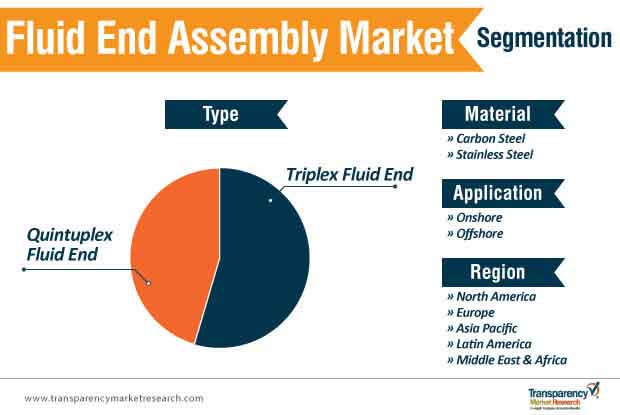
1.1. Report Scope and Market Segmentation
1.2. Research Highlights
2. Assumptions and Research Methodology
2.1. Report Assumptions
2.2. Secondary Sources and Acronyms Used
2.3. Research Methodology
3. Executive Summary
3.1. Market Snapshot
3.2. Top Trends
4. Market Overview
4.1. Introduction
4.2. Market Indicators
4.3. Drivers and Restraints Snapshot Analysis
4.3.1. Drivers
4.3.2. Restraints
4.3.3. Opportunities
4.4. Porter's Five Forces Analysis
4.4.1. Threat of Substitutes
4.4.2. Bargaining Power of Buyers
4.4.3. Bargaining Power of Suppliers
4.4.4. Threat of New Entrants
4.4.5. Degree of Competition
4.5. Value Chain Analysis
4.5.1. List of Key Customers
4.6. Regulatory Scenario
5. Global Fluid End Assembly Market Value (US$ Mn) Analysis, by Type
5.1. Key Findings and Introduction
5.2. Fluid End Assembly Market Value (US$ Mn) Forecast, by Type, 2018–2027
5.2.1. Fluid End Assembly Market Value (US$ Mn) Forecast, by Triplex Fluid End, 2018–2027
5.2.2. Fluid End Assembly Market Value (US$ Mn) Forecast, by Quintuplex Fluid End, 2018–2027
5.3. Fluid End Assembly Market Attractiveness Analysis, by Type
6. Global Fluid End Assembly Market Analysis, by Material
6.1. Key Findings and Introduction
6.2. Fluid End Assembly Market Value (US$ Mn) Analysis & Forecast, by Material, 2018–2027
6.2.1. Fluid End Assembly Market Value (US$ Mn) Forecast, by Carbon Steel, 2018–2027
6.2.2. Fluid End Assembly Market Value (US$ Mn) Forecast, by Stainless Steel, 2018–2027
6.3. Fluid End Assembly Market Attractiveness Analysis, by Material
7. Global Fluid End Assembly Market Analysis, by Application
7.1. Key Findings and Introduction
7.2. Fluid End Assembly Market Value (US$ Mn) Analysis & Forecast, by Application, 2018–2027
7.2.1. Fluid End Assembly Market Value (US$ Mn) Forecast, by Onshore, 2018–2027
7.2.2. Fluid End Assembly Market Value (US$ Mn) Forecast, by Offshore, 2018–2027
7.3. Fluid End Assembly Market Attractiveness Analysis, by Application
8. Global Fluid End Assembly Market Analysis, by Region, 2018–2027
8.1. Key Findings
8.2. Fluid End Assembly Market Value (US$ Mn) Analysis & Forecast, by Region, 2018–2027
8.2.1. North America
8.2.2. Europe
8.2.3. Asia Pacific
8.2.4. Latin America
8.2.5. Middle East & Africa
8.3. Fluid End Assembly Market Attractiveness Analysis, by Region
9. North America Fluid End Assembly Market Analysis, 2018–2027
9.1. Key Findings
9.2. North America Fluid End Assembly Market Value (US$ Mn) Analysis & Forecast, by Type, 2018–2027
9.3. North America Fluid End Assembly Market Value (US$ Mn) Analysis & Forecast, by Material, 2018–2027
9.4. North America Fluid End Assembly Market Value (US$ Mn) Analysis & Forecast, by Application, 2018–2027
9.5. North America Fluid End Assembly Market Value (US$ Mn) Analysis & Forecast, by Country, 2018–2027
9.5.1. U.S. Fluid End Assembly Market Value (US$ Mn) Forecast, by Type, 2018–2027
9.5.2. U.S. Fluid End Assembly Market Value (US$ Mn) Forecast, by Material, 2018–2027
9.5.3. U.S. Fluid End Assembly Market Value (US$ Mn) Forecast, by Application, 2018–2027
9.5.4. Canada Fluid End Assembly Market Value (US$ Mn) Forecast, by Type, 2018–2027
9.5.5. Canada Fluid End Assembly Market Value (US$ Mn) Forecast, by Material, 2018–2027
9.5.6. Canada Fluid End Assembly Market Value (US$ Mn) Forecast, by Application, 2018–2027
9.6. North America Fluid End Assembly Market Attractiveness Analysis, by Type
9.7. North America Fluid End Assembly Market Attractiveness Analysis, by Material
9.8. North America Fluid End Assembly Market Attractiveness Analysis, by Application
9.9. North America Fluid End Assembly Market Attractiveness Analysis, by Country
10. Europe Fluid End Assembly Market Analysis, 2018–2027
10.1. Key Findings
10.2. Europe Fluid End Assembly Market Value (US$ Mn) Analysis & Forecast, by Type, 2018–2027
10.3. Europe Fluid End Assembly Market Value (US$ Mn) Analysis & Forecast, by Material, 2018–2027
10.4. Europe Fluid End Assembly Market Value (US$ Mn) Analysis & Forecast, by Application, 2018–2027
10.5. Europe Fluid End Assembly Market Value (US$ Mn) Analysis & Forecast, by Country and Sub-region, 2018–2027
10.5.1. U.K. Fluid End Assembly Market Value (US$ Mn) Forecast, by Type, 2018–2027
10.5.2. U.K. Fluid End Assembly Market Value (US$ Mn) Forecast, by Material, 2018–2027
10.5.3. U.K. Fluid End Assembly Market Value (US$ Mn) Forecast, by Application, 2018–2027
10.5.4. Norway Fluid End Assembly Market Value (US$ Mn) Forecast, by Type, 2018–2027
10.5.5. Norway Fluid End Assembly Market Value (US$ Mn) Forecast, by Material, 2018–2027
10.5.6. Norway Fluid End Assembly Market Value (US$ Mn) Forecast, by Application, 2018–2027
10.5.7. Russia & CIS Fluid End Assembly Market Value (US$ Mn) Forecast, by Type, 2018–2027
10.5.8. Russia & CIS Fluid End Assembly Market Value (US$ Mn) Forecast, by Material, 2018–2027
10.5.9. Russia & CIS Fluid End Assembly Market Value (US$ Mn) Forecast, by Application, 2018–2027
10.5.10. Rest of Europe Fluid End Assembly Market Value (US$ Mn) Forecast, by Type, 2018–2027
10.5.11. Rest of Europe Fluid End Assembly Market Value (US$ Mn) Forecast, by Material, 2018–2027
10.5.12. Rest of Europe Fluid End Assembly Market Value (US$ Mn) Forecast, by Application, 2018–2027
10.6. Europe Fluid End Assembly Market Attractiveness Analysis, by Type
10.7. Europe Fluid End Assembly Market Attractiveness Analysis, by Material
10.8. Europe Fluid End Assembly Market Attractiveness Analysis, by Application
10.9. Europe Fluid End Assembly Market Attractiveness Analysis, by Country and Sub-region
11. Asia Pacific Fluid End Assembly Market Analysis, 2018–2027
11.1. Key Findings
11.2. Asia Pacific Fluid End Assembly Market Value (US$ Mn) Analysis & Forecast, by Type, 2018–2027
11.3. Asia Pacific Fluid End Assembly Market Value (US$ Mn) Analysis & Forecast, by Material, 2018–2027
11.4. Asia Pacific Fluid End Assembly Market Value (US$ Mn) Analysis & Forecast, by Application, 2018–2027
11.5. Asia Pacific Fluid End Assembly Market Value (US$ Mn) Analysis & Forecast, by Country and Sub-region, 2018–2027
11.5.1. China Fluid End Assembly Market Value (US$ Mn) Forecast, by Type, 2018–2027
11.5.2. China Fluid End Assembly Market Value (US$ Mn) Forecast, by Material, 2018–2027
11.5.3. China Fluid End Assembly Market Value (US$ Mn) Forecast, by Application, 2018–2027
11.5.4. Australia Fluid End Assembly Market Value (US$ Mn) Forecast, by Type, 2018–2027
11.5.5. Australia Fluid End Assembly Market Value (US$ Mn) Forecast, by Material, 2018–2027
11.5.6. Australia Fluid End Assembly Market Value (US$ Mn) Forecast, by Application, 2018–2027
11.5.7. India Fluid End Assembly Market Value (US$ Mn) Forecast, by Type, 2018–2027
11.5.8. India Fluid End Assembly Market Value (US$ Mn) Forecast, by Material, 2018–2027
11.5.9. India Fluid End Assembly Market Value (US$ Mn) Forecast, by Application, 2018–2027
11.5.10. Indonesia Fluid End Assembly Market Value (US$ Mn) Forecast, by Type, 2018–2027
11.5.11. Indonesia Fluid End Assembly Market Value (US$ Mn) Forecast, by Material, 2018–2027
11.5.12. Indonesia Fluid End Assembly Market Value (US$ Mn) Forecast, by Application, 2018–2027
11.5.13. Thailand Fluid End Assembly Market Value (US$ Mn) Forecast, by Type, 2018–2027
11.5.14. Thailand Fluid End Assembly Market Value (US$ Mn) Forecast, by Material, 2018–2027
11.5.15. Thailand Fluid End Assembly Market Value (US$ Mn) Forecast, by Application, 2018–2027
11.5.16. Rest of Asia Pacific Fluid End Assembly Market Value (US$ Mn) Forecast, by Type, 2018–2027
11.5.17. Rest of Asia Pacific Fluid End Assembly Market Value (US$ Mn) Forecast, by Material, 2018–2027
11.5.18. Rest of Asia Pacific Fluid End Assembly Market Value (US$ Mn) Forecast, by Application, 2018–2027
11.6. Asia Pacific Fluid End Assembly Market Attractiveness Analysis, by Type
11.7. Asia Pacific Fluid End Assembly Market Attractiveness Analysis, by Material
11.8. Asia Pacific Fluid End Assembly Market Attractiveness Analysis, by Application
11.9. Asia Pacific Fluid End Assembly Market Attractiveness Analysis, by Country and Sub-region
12. Latin America Fluid End Assembly Market Analysis, 2018–2027
12.1. Key Findings
12.2. Latin America Fluid End Assembly Market Value (US$ Mn) Analysis & Forecast, by Type, 2018–2027
12.3. Latin America Fluid End Assembly Market Value (US$ Mn) Analysis & Forecast, by Material, 2018–2027
12.4. Latin America Fluid End Assembly Market Value (US$ Mn) Analysis & Forecast, by Application, 2018–2027
12.5. Latin America Fluid End Assembly Market Value (US$ Mn) Analysis & Forecast, by Country and Sub-region, 2018–2027
12.5.1. Brazil Fluid End Assembly Market Value (US$ Mn) Forecast, by Type, 2018–2027
12.5.2. Brazil Fluid End Assembly Market Value (US$ Mn) Forecast, by Material, 2018–2027
12.5.3. Brazil Fluid End Assembly Market Value (US$ Mn) Forecast, by Application, 2018–2027
12.5.4. Mexico Fluid End Assembly Market Value (US$ Mn) Forecast, by Type, 2018–2027
12.5.5. Mexico Fluid End Assembly Market Value (US$ Mn) Forecast, by Material, 2018–2027
12.5.6. Mexico Fluid End Assembly Market Value (US$ Mn) Forecast, by Application, 2018–2027
12.5.7. Venezuela Fluid End Assembly Market Value (US$ Mn) Forecast, by Type, 2018–2027
12.5.8. Venezuela Fluid End Assembly Market Value (US$ Mn) Forecast, by Material, 2018–2027
12.5.9. Venezuela Fluid End Assembly Market Value (US$ Mn) Forecast, by Application, 2018–2027
12.5.10. Rest of Latin America Fluid End Assembly Market Value (US$ Mn) Forecast, by Material, 2018–2027
12.5.11. Rest of Latin America Fluid End Assembly Market Value (US$ Mn) Forecast, by Application, 2018–2027
12.6. Latin America Fluid End Assembly Market Attractiveness Analysis, by Type
12.7. Latin America Fluid End Assembly Market Attractiveness Analysis, by Material
12.8. Latin America Fluid End Assembly Market Attractiveness Analysis, by Application
12.9. Latin America Fluid End Assembly Market Attractiveness Analysis, by Country and Sub-region
13. Middle East & Africa Fluid End Assembly Market Analysis, 2018–2027
13.1. Key Findings
13.2. Middle East & Africa Fluid End Assembly Market Value (US$ Mn) Analysis & Forecast, by Type, 2018–2027
13.3. Middle East & Africa Fluid End Assembly Market Value (US$ Mn) Analysis & Forecast, by Material, 2018–2027
13.4. Middle East & Africa Fluid End Assembly Market Value (US$ Mn) Analysis & Forecast, by Application, 2018–2027
13.5. Middle East & Africa Fluid End Assembly Market Value (US$ Mn) Analysis & Forecast, by Country and Sub-region, 2018–2027
13.5.1. Saudi Arabia Fluid End Assembly Market Value (US$ Mn) Forecast, by Type, 2018–2027
13.5.2. Saudi Arabia Fluid End Assembly Market Value (US$ Mn) Forecast, by Material, 2018–2027
13.5.3. Saudi Arabia Fluid End Assembly Market Value (US$ Mn) Forecast, by Application, 2018–2027
13.5.4. UAE Fluid End Assembly Market Value (US$ Mn) Forecast, by Type, 2018–2027
13.5.5. UAE Fluid End Assembly Market Value (US$ Mn) Forecast, by Material, 2018–2027
13.5.6. UAE Fluid End Assembly Market Value (US$ Mn) Forecast, by Application, 2018–2027
13.5.7. UAE Fluid End Assembly Market Value (US$ Mn) Forecast, by Type, 2018–2027
13.5.8. UAE Fluid End Assembly Market Value (US$ Mn) Forecast, by Material, 2018–2027
13.5.9. UAE Fluid End Assembly Market Value (US$ Mn) Forecast, by Application, 2018–2027
13.5.10. Qatar Fluid End Assembly Market Value (US$ Mn) Forecast, by Type, 2018–2027
13.5.11. Qatar Fluid End Assembly Market Value (US$ Mn) Forecast, by Material, 2018–2027
13.5.12. Qatar Fluid End Assembly Market Value (US$ Mn) Forecast, by Application, 2018–2027
13.5.13. Oman Fluid End Assembly Market Value (US$ Mn) Forecast, by Type, 2018–2027
13.5.14. Oman Fluid End Assembly Market Value (US$ Mn) Forecast, by Material, 2018–2027
13.5.15. Oman Fluid End Assembly Market Value (US$ Mn) Forecast, by Application, 2018–2027
13.5.16. Nigeria Fluid End Assembly Market Value (US$ Mn) Forecast, by Type, 2018–2027
13.5.17. Nigeria Fluid End Assembly Market Value (US$ Mn) Forecast, by Material, 2018–2027
13.5.18. Nigeria Fluid End Assembly Market Value (US$ Mn) Forecast, by Application, 2018–2027
13.5.19. Rest of Middle East & Africa Fluid End Assembly Market Value (US$ Mn) Forecast, by Type, 2018–2027
13.5.20. Rest of Middle East & Africa Fluid End Assembly Market Value (US$ Mn) Forecast, by Material, 2018–2027
13.5.21. Rest of Middle East & Africa Fluid End Assembly Market Value (US$ Mn) Forecast, by Application, 2018–2027
13.6. Middle East & Africa Fluid End Assembly Market Attractiveness Analysis, by Type
13.7. Middle East & Africa Fluid End Assembly Market Attractiveness Analysis, by Material
13.8. Middle East & Africa Fluid End Assembly Market Attractiveness Analysis, by Application
13.9. Middle East & Africa Fluid End Assembly Market Attractiveness Analysis, by Country and Sub-region
14. Competition Landscape
14.1. Fluid End Assembly Market Share Analysis, by Company (2018)
14.2. Competition Matrix
14.2.1. The Weir Group PLC
14.2.2. Gardner Denver, Inc.
14.3. Company Profiles
14.3.1. Halliburton
14.3.1.1. Company Details
14.3.1.2. Company Description
14.3.1.3. Business Overview
14.3.1.4. Financial Overview
14.3.1.5. Strategic Overview
14.3.2. The Weir Group PLC.
14.3.2.1. Company Details
14.3.2.2. Company Description
14.3.2.3. Business Overview
14.3.2.4. Financial Overview
14.3.2.5. Strategic Overview
14.3.3. Shandong Saigao Group Corporation
14.3.3.1. Company Details
14.3.3.2. Company Description
14.3.3.3. Business Overview
14.3.4. Fluid End Pump Parts
14.3.4.1. Company Details
14.3.4.2. Company Description
14.3.4.3. Business Overview
14.3.5. SERVA Group
14.3.5.1. Company Details
14.3.5.2. Company Description
14.3.5.3. Business Overview
14.3.6. Forum Energy Technologies
14.3.6.1. Company Details
14.3.6.2. Company Description
14.3.6.3. Business Overview
14.3.6.4. Financial Overview
14.3.6.5. Strategic Overview
14.3.7. Piper Oilfield Products
14.3.7.1. Company Details
14.3.7.2. Company Description
14.3.7.3. Business Overview
14.3.8. Utex Industries, Inc
14.3.8.1. Company Details
14.3.8.2. Company Description
14.3.8.3. Business Overview
14.3.8.4. Strategic Overview
14.3.9. Jereh Group
14.3.9.1. Company Details
14.3.9.2. Company Description
14.3.9.3. Business Overview
14.3.9.4. Financial Overview
14.3.9.5. Strategic Overview
14.3.10. Alco Group
14.3.10.1. Company Details
14.3.10.2. Company Description
14.3.10.3. Business Overview
14.3.11. Gardner Denver, Inc.
14.3.11.1. Company Details
14.3.11.2. Company Description
14.3.11.3. Business Overview
14.3.11.4. Financial Overview
14.3.11.5. Strategic Overview
14.3.12. Haimo Technologies Group Corp.
14.3.12.1. Company Details
14.3.12.2. Company Description
14.3.12.3. Business Overview
14.3.12.4. Strategic Overview
14.3.13. CB HYMAC
14.3.13.1. Company Details
14.3.13.2. Company Description
14.3.13.3. Business Overview
15. Primary Research – Key Insights
List of Tables
Table 01: Global Fluid End Assembly Market Value (US$) Forecast, by Type, 2018–2027
Table 02: Global Fluid End Assembly Market Value (US$ Mn) Forecast, by Material, 2018–2027
Table 03: Global Fluid End Assembly Market Value (US$ Mn) Forecast, by Application, 2018–2027
Table 04: Global Fluid End Assembly Market Value (US$ Mn) Forecast, by Region, 2018–2027
Table 05: North America Fluid End Assembly Market Value (US$ Mn) Forecast, by Type, 2018-2027
Table 06: North America Fluid End Assembly Market Value (US$ Mn) Forecast, by Material, 2018-2027
Table 07: North America Fluid End Assembly Market Value (US$ Mn) Forecast, by Application, 2018-2027
Table 08: North America Fluid End Assembly Market Value (US$ Mn) Forecast, by Country, 2018-2027
Table 09: U.S. Fluid End Assembly Market Value (US$ Mn) Forecast, by Type, 2018-2027
Table 10: U.S. Fluid End Assembly Market Value (US$ Mn) Forecast, by Material, 2018-2027
Table 11: U.S. Fluid End Assembly Market Value (US$ Mn) Forecast, by Application, 2018-2027
Table 12: Canada Fluid End Assembly Market Value (US$ Mn) Forecast, by Type, 2018-2027
Table 13: Canada Fluid End Assembly Market Value (US$ Mn) Forecast, by Material, 2018-2027
Table 14: Canada Fluid End Assembly Market Value (US$ Mn) Forecast, by Application, 2018-2027
Table 15: Europe Fluid End Assembly Market Value (US$ Mn) Forecast, by Type, 2018–2027
Table 16: Europe Fluid End Assembly Market Value (US$ Mn) Forecast, by Material, 2018–2027
Table 17: Europe Fluid End Assembly Market Value (US$ Mn) Forecast, by Application, 2018–2027
Table 18: Europe Fluid End Assembly Market Value (US$ Mn) Forecast, by Country and Sub-region, 2018–2027
Table 19: U.K. Fluid End Assembly Market Value (US$ Mn) Forecast, by Type, 2018–2027
Table 20: U.K. Fluid End Assembly Market Value (US$ Mn) Forecast, by Material, 2018–2027
Table 21: U.K. Fluid End Assembly Market Value (US$ Mn) Forecast, by Application, 2018–2027
Table 22: Norway Fluid End Assembly Market Value (US$ Mn) Forecast, by Type, 2018–2027
Table 23: Norway Fluid End Assembly Market Value (US$ Mn) Forecast, by Material, 2018–2027
Table 24: Norway Fluid End Assembly Market Value (US$ Mn) Forecast, by Application, 2018–2027
Table 25: Russia & CIS Fluid End Assembly Market Value (US$ Mn) Forecast, by Type, 2018–2027
Table 26: Russia & CIS Fluid End Assembly Market Value (US$ Mn) Forecast, by Material, 2018–2027
Table 27: Russia & CIS Fluid End Assembly Market Value (US$ Mn) Forecast, by Application, 2018–2027
Table 28: Rest of Europe Fluid End Assembly Market Value (US$ Mn) Forecast, by Type, 2018–2027
Table 29: Rest of Europe Fluid End Assembly Market Value (US$ Mn) Forecast, by Material, 2018–2027
Table 30: Rest of Europe End Assembly Market Value (US$ Mn) Forecast, by Application, 2018–2027
Table 31: Asia Pacific Fluid End Assembly Market Value (US$ Mn) Forecast, by Type, 2018–2027
Table 32: Asia Pacific Fluid End Assembly Market Value (US$ Mn) Forecast, by Material, 2018–2027
Table 33: Asia Pacific End Assembly Market Value (US$ Mn) Forecast, by Application, 2018–2027
Table 34: Asia Pacific Fluid End Assembly Market Value (US$ Mn) Forecast, by Country and Sub-region, 2018–2027
Table 35: China Fluid End Assembly Market Value (US$ Mn) Forecast, by Type, 2018–2027
Table 36: China Fluid End Assembly Market Value (US$ Mn) Forecast, by Material, 2018–2027
Table 37: China Fluid End Assembly Market Value (US$ Mn) Forecast, by Application, 2018–2027
Table 38: Australia Fluid End Assembly Market Value (US$ Mn) Forecast, by Type, 2018–2027
Table 39: Australia Fluid End Assembly Market Value (US$ Mn) Forecast, by Material, 2018–2027
Table 40: Australia End Assembly Market Value (US$ Mn) Forecast, by Application, 2018–2027
Table 41: India Fluid End Assembly Market Value (US$ Mn) Forecast, by Type, 2018–2027
Table 42: India Fluid End Assembly Market Value (US$ Mn) Forecast, by Material, 2018–2027
Table 43: India End Assembly Market Value (US$ Mn) Forecast, by Application, 2018–2027
Table 44: Indonesia Fluid End Assembly Market Value (US$ Mn) Forecast, by Type, 2018–2027
Table 45: Indonesia Fluid End Assembly Market Value (US$ Mn) Forecast, by Material, 2018–2027
Table 46: Indonesia End Assembly Market Value (US$ Mn) Forecast, by Application, 2018–2027
Table 47: Thailand Fluid End Assembly Market Value (US$ Mn) Forecast, by Type, 2018–2027
Table 48: Thailand Fluid End Assembly Market Value (US$ Mn) Forecast, by Material, 2018–2027
Table 49: Thailand End Assembly Market Value (US$ Mn) Forecast, by Application, 2018–2027
Table 50: Rest of Asia-Pacific Fluid End Assembly Market Value (US$ Mn) Forecast, by Type, 2018–2027
Table 51: Rest of Asia-Pacific Fluid End Assembly Market Value (US$ Mn) Forecast, by Material, 2018–2027
Table 56: Rest of Asia-Pacific Fluid End Assembly Market Value (US$ Mn) Forecast, by Application, 2018–2027
Table 57: Middle East & Africa Fluid End Assembly Market Value (US$ Mn) Forecast, by Type, 2018–2027
Table 58: Middle East & Africa Fluid End Assembly Market Value (US$ Mn) Forecast, by Material, 2018–2027
Table 59: Middle East & Africa Fluid End Assembly Market Value (US$ Mn) Forecast, by Application, 2018–2027
Table 60: Middle East & Africa Fluid End Assembly Market Value (US$ Mn) Forecast, by Country and Sub-region, 2018-2027
Table 61: Saudi Arabia Fluid End Assembly Market Value (US$ Mn) Forecast, by Type, 2018–2027
Table 62: Saudi Arabia Fluid End Assembly Market Value (US$ Mn) Forecast, by Material, 2018–2027
Table 63: Saudi Arabia Fluid End Assembly Market Value (US$ Mn) Forecast, by Application, 2018–2027
Table 64: UAE Fluid End Assembly Market Value (US$ Mn) Forecast, by Type, 2018–2027
Table 65: UAE Fluid End Assembly Market Value (US$ Mn) Forecast, by Material, 2018–2027
Table 66: UAE Fluid End Assembly Market Value (US$ Mn) Forecast, by Application, 2018–2027
Table 67: Qatar Fluid End Assembly Market Value (US$ Mn) Forecast, by Type, 2018–2027
Table 68: Qatar Fluid End Assembly Market Value (US$ Mn) Forecast, by Material, 2018–2027
Table 69: Qatar Fluid End Assembly Market Value (US$ Mn) Forecast, by Application, 2018–2027
Table 70: Oman Fluid End Assembly Market Value (US$ Mn) Forecast, by Type, 2018–2027
Table 71: Oman Fluid End Assembly Market Value (US$ Mn) Forecast, by Material, 2018–2027
Table 72: Oman Fluid End Assembly Market Value (US$ Mn) Forecast, by Application, 2018–2027
Table 73: Nigeria Fluid End Assembly Market Value (US$ Mn) Forecast, by Type, 2018–2027
Table 74: Nigeria Fluid End Assembly Market Value (US$ Mn) Forecast, by Material, 2018–2027
Table 75: Nigeria Fluid End Assembly Market Value (US$ Mn) Forecast, by Application, 2018–2027
Table 76: Rest of Middle East & Africa Fluid End Assembly Market Value (US$ Mn) Forecast, by Type, 2018–2027
Table 77: Rest of Middle East & Africa Fluid End Assembly Market Value (US$ Mn) Forecast, by Material, 2018–2027
Table 78: Rest of Middle East & Africa Fluid End Assembly Market Value (US$ Mn) Forecast, by Application, 2018–2027
Table 79: Latin America Fluid End Assembly Market Value (US$ Mn) Forecast, by Type, 2018–2027
Table 80: Latin America Fluid End Assembly Market Value (US$ Mn) Forecast, by Material, 2018–2027
Table 81: Latin America Fluid End Assembly Market Value (US$ Mn) Forecast, by Application, 2018–2027
Table 82: Latin America Fluid End Assembly Market Value (US$ Mn) Forecast, by Country and Sub-region, 2018–2027
Table 83: Brazil Fluid End Assembly Market Value (US$ Mn) Forecast, by Type, 2018–2027
Table 84: Brazil Fluid End Assembly Market Value (US$ Mn) Forecast, by Material, 2018–2027
Table 85: Brazil Fluid End Assembly Market Value (US$ Mn) Forecast, by Application, 2018–2027
Table 86: Mexico Fluid End Assembly Market Value (US$ Mn) Forecast, by Type, 2018–2027
Table 87: Mexico Fluid End Assembly Market Value (US$ Mn) Forecast, by Material, 2018–2027
Table 88: Mexico Fluid End Assembly Market Value (US$ Mn) Forecast, by Application, 2018–2027
Table 90: Venezuela Fluid End Assembly Market Value (US$ Mn) Forecast, by Type, 2018–2027
Table 91: Venezuela Fluid End Assembly Market Value (US$ Mn) Forecast, by Material, 2018–2027
Table 92: Venezuela Fluid End Assembly Market Value (US$ Mn) Forecast, by Application, 2018–2027
Table 93: Rest of Latin America Fluid End Assembly Market Value (US$ Mn) Forecast, by Type, 2018–2027
Table 94: Latin America Fluid End Assembly Market Value (US$ Mn) Forecast, by Material, 2018–2027
Table 95: Latin America Fluid End Assembly Market Value (US$ Mn) Forecast, by Application, 2018–2027
List of Figures
Figure 01: Global Fluid End Assembly Market Value Share Analysis, by Type, 2018 and 2027
Figure02: Global Fluid End Assembly Market Attractiveness Analysis, by Type
Figure 03: Global Fluid End Assembly Market Attractiveness Analysis, by Type
Figure 04: Global Fluid End Assembly Market Value Share Analysis, by Material, 2018 and 2027
Figure 05: Global Fluid End Assembly Market Attractiveness Analysis, by Material, 2019—2027
Figure 06: Global Fluid End Assembly Market Value Share Analysis, by Application, 2018 and 2027
Figure 07: Global Fluid End Assembly Market Attractiveness, by Application, 2019--2027
Figure 08: Global Fluid End Assembly Market Value Share, by Region, 2018 and 2027
Figure 09: Global Fluid End Assembly Market Attractiveness, by Region, 2019—2027
Figure 10: North America Fluid End Assembly Market Value Share Analysis, by Type, 2018 and 2027
Figure 11: North America Fluid End Assembly Market Value Share Analysis, by Material, 2018 and 2027
Figure 12: North America Fluid End Assembly Market Value Share Analysis, by Application, 2018 and 2027
Figure 13: North America Fluid End Assembly Market Value Share Analysis, by Country, 2018 and 2027
Figure 14: North America Fluid End Assembly Market Attractiveness Analysis, by Type, 2019—2027
Figure 15: North America Fluid End Assembly Market Attractiveness Analysis, by Material, 2019—2027
Figure 16: North America Fluid End Assembly Market Attractiveness Analysis, by Application, 2019—2027
Figure 17: North America Fluid End Assembly Attractiveness Analysis, by Region, 2019—2027
Figure 18: Europe Fluid End Assembly Market Value Share Analysis, by Type, 2018 and 2027
Figure 19: Europe Fluid End Assembly Market Value Share Analysis, by Material, 2018 and 2027
Figure 20: Europe Fluid End Assembly Market Value Share Analysis, by Application, 2018 and 2027
Figure 21: Europe Fluid End Assembly Market Value Share Analysis, by Country and Sub-region, 2018 and 2027
Figure 22: Europe Fluid End Assembly Market Attractiveness Analysis, by Type, 2019–2027
Figure 23: Europe Fluid End Assembly Market Attractiveness Analysis, by Material, 2019–2027
Figure 24: Europe Fluid End Assembly Market Attractiveness Analysis, by Application, 2019–2027
Figure 25: Europe Fluid End Assembly Market Attractiveness Analysis, by Country and Sub-region, 2019–2027
Figure 26: Asia Pacific Fluid End Assembly Market Value Share Analysis, by Type, 2018 and 2027
Figure 27: Asia Pacific Fluid End Assembly Market Value Share Analysis, by Material, 2018 and 2027
Figure 28: Asia Pacific Fluid End Assembly Market Value Share Analysis, by Application 2018 and 2027
Figure 29: Asia Pacific Fluid End Assembly Market Value Share Analysis, by Country and Sub-region, 2018 and 2027
Figure 30: Asia Pacific Fluid End Assembly Market Attractiveness Analysis, by Type, 2019–2027
Figure 31: Asia Pacific Fluid End Assembly Market Attractiveness Analysis, by Material, 2019–2027
Figure 32: Asia Pacific Fluid End Assembly Market Attractiveness Analysis, by Application, 2019–2027
Figure 33: Asia Pacific Fluid End Assembly Market Attractiveness Analysis, by Source, 2019–2027
Figure 34: Middle East & Africa Fluid End Assembly Market Value Share Analysis, by Type, 2018 and 2027
Figure 35: Middle East & Africa Fluid End Assembly Market Value Share Analysis, by Material, 2018 and 2027
Figure 36: Middle East & Africa Fluid End Assembly Market Value Share Analysis, by Application, 2018 and 2027
Figure 37: Middle East & Africa Fluid End Assembly Market Value Share Analysis, by Country and Sub-region, 2018 and 2027
Figure 38: Middle East & Africa Fluid End Assembly Market Attractiveness Analysis, by Type, 2019—2027
Figure 39: Middle East & Africa Fluid End Assembly Market Attractiveness Analysis, by Material, 2019—2027
Figure 40: Middle East & Africa Fluid End Assembly Market Attractiveness Analysis, by Application, 2019—2027
Figure 41: Middle East & Africa Fluid End Assembly Market Attractiveness Analysis, by Region, 2019—2027
Figure 42: Latin America Fluid End Assembly Market Value Share Analysis, by Type, 2018 and 2027
Figure 43: Latin America Fluid End Assembly Market Value Share Analysis, by Material, 2018 and 2027
Figure 44: Latin America Fluid End Assembly Market Value Share Analysis, by Application, 2018 and 2027
Figure 45: Latin America Fluid End Assembly Market Value Share Analysis, by Country and Sub-region, 2018 and 2027
Figure 46: Latin America Fluid End Assembly Market Attractiveness Analysis, by Type, 2019–2027
Figure 47: Latin America Fluid End Assembly Market Attractiveness Analysis, by Material, 2019–2027
Figure 48: Latin America Fluid End Assembly Market Attractiveness Analysis, by Application, 2019–2027
Figure 49: Latin America Fluid End Assembly Market Attractiveness Analysis, by Country and Sub-region, 2019–2027
Figure 50: Global Fluid End Assembly Market Share Analysis, by Company (2018)
Copyright © Transparency Market Research, Inc. All Rights reserved
Trust Online

Fluid End Assembly Market