
Reports
Reports
Analysts’ Viewpoint on Fluid Coupling Market Scenario
The global fluid coupling market is anticipated to expand at a significant CAGR during the forecast period due to increasing usage of centrifuges & reciprocating pumps, mixers & agitators, crushers & grinding mills, and mills, among others in several industrial areas. Moreover, rapid growth of the overall industrial sector, especially mining, food & beverages, construction, pharmacy, and power, among others, is expected to generate demand for fluid coupling. End users across the globe are generally procuring fluid coupling through various online and offline sales platforms. On the other hand, key users opting for customized fluid coupling of specific size, design, and material are likely to generate demand through direct sales. However, change in government policies and rise in geo-political tension affect the supply chain cycle and increase trade barriers. The high cost of technology and R&D is a key challenge for fluid coupling manufacturers across the global market. The presence of alternative options in several industrial sectors to perform light duty applications such as clutches, gear, and other coupling mats is also projected to pose a risk to the growth of the fluid coupling market.
Fluid couplings are heavy industrial devices. A growing trend in the global fluid coupling market is the rising demand for smaller-capacity fluid couplings. Fluid coupling is a device that allows a controlled amount of slip between input and output, between drive and drive, without the touch of a machine. As a result, fluid couplings offer engineers several benefits in many different types of power transfers. These advantages include control start, slower acceleration, overload protection, power saving, precision speed control, seamless grip, torsional isolation (important between a diesel engine and its load), and long-lasting reliability of the drive without mechanical contact between the transmission elements.
The fluid coupling is also known as a hydraulic coupling which is a hydrodynamic device used to transfer circulating energy from one shaft to another using transmission fluid. In the U.S., utilities are allowed to purchase energy from NUGs (Non-utility Generators). This enables NUGs to receive a reasonable to excellent price for the energy they produce and ensures that energy generated by small producers will not be wasted.
Another trend seen in the global fluid coupling market is the improvement in coupling technology. Manufacturing companies are also working closely with international OEMs, mine owners, and equipment operators to manufacture systems that meet industry needs and standards.
Although fluid couplings require periodic servicing, they are less replaceable in the short term. Additionally, the price of variable-speed fluid couplings is comparatively higher than constant-fill or constant speed fluid couplings. These factors are restraining the growth of the global fluid coupling market.
Fluid couplings have widespread usage in various industrial applications in railways, power transmission, marine, automotive, aviation, and cement industry. Demand for fluid coupling is increasing with the growth of these industries. Growing investment in renewable energy sources as compared to fossil fuels in many countries due to changing climate and renewable policies, increasing power market reforms, and initiatives taken by many corporations to procure clean energy is encouraging the growth of the renewable energy sector, which is leading to increase in demand for power transmission equipment that consists of components such as fluid coupling.
For instance, 48 countries of the Climate Vulnerable Forum pledged to achieve 100% domestic renewable energy production by 2050 at the COP22 in Marrakech, Morocco. This is expected to drive the fluid coupling market in the upcoming years.
In addition, end-use industries such as construction, food & beverages, pharmaceuticals, oil & gas, mining, and paper & pulp are continuously expanding. Fluid coupling plays a crucial role in equipment such as cranes, crushers, milling, centrifuges, mixers, and agitators, eventually leading to the growth of the market globally. Emerging countries such as India, China, and Brazil are continuously investing in several mega projects; for instance, China has invested in construction of three huge canals which are more than 600 miles in length to carry water to the north from China’s three largest rivers. This project has a 48-year construction schedule which may gain demand for a broad range of construction as well as power transmission equipment and is likely to generate demand for fluid couplings in the near future.
Fluid couplings are widely used in the automotive sector in semi-automatic or fully automatic transmission systems. In automotive systems, the pump is usually connected to the engine flywheel. The enclosure may be part of the proper flywheel and thus be turned into the engine crankshaft. The turbine is connected to the transmission shaft. While the transmission is in gear, as the engine speed increases, the torque is transferred from the engine to the input shaft by liquid movement, which propels the motor. In this regard, the fluid coupling behavior is very similar to that of a mechanical clutch that drives a manual transmission. These applications are propelling the demand for fluid couplings in the global market.
Fluid couplings are used in belt conveyors, extruders, centrifuges, bucket elevators, ball mills, crushers, mixers, slurry pumps, compressors, industrial fans, feeders, diesel locomotives, wagon tipplers, boiler feed pumps, reciprocating pumps, process pumps, dryers etc. It possesses certain advantages. For instance, in conveyor belts, fluid couplings are used to gently accelerate belt drives. Fluid couplings limit torque, provide load sharing upon start-up, and dampen torsional vibrations, increasing a conveyor system’s productivity and longevity. Moreover, in fluid coupling, the power transmission is free from vibration & noise, and also power transmission is smooth in extreme conditions such as heat, pressure, and force. The maximum torque can be adjusted by varying the amount of oil filled in the casing.
Furthermore, recent innovations and product developments as per the requirement of users may drive the growth of the global fluid coupling market.
Fluid couplings are usually used for high-power transmission and made of steel or aluminum. In addition, the use of sensors in the fluid coupling has enabled manufacturers to detect abnormality in any fluid coupling and send signals to activate other devices, such as other safety couplings, torque limiters, and powertrain-connected devices. It is used in the automotive transfer system, the maritime system, and the power transmission industry and is also used as an alternative to the mechanical clutch.
The need for fossil fuels is growing as the number of power stations built for Independent Power Producers (IPP) grows. Services in the U.S. are allowed to receive electricity from NUGs (Non-utility Generators). Fluid couplings have critical applications, as they are used in power plants and are specially designed to ensure maximum life and operating time of machines in complex and demanding workplaces, which helps to expand the market worldwide.
In addition, investment in various projects in industries such as mining, paper plants, steel plants, automotive, and marine has been continuously increasing with growing industrialization and infrastructure projects in emerging economies. For instance, China’s investment in the automobile market has been rising in terms of both sales and manufacturing output, with domestic production estimated to exceed 35 million vehicles by 2025.
According to the Asia-Pacific Economic Cooperation, around 70% of all mining output produced globally is from Asia Pacific which may add more investment in several projects over the next few years. This also is an opportunity for the growth of the fluid coupling market.
Emerging countries of the globe such as India, China, South Africa, and Brazil, are continuously investing in energy sectors especially of oil & gas and power generation. This also offers an opportunity for investors to invest in its machineries which primarily require fluid coupling for operation.
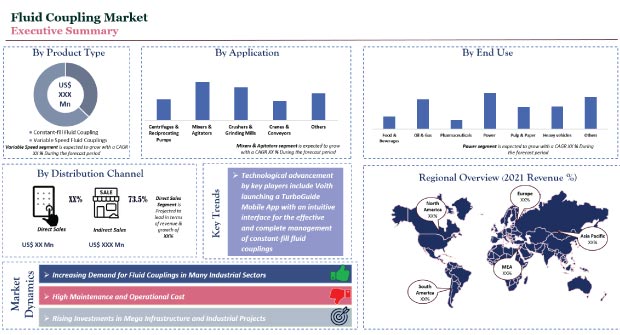
In terms of product type, the fluid coupling market is likely to remain popular in the variable speed fluid coupling segment due to its better ability to control driveline speed and ensure consistency, which will directly impact performance and torque transmission. Moreover, variable speed couplings are found to be suitable for various application of pump, mixers, agitators, centrifuges, fan and compressor applications that ideally has application in every industrial area and may likely pull its demand in the coming years.
However, the constant-fill fluid coupling is used to limit start-up torque, and provide gentle acceleration control, maximum torque and torsional vibration which may also pull its demand by the users. Additionally, the increasing popularity of variable speed fluid coupling in centrifugal pumps and compressors, fans and blowers, centrifuges, and belt conveyors, among others may pull its demand in the foreseeable future.
Among the four biggest mining countries, two are in Asia Pacific: China and Australia. China is the largest producer of mining ores in the world. Thus, rising mining production in Asia Pacific is driving the demand for fluid couplings in this region. Furthermore, as per Elecon Engineering Company, the cement industry in India is growing at a significant rate. With growth in infrastructure, cement production in India is expected to reach 800 million tons by 2030. This increasing demand for cement, infrastructure, and residential, commercial, and industrial construction is subsequently driving the demand for fluid couplings across India.
The North American region is expected to hold the second largest share of the global fluid coupling market. End-use industries such as food & beverages and pharmaceuticals are expected to grow significantly in the region, which will eventually increase the demand for fluid coupling in the near future. The automobile industry is also expanding in this region which increases the demand for fluid coupling. Moreover, power generation is a major consumer of fluid couplings in North America. The fluid coupling market in North America, in terms of power generation, is projected to grow owing to the increasing investment in the U.S. and Canada power generation market, along with a focus on renewable power generation.
Detailed profiles of providers of fluid coupling have been provided in the report to evaluate their financials, key product offerings, recent developments, and strategies. Key players operating in the global fluid coupling market are Premium Transmission, Fluiodmat Limited, Regal Rexnord Corporation, Flender, Voith GmbH & Co. KGaA, The VULKAN Group, Elecon Engineering Company Limited, Transfluid Industrial & Marine, Wichita Clutch, Nara Corporation among the others.
|
Attribute |
Detail |
|
Market Size Value in 2021 (Base Year) |
US$ 1 Bn |
|
Market Forecast Value in 2031 |
US$ 1.5 Bn |
|
Growth Rate (CAGR) |
4.3% |
|
Forecast Period |
2022-2031 |
|
Quantitative Units |
US$ Bn and Thousand Units |
|
Market Analysis |
Global qualitative analysis includes drivers, restraints, opportunities, key trends, upcoming key trends, Porter’s Five Forces analysis, value chain analysis, SWOT analysis, technology analysis, regulatory analysis, etc. Furthermore, at the regional level, qualitative analysis includes key trends, price trends, and key supplier analysis. |
|
Competition Landscape |
|
|
Regions Covered |
|
|
Market Segmentation |
|
|
Companies Profiled |
|
|
Customization Scope |
Available upon Request |
|
Pricing |
Available upon Request |
The market size fluid coupling was valued over US$ 1 Bn.
The fluid coupling market is estimated to grow at a CAGR of 4.3%.
The fluid coupling market is estimated to cross US$ 1.5 Bn.
Increasing demand for fluid couplings in many industrial sectors and advantages of using fluid couplings, along with rising investment in mega infrastructure & industrial projects are likely to drive the demand for fluid couplings in the global market.
Asia Pacific is a more attractive region for vendors in the fluid coupling market with the maximum market share.
Premium Transmission, Fluiodmat Limited, Regal Rexnord Corporation, Flender, Voith GmbH & Co. KGaA, The VULKAN Group, Elecon Engineering Company Limited, Transfluid Industrial & Marine, Wichita Clutch, and Nara Corporation, among others.
1. Preface
1.1. Market Definition and Scope
1.2. Market Segmentation
1.3. Key Research Objectives
1.4. Research Highlights
2. Assumptions
3. Research Methodology
4. Executive Summary
5. Market Overview
5.1. Market Dynamics
5.1.1. Drivers
5.1.2. Restraints
5.1.3. Opportunities
5.2. Key Trends Analysis
5.2.1. Demand Side Analysis
5.2.2. Supply Side Analysis
5.3. Key Market Indicators
5.4. Industry SWOT Analysis
5.5. Raw Material Analysis
5.6. Porter’s Five Forces Analysis
5.7. Value Chain Analysis
5.8. COVID-19 Impact Analysis
5.9. Global Fluid Coupling Market Analysis and Forecast, 2017 - 2031
5.9.1. Market Revenue Projections (US$ Mn)
5.9.2. Market Revenue Projections (Thousand Units)
6. Global Fluid Coupling Market Analysis and Forecast, By Product Type
6.1. Global Fluid Coupling Market (US$ Mn and Thousand Units) Forecast, By Product Type, 2017 - 2031
6.1.1. Constant-fill Fluid Coupling
6.1.2. Variable Speed Fluid Couplings
6.2. Incremental Opportunity, By Product Type
7. Global Fluid Coupling Market Analysis and Forecast, By Application
7.1. Global Fluid Coupling Market (US$ Mn and Thousand Units) Forecast, By Application, 2017 - 2031
7.1.1.1. Centrifuges & Reciprocating Pumps
7.1.1.2. Mixers & Agitators
7.1.1.3. Crushers & Grinding Mills
7.1.1.4. Cranes & Conveyors
7.1.1.5. Others
7.2. Incremental Opportunity, By Application
8. Global Fluid Coupling Market Analysis and Forecast, By End-use
8.1. Global Fluid Coupling Market (US$ Mn and Thousand Units) Forecast, By End-use, 2017 - 2031
8.1.1. Food & Beverages
8.1.2. Oil & Gas
8.1.3. Pharmaceuticals
8.1.4. Power
8.1.5. Pulp & Paper
8.1.6. Heavy Vehicles
8.1.7. Others
8.2. Incremental Opportunity, By End-use
9. Global Fluid Coupling Market Analysis and Forecast, by Distribution Channel
9.1. Global Fluid Coupling Market (US$ Mn and Thousand Units), by Distribution Channel, 2017 - 2031
9.1.1. Direct Sales
9.1.2. Indirect Sales
9.2. Global Incremental Opportunity, by Distribution Channel
10. Global Fluid Coupling Market Analysis and Forecast, by Region
10.1. Global Fluid Coupling Market (US$ Mn and Thousand Units), by Region, 2017 - 2031
10.1.1. North America
10.1.2. Europe
10.1.3. Asia Pacific
10.1.4. Middle East & Africa
10.1.5. South America
10.2. India Incremental Opportunity, by Region
11. North America Fluid Coupling Market Analysis and Forecast
11.1. Regional Snapshot
11.2. Price Trend Analysis
11.2.1. Weighted Average Selling Price (US$)
11.3. Demographic Overview
11.4. Fluid Coupling Market (US$ Mn and Thousand Units) Forecast, By Product Type, 2017 - 2031
11.4.1. Constant-fill Fluid Coupling
11.4.2. Variable Speed Fluid Couplings
11.5. Fluid Coupling Market (US$ Mn and Thousand Units) Forecast, By Application, 2017 - 2031
11.5.1. Centrifuges & Reciprocating Pumps
11.5.2. Mixers & Agitators
11.5.3. Crushers & Grinding Mills
11.5.4. Cranes & Conveyors
11.5.5. Others
11.6. Fluid Coupling Market (US$ Mn and Thousand Units) Forecast, By End-use, 2017 - 2031
11.6.1. Food & Beverages
11.6.2. Oil & Gas
11.6.3. Pharmaceuticals
11.6.4. Power
11.6.5. Pulp & Paper
11.6.6. Heavy Vehicles
11.6.7. Others
11.7. Fluid Coupling Market (US$ Mn and Thousand Units), by Distribution Channel, 2017 - 2031
11.7.1. Direct Sales
11.7.2. Indirect Sales
11.8. Fluid Coupling Market (US$ Mn and Thousand Units) Forecast, By Country & Sub-region, 2017 - 2031
11.8.1. U.S.
11.8.2. Canada
11.8.3. Rest of North America
11.9. Incremental Opportunity Analysis
12. Europe Fluid Coupling Market Analysis and Forecast
12.1. Regional Snapshot
12.2. Price Trend Analysis
12.2.1. Weighted Average Selling Price (US$)
12.3. Demographic Overview
12.4. Fluid Coupling Market (US$ Mn and Thousand Units) Forecast, By Application, 2017 - 2031
12.4.1. Centrifuges & Reciprocating Pumps
12.4.2. Mixers & Agitators
12.4.3. Crushers & Grinding Mills
12.4.4. Cranes & Conveyors
12.4.5. Others
12.5. Fluid Coupling Market (US$ Mn and Thousand Units) Forecast, By End-use, 2017 - 2031
12.5.1. Food & Beverages
12.5.2. Oil & Gas
12.5.3. Pharmaceuticals
12.5.4. Power
12.5.5. Pulp & Paper
12.5.6. Heavy Vehicles
12.5.7. Others
12.6. Fluid Coupling Market (US$ Mn and Thousand Units), by Distribution Channel, 2017 - 2031
12.6.1. Direct Sales
12.6.2. Indirect Sales
12.7. Fluid Coupling Market (US$ Mn and Thousand Units) Forecast, By Country & Sub-region, 2017 - 2031
12.7.1. U.K.
12.7.2. Germany
12.7.3. France
12.7.4. Rest of Europe
12.8. Incremental Opportunity Analysis
13. Asia Pacific Fluid Coupling Market Analysis and Forecast
13.1. Regional Snapshot
13.2. Price Trend Analysis
13.2.1. Weighted Average Selling Price (US$)
13.3. Demographic Overview
13.4. Fluid Coupling Market (US$ Mn and Thousand Units) Forecast, By Product Type, 2017 - 2031
13.4.1. Constant-fill Fluid Coupling
13.4.2. Variable Speed Fluid Couplings
13.5. Fluid Coupling Market (US$ Mn and Thousand Units) Forecast, By Application, 2017 - 2031
13.5.1. Centrifuges & Reciprocating Pumps
13.5.2. Mixers & Agitators
13.5.3. Crushers & Grinding Mills
13.5.4. Cranes & Conveyors
13.5.5. Others
13.6. Fluid Coupling Market (US$ Mn and Thousand Units) Forecast, By End-use, 2017 - 2031
13.6.1. Food & Beverages
13.6.2. Oil & Gas
13.6.3. Pharmaceuticals
13.6.4. Power
13.6.5. Pulp & Paper
13.6.6. Heavy Vehicles
13.6.7. Others
13.7. Fluid Coupling Market (US$ Mn and Thousand Units), by Distribution Channel, 2017 - 2031
13.7.1. Direct Sales
13.7.2. Indirect Sales
13.8. Fluid Coupling Market (US$ Mn and Thousand Units) Forecast, By Country & Sub-region, 2017 - 2031
13.8.1. China
13.8.2. India
13.8.3. Japan
13.8.4. Rest of Asia Pacific
13.9. Incremental Opportunity Analysis
14. Middle East & Africa Fluid Coupling Market Analysis and Forecast
14.1. Regional Snapshot
14.2. Price Trend Analysis
14.2.1. Weighted Average Selling Price (US$)
14.3. Demographic Overview
14.4. Fluid Coupling Market (US$ Mn and Thousand Units) Forecast, By Product Type, 2017 - 2031
14.4.1. Constant-fill Fluid Coupling
14.4.2. Variable Speed Fluid Couplings
14.5. Fluid Coupling Market (US$ Mn and Thousand Units) Forecast, By Application, 2017 - 2031
14.5.1. Centrifuges & Reciprocating Pumps
14.5.2. Mixers & Agitators
14.5.3. Crushers & Grinding Mills
14.5.4. Cranes & Conveyors
14.5.5. Others
14.6. Fluid Coupling Market (US$ Mn and Thousand Units) Forecast, By End-use, 2017 - 2031
14.6.1. Food & Beverages
14.6.2. Oil & Gas
14.6.3. Pharmaceuticals
14.6.4. Power
14.6.5. Pulp & Paper
14.6.6. Heavy Vehicles
14.6.7. Others
14.7. Fluid Coupling Market (US$ Mn and Thousand Units), by Distribution Channel, 2017 - 2031
14.7.1. Direct Sales
14.7.2. Indirect Sales
14.8. Fluid Coupling Market (US$ Mn and Thousand Units) Forecast, By Country & Sub-region, 2017 - 2031
14.8.1. GCC
14.8.2. South Africa
14.8.3. Rest of Middle East & Africa
14.9. Incremental Opportunity Analysis
15. South America Fluid Coupling Market Analysis and Forecast
15.1. Regional Snapshot
15.2. Price Trend Analysis
15.2.1. Weighted Average Selling Price (US$)
15.3. Demographic Overview
15.4. Fluid Coupling Market (US$ Mn and Thousand Units) Forecast, By Product Type, 2017 - 2031
15.4.1. Constant-fill Fluid Coupling
15.4.2. Variable Speed Fluid Couplings
15.5. Fluid Coupling Market (US$ Mn and Thousand Units) Forecast, By Application, 2017 - 2031
15.5.1. Centrifuges & Reciprocating Pumps
15.5.2. Mixers & Agitators
15.5.3. Crushers & Grinding Mills
15.5.4. Cranes & Conveyors
15.5.5. Others
15.6. Fluid Coupling Market (US$ Mn and Thousand Units) Forecast, By End-use, 2017 - 2031
15.6.1. Food & Beverages
15.6.2. Oil & Gas
15.6.3. Pharmaceuticals
15.6.4. Power
15.6.5. Pulp & Paper
15.6.6. Heavy Vehicles
15.6.7. Others
15.7. Fluid Coupling Market (US$ Mn and Thousand Units), by Distribution Channel, 2017 - 2031
15.7.1. Direct Sales
15.7.2. Indirect Sales
15.8. Fluid Coupling Market (US$ Mn and Thousand Units) Forecast, By Country & Sub-region, 2017 - 2031
15.8.1. Brazil
15.8.2. Rest of South America
15.9. Incremental Opportunity Analysis
16. Competition Landscape
16.1. Market Player – Competition Dashboard
16.2. Market Revenue Share Analysis (%), (2020)
16.3. Company Profiles (Details – Company Overview, Sales Area/Geographical Presence, Revenue, Strategy & Business Overview)
16.3.1. Premium Transmission
16.3.1.1. Company Overview
16.3.1.2. Sales Area/Geographical Presence
16.3.1.3. Revenue
16.3.1.4. Strategy & Business Overview
16.3.2. Fluiodmat Limited
16.3.2.1. Company Overview
16.3.2.2. Sales Area/Geographical Presence
16.3.2.3. Revenue
16.3.2.4. Strategy & Business Overview
16.3.3. Regal Rexnord Corporation
16.3.3.1. Company Overview
16.3.3.2. Sales Area/Geographical Presence
16.3.3.3. Revenue
16.3.3.4. Strategy & Business Overview
16.3.4. Flender
16.3.4.1. Company Overview
16.3.4.2. Sales Area/Geographical Presence
16.3.4.3. Revenue
16.3.4.4. Strategy & Business Overview
16.3.5. Voith GmbH & Co. KGaA
16.3.5.1. Company Overview
16.3.5.2. Sales Area/Geographical Presence
16.3.5.3. Revenue
16.3.5.4. Strategy & Business Overview
16.3.6. The VULKAN Group
16.3.6.1. Company Overview
16.3.6.2. Sales Area/Geographical Presence
16.3.6.3. Revenue
16.3.6.4. Strategy & Business Overview
16.3.7. Elecon Engineering Company Limited
16.3.7.1. Company Overview
16.3.7.2. Sales Area/Geographical Presence
16.3.7.3. Revenue
16.3.7.4. Strategy & Business Overview
16.3.8. Wichita Clutch
16.3.8.1. Company Overview
16.3.8.2. Sales Area/Geographical Presence
16.3.8.3. Revenue
16.3.8.4. Strategy & Business Overview
16.3.9. Transfluid Industrial & Marine
16.3.9.1. Company Overview
16.3.9.2. Sales Area/Geographical Presence
16.3.9.3. Revenue
16.3.9.4. Strategy & Business Overview
16.3.10. Nara Corporation
16.3.10.1. Company Overview
16.3.10.2. Sales Area/Geographical Presence
16.3.10.3. Revenue
16.3.10.4. Strategy & Business Overview
17. Key Takeaways
17.1. Identification of Potential Market Spaces
17.1.1. By Product Type
17.1.2. By Application
17.1.3. By End-use
17.1.4. By Distribution Channel
17.1.5. By Region
17.2. Understanding the Procurement Process of Customers
17.3. Preferred Sales & Marketing Strategy
17.4. Prevailing Market Risks
List of Tables
Table 1: Global Fluid Coupling Market Value (US$ Mn) Forecast, 2017-2031, by Product Type
Table 2: Global Fluid Coupling Market Volume (Thousand Units) Forecast, 2017-2031, by Product Type
Table 3: Global Fluid Coupling Market Value (US$ Mn) Forecast, 2017-2031, By Application
Table 4: Global Fluid Coupling Market Volume (Thousand Units) Forecast, 2017-2031, By Application
Table 5: Global Fluid Coupling Market Value (US$ Mn) Forecast, 2017-2031, By End Use
Table 6: Global Fluid Coupling Market Volume (Thousand Units) Forecast, 2017-2031, By End Use
Table 7: Global Fluid Coupling Market Value (US$ Mn) Forecast, 2017-2031, By Distribution Channel
Table 8: Global Fluid Coupling Market Volume (Thousand Units) Forecast, 2017-2031, By Distribution Channel
Table 9: Global Fluid Coupling Market Value (US$ Mn) Forecast, 2017-2031, By Region
Table 10: Global Fluid Coupling Market Volume (Thousand Units) Forecast, 2017-2031, By Region
Table 11: North America Fluid Coupling Market Value (US$ Mn) Forecast, 2017-2031, by Product Type
Table 12: North America Fluid Coupling Market Volume (Thousand Units) Forecast, 2017-2031, by Product Type
Table 13: North America Fluid Coupling Market Value (US$ Mn) Forecast, 2017-2031, By Application
Table 14: North America Fluid Coupling Market Volume (Thousand Units) Forecast, 2017-2031, By Application
Table 15: North America Fluid Coupling Market Value (US$ Mn) Forecast, 2017-2031, By End Use
Table 16: North America Fluid Coupling Market Volume (Thousand Units) Forecast, 2017-2031, By End Use
Table 17: North America Fluid Coupling Market Value (US$ Mn) Forecast, 2017-2031, By Distribution Channel
Table 18: North America Fluid Coupling Market Volume (Thousand Units) Forecast, 2017-2031, By Distribution Channel
Table 19: North America Fluid Coupling Market Value (US$ Mn) Forecast, 2017-2031, By Region
Table 20: North America Fluid Coupling Market Volume (Thousand Units) Forecast, 2017-2031, By Region
Table 21: Europe Fluid Coupling Market Value (US$ Mn) Forecast, 2017-2031, by Product Type
Table 22: Europe Fluid Coupling Market Volume (Thousand Units) Forecast, 2017-2031, by Product Type
Table 23: Europe Fluid Coupling Market Value (US$ Mn) Forecast, 2017-2031, By Application
Table 24: Europe Fluid Coupling Market Volume (Thousand Units) Forecast, 2017-2031, By Application
Table 25: Europe Fluid Coupling Market Value (US$ Mn) Forecast, 2017-2031, By End Use
Table 26: Europe Fluid Coupling Market Volume (Thousand Units) Forecast, 2017-2031, By End Use
Table 27: Europe Fluid Coupling Market Value (US$ Mn) Forecast, 2017-2031, By Distribution Channel
Table 28: Europe Fluid Coupling Market Volume (Thousand Units) Forecast, 2017-2031, By Distribution Channel
Table 29: Europe Fluid Coupling Market Value (US$ Mn) Forecast, 2017-2031, By Region
Table 30: Europe Fluid Coupling Market Volume (Thousand Units) Forecast, 2017-2031, By Region
Table 31: Asia Pacific Fluid Coupling Market Value (US$ Mn) Forecast, 2017-2031, by Product Type
Table 32: Asia Pacific Fluid Coupling Market Volume (Thousand Units) Forecast, 2017-2031, by Product Type
Table 33: Asia Pacific Fluid Coupling Market Value (US$ Mn) Forecast, 2017-2031, By Application
Table 34: Asia Pacific Fluid Coupling Market Volume (Thousand Units) Forecast, 2017-2031, By Application
Table 35: Asia Pacific Fluid Coupling Market Value (US$ Mn) Forecast, 2017-2031, By End Use
Table 36: Asia Pacific Fluid Coupling Market Volume (Thousand Units) Forecast, 2017-2031, By End Use
Table 37: Asia Pacific Fluid Coupling Market Value (US$ Mn) Forecast, 2017-2031, By Distribution Channel
Table 38: Asia Pacific Fluid Coupling Market Volume (Thousand Units) Forecast, 2017-2031, By Distribution Channel
Table 39: Asia Pacific Fluid Coupling Market Value (US$ Mn) Forecast, 2017-2031, By Region
Table 40: Asia Pacific Fluid Coupling Market Volume (Thousand Units) Forecast, 2017-2031, By Region
Table 41: Middle East & Africa Fluid Coupling Market Value (US$ Mn) Forecast, 2017-2031, by Product Type
Table 42: Middle East & Africa Fluid Coupling Market Volume (Thousand Units) Forecast, 2017-2031, by Product Type
Table 43: Middle East & Africa Fluid Coupling Market Value (US$ Mn) Forecast, 2017-2031, By Application
Table 44: Middle East & Africa Fluid Coupling Market Volume (Thousand Units) Forecast, 2017-2031, By Application
Table 45: Middle East & Africa Fluid Coupling Market Value (US$ Mn) Forecast, 2017-2031, By End Use
Table 46: Middle East & Africa Fluid Coupling Market Volume (Thousand Units) Forecast, 2017-2031, By End Use
Table 47: Middle East & Africa Fluid Coupling Market Value (US$ Mn) Forecast, 2017-2031, By Distribution Channel
Table 48: Middle East & Africa Fluid Coupling Market Volume (Thousand Units) Forecast, 2017-2031, By Distribution Channel
Table 49: Middle East & Africa Fluid Coupling Market Value (US$ Mn) Forecast, 2017-2031, By Region
Table 50: Middle East & Africa Fluid Coupling Market Volume (Thousand Units) Forecast, 2017-2031, By Region
Table 51: South America Fluid Coupling Market Value (US$ Mn) Forecast, 2017-2031, by Product Type
Table 52: South America Fluid Coupling Market Volume (Thousand Units) Forecast, 2017-2031, by Product Type
Table 53: South America Fluid Coupling Market Value (US$ Mn) Forecast, 2017-2031, By Application
Table 54: South America Fluid Coupling Market Volume (Thousand Units) Forecast, 2017-2031, By Application
Table 55: South America Fluid Coupling Market Value (US$ Mn) Forecast, 2017-2031, By End Use
Table 56: South America Fluid Coupling Market Volume (Thousand Units) Forecast, 2017-2031, By End Use
Table 57: South America Fluid Coupling Market Value (US$ Mn) Forecast, 2017-2031, By Distribution Channel
Table 58: South America Fluid Coupling Market Volume (Thousand Units) Forecast, 2017-2031, By Distribution Channel
Table 59: South America Fluid Coupling Market Value (US$ Mn) Forecast, 2017-2031, By Region
Table 60: South America Fluid Coupling Market Volume (Thousand Units) Forecast, 2017-2031, By Region
List of Figures
Figure 1: Global Fluid Coupling Market Value (US$ Bn) Forecast, 2017-2031, by Type
Figure 2: Global Fluid Coupling Market Volume (Million units) Forecast, 2017-2031, by Type
Figure 3: Global Fluid Coupling Market, Incremental Opportunities, Forecast, 2017-2031, by Type
Figure 3: Global Fluid Coupling Market Value (US$ Bn) Forecast, 2017-2031, By Resolution
Figure 4: Global Fluid Coupling Market Volume (Million units) Forecast, 2017-2031, By Resolution
Figure 6: Global Fluid Coupling Market, Incremental Opportunities, Forecast, 2017-2031, By Resolution
Figure 7: Global Fluid Coupling Market Value (US$ Bn) Forecast, 2017-2031, By Technology
Figure 8: Global Fluid Coupling Market Volume (Million units) Forecast, 2017-2031, By Technology
Figure 9: Global Fluid Coupling Market, Incremental Opportunities, Forecast, 2017-2031, By Technology
Figure 10: Global Fluid Coupling Market Value (US$ Bn) Forecast, 2017-2031, By Distribution Channel
Figure 11: Global Fluid Coupling Market Volume (Million units) Forecast, 2017-2031, By Distribution Channel
Figure 12: Global Fluid Coupling Market, Incremental Opportunities, Forecast, 2017-2031, By Distribution Channel
Figure 13: Global Fluid Coupling Market Value (US$ Bn) Forecast, 2017-2031, By Region
Figure 14: Global Fluid Coupling Market Volume (Million units) Forecast, 2017-2031, By Region
Figure 15: Global Fluid Coupling Market, Incremental Opportunities, Forecast, 2017-2031, By Region
Figure 16: North America Fluid Coupling Market Value (US$ Bn) Forecast, 2017-2031, by Type
Figure 17: North America Fluid Coupling Market Volume (Million units) Forecast, 2017-2031, by Type
Figure 18: North America Fluid Coupling Market, Incremental Opportunities, Forecast, 2017-2031, by Type
Figure 19: North America Fluid Coupling Market Value (US$ Bn) Forecast, 2017-2031, By Resolution
Figure 20: North America Fluid Coupling Market Volume (Million units) Forecast, 2017-2031, By Resolution
Figure 21: North America Fluid Coupling Market, Incremental Opportunities, Forecast, 2017-2031, By Resolution
Figure 22: North America Fluid Coupling Market Value (US$ Bn) Forecast, 2017-2031, By Technology
Figure 23: North America Fluid Coupling Market Volume (Million units) Forecast, 2017-2031, By Technology
Figure 24: North America Fluid Coupling Market, Incremental Opportunities, Forecast, 2017-2031, By Technology
Figure 25: North America Fluid Coupling Market Value (US$ Bn) Forecast, 2017-2031, By Distribution Channel
Figure 26: North America Fluid Coupling Market Volume (Million units) Forecast, 2017-2031, By Distribution Channel
Figure 27: North America Fluid Coupling Market, Incremental Opportunities, Forecast, 2017-2031, By Distribution Channel
Figure 28: North America Fluid Coupling Market Value (US$ Bn) Forecast, 2017-2031, By Country
Figure 29: North America Fluid Coupling Market Volume (Million units) Forecast, 2017-2031, By Country
Figure 30: North America Fluid Coupling Market, Incremental Opportunities, Forecast, 2017-2031, By Country
Figure 31: Europe Fluid Coupling Market Value (US$ Bn) Forecast, 2017-2031, by Type
Figure 32: Europe Fluid Coupling Market Volume (Million units) Forecast, 2017-2031, by Type
Figure 33: Europe Fluid Coupling Market, Incremental Opportunities, Forecast, 2017-2031, by Type
Figure 34: Europe Fluid Coupling Market Value (US$ Bn) Forecast, 2017-2031, By Resolution
Figure 35: Europe Fluid Coupling Market Volume (Million units) Forecast, 2017-2031, By Resolution
Figure 36: Europe Fluid Coupling Market, Incremental Opportunities, Forecast, 2017-2031, By Resolution
Figure 37: Europe Fluid Coupling Market Value (US$ Bn) Forecast, 2017-2031, By Technology
Figure 38: Europe Fluid Coupling Market Volume (Million units) Forecast, 2017-2031, By Technology
Figure 39: Europe Fluid Coupling Market, Incremental Opportunities, Forecast, 2017-2031, By Technology
Figure 40: Europe Fluid Coupling Market Value (US$ Bn) Forecast, 2017-2031, By Distribution Channel
Figure 41: Europe Fluid Coupling Market Volume (Million units) Forecast, 2017-2031, By Distribution Channel
Figure 42: Europe Fluid Coupling Market, Incremental Opportunities, Forecast, 2017-2031, By Distribution Channel
Figure 43: Europe Fluid Coupling Market Value (US$ Bn) Forecast, 2017-2031, By Country
Figure 44: Europe Fluid Coupling Market Volume (Million units) Forecast, 2017-2031, By Country
Figure 45: Europe Fluid Coupling Market, Incremental Opportunities, Forecast, 2017-2031, By Country
Figure 46: Asia Pacific Fluid Coupling Market Value (US$ Bn) Forecast, 2017-2031, by Type
Figure 47: Asia Pacific Fluid Coupling Market Volume (Million units) Forecast, 2017-2031, by Type
Figure 48: Asia Pacific Fluid Coupling Market, Incremental Opportunities, Forecast, 2017-2031, by Type
Figure 49: Asia Pacific Fluid Coupling Market Value (US$ Bn) Forecast, 2017-2031, By Resolution
Figure 50: Asia Pacific Fluid Coupling Market Volume (Million units) Forecast, 2017-2031, By Resolution
Figure 51: Asia Pacific Fluid Coupling Market, Incremental Opportunities, Forecast, 2017-2031, By Resolution
Figure 52: Asia Pacific Fluid Coupling Market Value (US$ Bn) Forecast, 2017-2031, By Technology
Figure 53: Asia Pacific Fluid Coupling Market Volume (Million units) Forecast, 2017-2031, By Technology
Figure 54: Asia Pacific Fluid Coupling Market, Incremental Opportunities, Forecast, 2017-2031, By Technology
Figure 55: Asia Pacific Fluid Coupling Market Value (US$ Bn) Forecast, 2017-2031, By Distribution Channel
Figure 56: Asia Pacific Fluid Coupling Market Volume (Million units) Forecast, 2017-2031, By Distribution Channel
Figure 57: Asia Pacific Fluid Coupling Market, Incremental Opportunities, Forecast, 2017-2031, By Distribution Channel
Figure 58: Asia Pacific Fluid Coupling Market Value (US$ Bn) Forecast, 2017-2031, By Country
Figure 59: Asia Pacific Fluid Coupling Market Volume (Million units) Forecast, 2017-2031, By Country
Figure 60: Asia Pacific Fluid Coupling Market, Incremental Opportunities, Forecast, 2017-2031, By Country
Figure 61: Middle East & Africa Fluid Coupling Market Value (US$ Bn) Forecast, 2017-2031, by Type
Figure 62: Middle East & Africa Fluid Coupling Market Volume (Million units) Forecast, 2017-2031, by Type
Figure 63: Middle East & Africa Fluid Coupling Market, Incremental Opportunities, Forecast, 2017-2031, by Type
Figure 64: Middle East & Africa Fluid Coupling Market Value (US$ Bn) Forecast, 2017-2031, By Resolution
Figure 65: Middle East & Africa Fluid Coupling Market Volume (Million units) Forecast, 2017-2031, By Resolution
Figure 66: Middle East & Africa Fluid Coupling Market, Incremental Opportunities, Forecast, 2017-2031, By Resolution
Figure 67: Middle East & Africa Fluid Coupling Market Value (US$ Bn) Forecast, 2017-2031, By Technology
Figure 68: Middle East & Africa Fluid Coupling Market Volume (Million units) Forecast, 2017-2031, By Technology
Figure 69: Middle East & Africa Fluid Coupling Market, Incremental Opportunities, Forecast, 2017-2031, By Technology
Figure 70: Middle East & Africa Fluid Coupling Market Value (US$ Bn) Forecast, 2017-2031, By Distribution Channel
Figure 71: Middle East & Africa Fluid Coupling Market Volume (Million units) Forecast, 2017-2031, By Distribution Channel
Figure 72: Middle East & Africa Fluid Coupling Market, Incremental Opportunities, Forecast, 2017-2031, By Distribution Channel
Figure 73: Middle East & Africa Fluid Coupling Market Value (US$ Bn) Forecast, 2017-2031, By Country
Figure 74: Middle East & Africa Fluid Coupling Market Volume (Million units) Forecast, 2017-2031, By Country
Figure 75: Middle East & Africa Fluid Coupling Market, Incremental Opportunities, Forecast, 2017-2031, By Country
Figure 76: South America Fluid Coupling Market Value (US$ Bn) Forecast, 2017-2031, by Type
Figure 77: South America Fluid Coupling Market Volume (Million units) Forecast, 2017-2031, by Type
Figure 78: South America Fluid Coupling Market, Incremental Opportunities, Forecast, 2017-2031, by Type
Figure 79: South America Fluid Coupling Market Value (US$ Bn) Forecast, 2017-2031, By Resolution
Figure 80: South America Fluid Coupling Market Volume (Million units) Forecast, 2017-2031, By Resolution
Figure 81: South America Fluid Coupling Market, Incremental Opportunities, Forecast, 2017-2031, By Resolution
Figure 82: South America Fluid Coupling Market Value (US$ Bn) Forecast, 2017-2031, By Technology
Figure 83: South America Fluid Coupling Market Volume (Million units) Forecast, 2017-2031, By Technology
Figure 84: South America Fluid Coupling Market, Incremental Opportunities, Forecast, 2017-2031, By Technology
Figure 85: South America Fluid Coupling Market Value (US$ Bn) Forecast, 2017-2031, By Distribution Channel
Figure 86: South America Fluid Coupling Market Volume (Million units) Forecast, 2017-2031, By Distribution Channel
Figure 87: South America Fluid Coupling Market, Incremental Opportunities, Forecast, 2017-2031, By Distribution Channel
Figure 88: South America Fluid Coupling Market Value (US$ Bn) Forecast, 2017-2031, By Country
Figure 89: South America Fluid Coupling Market Volume (Million units) Forecast, 2017-2031, By Country
Figure 90: South America Fluid Coupling Market, Incremental Opportunities, Forecast, 2017-2031, By Country
Copyright © Transparency Market Research, Inc. All Rights reserved
Trust Online

Fluid Coupling Market