
Reports
Reports
Fish-free Omega-3 Ingredients Market: An Emerging Landscape for Innovation
Spurred by the growing health awareness among consumers, a variety of fish, including salmon and mackerel, have gained popularity as the best source of omega-3 fatty acids, which are an essential part of a healthy diet. However, the mounting wave of veganism and the burgeoning number of consumers shifting to vegetarian diets are among the critical factors increasing the hunt for vegetarian sources of omega-3 fatty acids.
With a wide range of vegetarian foods that source omega-3 and its magnified demand, fish-free omega-3 ingredients are moving from a niche product towards becoming a billion-dollar industry. Consumer awareness about the body’s need for essential fatty acids, including omega-3-6-9 fatty acids, is growing, and this is creating the potential for innovation in the fish-free omega-3 ingredients space.
Taking into consideration the bioavailability and health benefits of vegetarian sources of omega-3 fatty acids, Transparency Market Research (TMR) conducted a thorough research to reach the growth prospects of the fish-free omega-3 ingredients landscape. In its latest offering, TMR features exclusive, actionable insights for stakeholders and investors in this market to leverage the profitability of fish-free omega-3 ingredients.
Plant-based Omega-3: Evolution from a Magic Number to a Magic Source
The food & beverage industry has been undergoing health-driven transformations with increasing consumer awareness about a health-benefitting diets. Consumers’ knowledge about healthy dietary habits is going beyond the benefits of omega-3s and importance of balancing omega-3 and omega-6 acids in a diet. The interest is shifting from the type to the source of omega fatty acids across the health-conscious consumer base around the world, which is shaping the future of the market for plant-based omega-3 ingredients.
The increasing popularity of plant-based and vegetarian ingredients across the food industry has been bolstering the growth of the fish-free omega-3 ingredients landscape. In 2018, the market witnessed a 6.5% year-over-year growth over 2017, recording a sales of ~35 thousand MT, and reaching a market valuation of US$ 550 million. With ongoing innovations in both, bio-based sources of omega-3 fatty acids and manufacturing procedures, the fish-free omega-3 ingredients market is expected to witness incremental growth in the coming years.
Stakeholders are expected to continue to bank on the growing population of vegan consumers and preference for algae- or plant-based omega-3 ingredients to maintain the momentum. However, slow regulatory approvals will remain a primary challenge for market players, as they will continue to make it difficult for manufacturers to offer competitive prices and delay their products from reaching the fish-free omega-3 ingredients market.
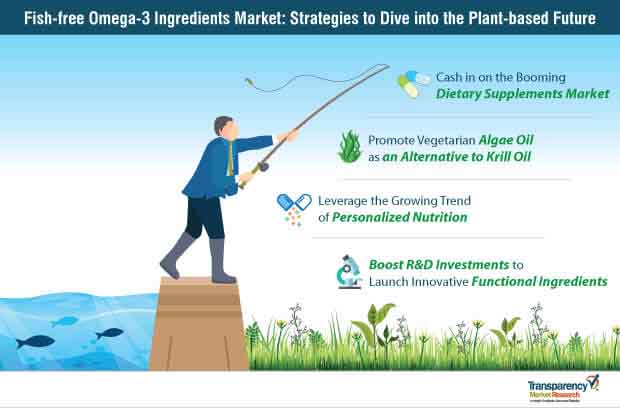
Nevertheless, the ongoing trend of substituting krill oil in omega-3 dietary supplements with vegetarian algae oil will continue to support the growth of the fish-free omega-3 ingredients landscape in the foreseeable future.
Gains Underpinned by the Proliferation of the Dietary Supplements Industry
The ever-growing demand for herbal and nutritional dietary supplements is mainly attributed to the heightened consumer interest in preventive health, and the need for adding essential nutrients and vitamins to the everyday diet. With consumers realizing the value of good health, the global sales of dietary supplements have reached new heights in the past decade. In addition, the rise of the self-directed consumer base, which believes in self-help and making health-related decisions without professional help, has fostered the growth of the dietary supplements industry.
The global sales of fish-free omega-3 ingredients are expected to be valued at ~ US$ 590 million in 2019, with ~ 45% in the dietary supplements industry. With the increasing demand for nutritional dietary supplements, this trend is likely to grow stronger in the coming years. Manufacturers in the fish-free omega-3 ingredients landscape are likely to tap into the sales potential in the dietary supplements industry, where the trend of personalized nutrition is gaining immense popularity.
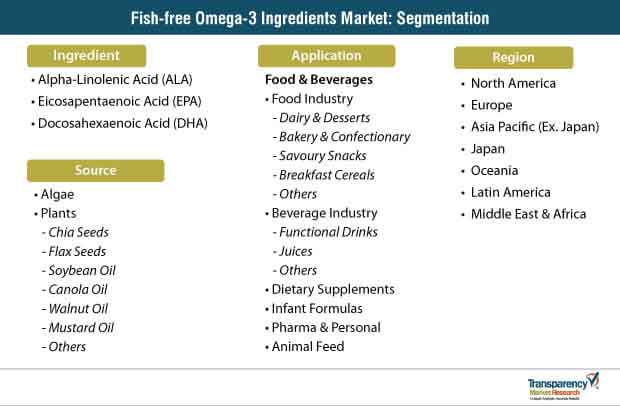
Consumer awareness about the health problems caused due to the deficiency of omega-3 fatty acids, such as Docosahexaenoic acid (DHA), eicosapentaenoic acid (EPA), and alpha-linolenic acid (ALA), has triggered the demand for personalized omega-3 dietary supplements. The sales of fish-free omega-3 ingredients rich in ALA have increased rapidly, accounting for half the revenue share of the global market in 2018. Manufacturers are likely to shift focus on personalized nutrition to capitalize on the recent trends in the dietary supplements industry in the coming years.
Success Strategies Underscore Market Players’ Focus on Gaining Regulatory Approvals
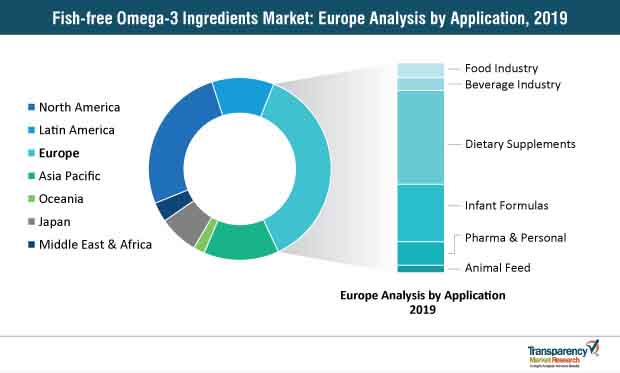
Manufacturers in the fish-free omega-3 ingredients market are riding on the coattails of the strong demand for flax-based ingredients, especially in the European Union (EU). Europe accounts for one-third revenue share of the global market, creating sales opportunities for market players in the fish-free omega-3 ingredients landscape.
Europe is expected to grow as the most lucrative market for fish-free omega-3 ingredients; however, the inevitable need to comply with the stringent regulatory framework will continue to create a barrier for stakeholders to attain profitable sales in the region. Leading players in the market are adopting the strategy of investing heavily in research & development (R&D), and launching innovative ingredients, while conforming to the regulations; this also remains a key to grow in the EU.
Introducing novel fish-free omega-3 ingredients with functional health benefits is expected to gain popularity as the strategy to win in this market. In addition, leading manufacturers are likely to boost investments in developing economies in Asia Pacific, including China, India and some ASEAN countries, to reap benefits of the availability of raw materials in the region. In the coming years, Europe is likely to increase the imports of raw materials from these countries, and this will support the growth of the fish-free omega-3 ingredients market in Asia Pacific (excluding Japan).
Analysis on the Competitive Landscape
The fish-free omega-3 ingredients market has been witnessing healthy growth despite the higher demand for fish oil as an omega-3 ingredient. The competitive landscape is highly fragmented, as the number of new biotech companies entering the market is multiplying rapidly. Although the market is currently at a nascent stage, large nutrition companies such as Koninklijke DSM N.V., Cargill Inc., and BASF have entered this landscape, sensing the immense potential for growth in the market space.
Global players are focusing on joining forces with local bio-nutrition companies to combine their R&D facilities with the manufacturing capabilities of local players, and launch innovative products in the market. For instance, in June 2018, BASF announced that it has signed an agreement with Xerion Limited, a life science company in Australia, to capitalize on the personalized nutrition trend in Asia Pacific. The company aims to leverage Xerion’s technology to assess omega-3 levels in the domestic population, and stabilize EPA and DHA on a solid matrix.
New entrants in the market are focusing on product innovation, not only to expand their reach in various end-use segments, especially in nutritional beverages, but also to improve the shelf life of diverse applications of fish-free omega-3 ingredients. For example, in June 2019, Remedy Organics—a producer of plant-based functional wellness drinks, launched a new range of functional beverages—Golden Mind—which include DHA omega-3 ingredients that are derived from sustainably sourced microalgae.
Analysts’ Viewpoint
The authors of TMR’s study on the fish-free omega-3 ingredients market remain optimistic about the scope for growth in this landscape. Product innovation will remain the key for manufacturers to witness growth in the dietary supplements industry, as well as in the functional food & beverage space. The personalized nutrition trend is growing stronger than ever, and fish-free omega-3 ingredient manufacturers who will join the bandwagon will lead the race to replace fish oil in omega-3 ingredients with plant-based oils and seeds. With the paradigm shift from meat-based ingredients to plant-based ingredients in the food & beverage industry, the fish-free omega-3 ingredients market is expected to become a billion-dollar market in the coming decade.
Fish-free Omega-3 Ingredients Market Witnessing Growth Due to Radical Shift towards Sustainability and Longevity
Vegan Diet Lacking in Omega-3 Increasing the Need for Fish-free Omega-3 Supplements
Fish-free Omega-3 Ingredients – A Profitable Business Opportunity
Increasing Usage of Fish-free Omega-3 Ingredients in Infant Formula, Nutritional Products, and Adult Dietary Supplements
Health Benefits of Fish-free Omega-3 Ingredients Anticipated to Drive Sales
Fish-free Omega-3 Ingredients: Market Players
Key players operating in the fish-free omega-3 ingredients market, as profiled in the study, include
1. Global Fish-free Omega-3 Ingredients Market - Executive Summary
1.1. Global Fish-free Omega-3 Ingredients Market Analysis
1.2. Vertical Specific Market Penetration
1.3. Application – Product Mapping
1.4. Competition Blueprint
1.5. Technology Time Line Mapping
1.6. TMR Analysis and Recommendations
2. Market Overview
2.1. Market Introduction
2.2. Market Definition
2.3. Market Taxonomy
3. Product Innovation / Development Trends
3.1. Cultural Customization to Target Specific Population and Ethnic Group
3.2. Creating New Delivery Mechanisms
3.3. Indication Specific / Targeted Supplement Formulation
3.4. Shift Toward Natural Ingredients
3.5. Preferential Inclination towards Non-Modified Functional Ingredients
3.6. Transformed Packaging to Suit Customer Orientation
3.7. Brand Differentiation through Packaging
4. Market Background and Associated Industry Indicators
4.1. Transformed Nutraceuticals Market (Industry Proposition Then and Now)
4.2. Varying Definition and Regulation for Omega 3 Supplement across the Globe
4.3. Rising Cost of Healthcare and Role of Omega 3 Supplements
4.4. Preventive Healthcare is Getting Traction then Treatment
4.5. Consumer Out of Pocket Healthcare Expenditure
4.6. Per Capita Health Food and Supplement Spending
4.7. Nutraceutical Supplement Spending (as a percentage of total Health Food and Supplement Spending)
4.8. Convergence of Food and Pharmaceuticals
4.9. Nutraceutical Supplement and Omega 3 Product Hotspot - Pipeline Analysis
4.10. Macro-Economic Factors - Relevance & Impact
4.10.1. Healthcare Sector GVA and Growth
4.10.2. Retail Sector GVA and Growth
4.10.3. Per Capita Disposable Income
4.10.4. Organized Retail Penetration
4.10.5. Middle Income Population Group
4.10.6. Global GDP Growth Outlook
4.11. Forecast Factors - Relevance & Impact
4.11.1. Top Companies Historical Growth
4.11.2. Target Incidence Occurrence Rate
4.11.3. Functional Food Industry Growth
4.11.4. Out of Pocket Healthcare Expenditure Trend
5. Market Dynamics
5.1. Drivers
5.1.1. Vegan & vegetarians demanding Fish-free Omega-3 ingredients and supplements
5.1.2. Changing Lifestyle and Dietary Pattern
5.1.3. Increased Awareness
5.1.4. Ageing Population
5.2. Restraints and Market Risks
5.2.1. Slower Regulatory Approval for Health Claims
5.2.2. Cluttered Market Behavior
5.2.3. Limited Availability of Omega 3 Ingredients in High Potential Countries
5.3. Opportunity Analysis
5.3.1. Total Addressable Opportunity
5.3.2. Innovation Hub and Test Markets
6. Policy and Regulatory Landscape
6.1. Dietary Supplement Health and Education Act (DSHEA)
6.2. Federal Food & Cosmetics Act
6.3. Europe Food & Safety Authority
6.4. State Food and Drug Administration (SFDA)
6.5. Foods for Specified Health Uses
6.6. FSSAI
6.7. Food Packaging Claims
6.8. Labeling and Claims
7. Supply Chain Analysis
7.1. Profitability and Gross Margin Analysis By Competition
7.2. List of Active Participants- By Region
7.2.1. Raw Material Suppliers
7.2.2. Key Manufacturers
7.2.3. Key Distributor/Retailers
7.2.4. Operating Margins
8. Global Fish-free Omega-3 Ingredients Market Pricing Analysis
8.1. Price Point Assessment by Ingredient
8.2. Regional Average Pricing Analysis
8.2.1. North America
8.2.2. Latin America
8.2.3. Europe
8.2.4. Asia Pacific Ex. Japan (APEJ)
8.2.5. Japan
8.2.6. Oceania
8.2.7. Middle East and Africa
8.3. Price Forecast till 2029
8.4. Factors Influencing Pricing
9. Global Fish-free Omega-3 Ingredients Market Analysis and Forecast
9.1. Market Size Analysis (2014-2018) and Forecast (2019-2029)
9.1.1. Market Value (US$ Mn) and Volume (Tons) and Y-o-Y Growth
9.1.2. Absolute $ Opportunity
9.2. Global Fish-free Omega-3 Ingredients Market Scenario Forecast (Optimistic, Likely and Conservative Market Conditions)
9.2.1. Forecast Factors and Relevance of Impact
9.2.2. Regional Fish-free Omega-3 Ingredients Market Business Performance Summary
10. Global Fish-free Omega-3 Ingredients Market Analysis By Ingredient
10.1. Introduction
10.1.1. Y-o-Y Growth Comparison By Ingredient
10.1.2. Basis Point Share (BPS) Analysis By Ingredient
10.2. Fish-free Omega-3 Ingredients Market Size (US$ Mn) and Volume (MT) Analysis (2014-2018) & Forecast (2019-2029) By Ingredient
10.2.1. Alpha-Linolenic Acid (ALA)
10.2.2. Eicosapentaenoic Acid (EPA)
10.2.3. Docosahexaenoic Acid (DHA)
10.3. Market Attractiveness Analysis By Ingredient
11. Global Fish-free Omega-3 Ingredients Market Analysis By Source
11.1. Introduction
11.1.1. Y-o-Y Growth Comparison By Source
11.1.2. Basis Point Share (BPS) Analysis By Source
11.2. Fish-free Omega-3 Ingredients Market Size (US$ Mn) and Volume (MT) Analysis (2014-2018) & Forecast (2019-2029) By Source
11.2.1. Algae
11.2.2. Plants
11.2.2.1. Chia Seeds
11.2.2.2. Flax Seeds
11.2.2.3. Soybean Oil
11.2.2.4. Canola Oil
11.2.2.5. Walnut Oil
11.2.2.6. Mustard Oil
11.2.2.7. Others
11.3. Market Attractiveness Analysis By Source
12. Global Fish-free Omega-3 Ingredients Market Analysis By Application
12.1. Introduction
12.1.1. Y-o-Y Growth Comparison By Application
12.1.2. Basis Point Share (BPS) Analysis By Application
12.2. Fish-free Omega-3 Ingredients Market Size (US$ Mn) and Volume (MT) Analysis (2014-2018) & Forecast (2019-2029) By Application
12.2.1. Food and beverage
12.2.1.1. Food Industry
12.2.1.1.1. Dairy & dessert
12.2.1.1.2. Bakery & Confectionary
12.2.1.1.3. Savoury Snacks
12.2.1.1.4. Breakfast Cereals
12.2.1.1.5. Others
12.2.1.2. Beverage industry
12.2.1.2.1. Functional Drinks
12.2.1.2.2. Juices
12.2.1.2.3. Others
12.2.2. Pharmaceutical and Nutraceutical industry
12.2.3. Infant Formula
12.2.4. Animal Feed
12.3. Market Attractiveness Analysis By Application
13. Global Fish-free Omega-3 Ingredients Market Analysis and Forecast, By Region
13.1. Introduction
13.1.1. Basis Point Share (BPS) Analysis By Region
13.1.2. Y-o-Y Growth Projections By Region
13.2. Fish-free Omega-3 Ingredients Market Size (US$ Mn) and Volume (MT) Analysis (2014-2018) & Forecast (2019-2029) By Region
13.2.1. North America
13.2.2. Europe
13.2.3. APEJ
13.2.4. Japan
13.2.5. Oceania
13.2.6. Latin America
13.2.7. Middle East and Africa
13.3. Market Attractiveness Analysis By Region
14. North America Fish-free Omega-3 Ingredients Market Analysis and Forecast
14.1. Introduction
14.1.1. Basis Point Share (BPS) Analysis By Country
14.1.2. Y-o-Y Growth Projections By Country
14.2. Fish-free Omega-3 Ingredients Market Size (Value (US$) and Volume (MT) Analysis (2014-2018) and Forecast (2019-2029)
14.2.1. Market Attractiveness By Country
14.2.1.1. U.S.
14.2.1.2. Canada
14.2.2. By Ingredient
14.2.3. By Source
14.2.4. By Application
14.3. Market Attractiveness Analysis
14.3.1. By Country
14.3.2. By Ingredient
14.3.3. By Source
14.3.4. By Application
14.4. Drivers and Restraints: Impact Analysis
15. Latin America Fish-free Omega-3 Ingredients Market Analysis and Forecast
15.1. Introduction
15.1.1. Basis Point Share (BPS) Analysis By Country
15.1.2. Y-o-Y Growth Projections By Country
15.1.3. Key Regulations
15.2. Fish-free Omega-3 Ingredients Market Size (Value (US$) and Volume (MT) Analysis (2014-2018) and Forecast (2019-2029)
15.2.1. By Country
15.2.1.1. Brazil
15.2.1.2. Mexico
15.2.1.3. Chile
15.2.1.4. Peru
15.2.1.5. Argentina
15.2.1.6. Rest of Latin America
15.2.2. By Ingredient
15.2.3. By Source
15.2.4. By Application
15.3. Market Attractiveness Analysis
15.3.1. By Ingredient
15.3.2. By Source
15.3.3. By Application
15.4. Drivers and Restraints: Impact Analysis
16. Europe Fish-free Omega-3 Ingredients Market Analysis and Forecast
16.1. Introduction
16.1.1. Basis Point Share (BPS) Analysis By Country
16.1.2. Y-o-Y Growth Projections By Country
16.1.3. Key Regulations
16.2. Fish-free Omega-3 Ingredients Market Size (Value (US$) and Volume (MT) Analysis (2014-2018) and Forecast (2019-2029)
16.2.1. By Country
16.2.1.1. EU-4 (Germany, France, Italy, Spain)
16.2.1.2. U.K.
16.2.1.3. BENELUX
16.2.1.4. Nordic
16.2.1.5. Russia
16.2.1.6. Poland
16.2.1.7. Rest of Europe
16.2.2. By Ingredient
16.2.3. By Source
16.2.4. By Application
16.3. Market Attractiveness Analysis
16.3.1. By Ingredient
16.3.2. By Source
16.3.3. By Application
16.4. Drivers and Restraints: Impact Analysis
17. APEJ Fish-free Omega-3 Ingredients Market Analysis and Forecast
17.1. Introduction
17.1.1. Basis Point Share (BPS) Analysis By Country
17.1.2. Y-o-Y Growth Projections By Country
17.1.3. Key Regulations
17.2. Fish-free Omega-3 Ingredients Market Size (Value (US$) and Volume (MT) Analysis (2014-2018) and Forecast (2019-2029)
17.2.1. By Country
17.2.1.1. China
17.2.1.2. India
17.2.1.3. South Korea
17.2.1.4. ASEAN
17.2.2. By Ingredient
17.2.3. By Source
17.2.4. By Application
17.3. Market Attractiveness Analysis
17.3.1. By Ingredient
17.3.2. By Source
17.3.3. By Application
17.4. Drivers and Restraints: Impact Analysis
18. Japan Fish-free Omega-3 Ingredients Market Analysis and Forecast
18.1. Introduction
18.1.1. Basis Point Share (BPS) Analysis By Country
18.1.2. Y-o-Y Growth Projections By Country
18.1.3. Key Regulations
18.2. Fish-free Omega-3 Ingredients Market Size (Value (US$) and Volume (MT) Analysis (2014-2018) and Forecast (2019-2029)
18.2.1. By Ingredient
18.2.2. By Source
18.2.3. By Application
18.3. Market Attractiveness Analysis
18.3.1. By Ingredient
18.3.2. By Source
18.3.3. By Application
18.4. Drivers and Restraints: Impact Analysis
19. Oceania Fish-free Omega-3 Ingredients Market Analysis and Forecast
19.1. Introduction
19.1.1. Basis Point Share (BPS) Analysis By Country
19.1.2. Y-o-Y Growth Projections By Country
19.1.3. Key Regulations
19.2. Fish-free Omega-3 Ingredients Market Size (Value (US$) and Volume (MT) Analysis (2014-2018) and Forecast (2019-2029)
19.2.1. By Ingredient
19.2.2. By Source
19.2.3. By Application
19.3. Market Attractiveness Analysis
19.3.1. By Ingredient
19.3.2. By Source
19.3.3. By Application
19.4. Drivers and Restraints: Impact Analysis
20. Middle East and Africa (MEA) Fish-free Omega-3 Ingredients Market Analysis and Forecast
20.1. Introduction
20.1.1. Basis Point Share (BPS) Analysis By Country
20.1.2. Y-o-Y Growth Projections By Country
20.1.3. Key Regulations
20.2. Fish-free Omega-3 Ingredients Market Size (Value (US$) and Volume (MT) Analysis (2014-2018) and Forecast (2019-2029)
20.2.1. By Country
20.2.1.1. GCC Countries
20.2.1.2. South Africa
20.2.1.3. North Africa
20.2.1.4. Rest of MEA
20.2.2. By Ingredient
20.2.3. By Source
20.2.4. By Application
20.3. Market Attractiveness Analysis
20.3.1. By Ingredient
20.3.2. By Source
20.3.3. By Application
20.4. Drivers and Restraints: Impact Analysis
21. Global Omega 3 Supplements Market Outlook
21.1. Global Omega 3 Supplements Market Analysis and Forecast
21.1.1. Market Size Analysis (2014-2018) and Forecast (2019-2029)
21.1.1.1. Market Value (US$ Mn) and Volume (Tons) and Y-o-Y Growth
21.1.1.2. Absolute $ Opportunity
21.1.2. Global Omega 3 Supplements Market Scenario Forecast (Optimistic, Likely and Conservative Market Conditions)
21.1.2.1. Forecast Factors and Relevance of Impact
21.1.2.2. Regional Omega 3 Supplements Market Business Performance Summary
21.2. Global Omega 3 Supplements Market Analysis By Ingredient
21.2.1. Introduction
21.2.1.1. Y-o-Y Growth Comparison By Form Type
21.2.1.2. Basis Point Share (BPS) Analysis By Form Type
21.2.2. Omega 3 Supplements Market Size (US$ Mn) and Volume (MT) Analysis (2014-2018) & Forecast (2019-2029) By Form Type
21.2.2.1. Powder
21.2.2.2. Capsules
21.2.2.3. Others
21.2.3. Market Attractiveness Analysis By Form Type
21.3. Global Omega 3 Supplements Market Analysis By Price Range
21.3.1. Introduction
21.3.1.1. Y-o-Y Growth Comparison By Price Range
21.3.1.2. Basis Point Share (BPS) Analysis By Price Range
21.3.2. Omega 3 Supplements Market Size (US$ Mn) and Volume (MT) Analysis (2014-2018) & Forecast (2019-2029) By Price Range
21.3.2.1. Below $10
21.3.2.2. $10 - $20
21.3.2.3. $20 - $50
21.3.2.4. $50 - $100
21.3.2.5. $250 - $500
21.3.2.6. $500 - $750
21.3.3. Market Attractiveness Analysis By Price Range
22. Competition Assessment
22.1. Global Fish-free Omega-3 Ingredients Market Competition - a Dashboard View
22.2. Global Fish-free Omega-3 Ingredients Market Structure Analysis
22.3. Global Fish-free Omega-3 Ingredients Market Company Share Analysis
22.3.1. For Tier 1 Market Players, 2018
22.3.2. Company Market Share Analysis of Top 10 Players, By Region
22.4. Key Participants Market Presence (Intensity Mapping) by Region
23. Brand Assessment
23.1. Brand Identity (Brand as Product, Brand as Organization, Brand as Person, Brand as Symbol)
23.2. Fish-free Omega-3 Ingredients Audience and Positioning (Demographic Segmentation, Geographic Segmentation, Psychographic Segmentation, Situational Segmentation)
23.3. Brand Strategy
24. Competition Deep-dive
24.1. Croda International plc
24.1.1. Key Inclusions In Company Profiles
24.1.2. Overview
24.1.3. Product Portfolio
24.1.4. Sales Footprint
24.1.5. Channel Footprint
24.1.5.1. Distributors List
24.1.5.2. Sales Channel (Clients)
24.1.6. Strategy Overview
24.1.6.1. Marketing Strategy
24.1.6.2. Culture Strategy
24.1.6.3. Channel Strategy
24.1.7. SWOT Analysis
24.1.8. Financial Analysis
24.1.9. Revenue Share
24.1.9.1. By Product Ingredient
24.1.9.2. By Region
24.1.10. Key Clients
24.1.11. Analyst Comments
24.2. Natural Products Drugs GmbH
24.2.1. Key Inclusions In Company Profiles
24.2.2. Overview
24.2.3. Product Portfolio
24.2.4. Sales Footprint
24.2.5. Channel Footprint
24.2.5.1. Distributors List
24.2.5.2. Sales Channel (Clients)
24.2.6. Strategy Overview
24.2.6.1. Marketing Strategy
24.2.6.2. Culture Strategy
24.2.6.3. Channel Strategy
24.2.7. SWOT Analysis
24.2.8. Financial Analysis
24.2.9. Revenue Share
24.2.9.1. By Product Ingredient
24.2.9.2. By Region
24.2.10. Key Clients
24.2.11. Analyst Comments
24.3. Hero Nutritionals Inc.
24.3.1. Key Inclusions In Company Profiles
24.3.2. Overview
24.3.3. Product Portfolio
24.3.4. Sales Footprint
24.3.5. Channel Footprint
24.3.5.1. Distributors List
24.3.5.2. Sales Channel (Clients)
24.3.6. Strategy Overview
24.3.6.1. Marketing Strategy
24.3.6.2. Culture Strategy
24.3.6.3. Channel Strategy
24.3.7. SWOT Analysis
24.3.8. Financial Analysis
24.3.9. Revenue Share
24.3.9.1. By Product Ingredient
24.3.9.2. By Region
24.3.10. Key Clients
24.3.11. Analyst Comments
24.4. Arista Industries Inc
24.4.1. Key Inclusions In Company Profiles
24.4.2. Overview
24.4.3. Product Portfolio
24.4.4. Sales Footprint
24.4.5. Channel Footprint
24.4.5.1. Distributors List
24.4.5.2. Sales Channel (Clients)
24.4.6. Strategy Overview
24.4.6.1. Marketing Strategy
24.4.6.2. Culture Strategy
24.4.6.3. Channel Strategy
24.4.7. SWOT Analysis
24.4.8. Financial Analysis
24.4.9. Revenue Share
24.4.9.1. By Product Ingredient
24.4.9.2. By Region
24.4.10. Key Clients
24.4.11. Analyst Comments
24.5. Epax Norway AS
24.5.1. Key Inclusions In Company Profiles
24.5.2. Overview
24.5.3. Product Portfolio
24.5.4. Sales Footprint
24.5.5. Channel Footprint
24.5.5.1. Distributors List
24.5.5.2. Sales Channel (Clients)
24.5.6. Strategy Overview
24.5.6.1. Marketing Strategy
24.5.6.2. Culture Strategy
24.5.6.3. Channel Strategy
24.5.7. SWOT Analysis
24.5.8. Financial Analysis
24.5.9. Revenue Share
24.5.9.1. By Product Ingredient
24.5.9.2. By Region
24.5.10. Key Clients
24.5.11. Analyst Comments
24.6. BASF SE
24.6.1. Key Inclusions In Company Profiles
24.6.2. Overview
24.6.3. Product Portfolio
24.6.4. Sales Footprint
24.6.5. Channel Footprint
24.6.5.1. Distributors List
24.6.5.2. Sales Channel (Clients)
24.6.6. Strategy Overview
24.6.6.1. Marketing Strategy
24.6.6.2. Culture Strategy
24.6.6.3. Channel Strategy
24.6.7. SWOT Analysis
24.6.8. Financial Analysis
24.6.9. Revenue Share
24.6.9.1. By Product Ingredient
24.6.9.2. By Region
24.6.10. Key Clients
24.6.11. Analyst Comments
24.7. Barleans Organic Oils
24.7.1. Key Inclusions In Company Profiles
24.7.2. Overview
24.7.3. Product Portfolio
24.7.4. Sales Footprint
24.7.5. Channel Footprint
24.7.5.1. Distributors List
24.7.5.2. Sales Channel (Clients)
24.7.6. Strategy Overview
24.7.6.1. Marketing Strategy
24.7.6.2. Culture Strategy
24.7.6.3. Channel Strategy
24.7.7. SWOT Analysis
24.7.8. Financial Analysis
24.7.9. Revenue Share
24.7.9.1. By Product Ingredient
24.7.9.2. By Region
24.7.10. Key Clients
24.7.11. Analyst Comments
24.8. Denomega Nutritional Oils
24.8.1. Key Inclusions In Company Profiles
24.8.2. Overview
24.8.3. Product Portfolio
24.8.4. Sales Footprint
24.8.5. Channel Footprint
24.8.5.1. Distributors List
24.8.5.2. Sales Channel (Clients)
24.8.6. Strategy Overview
24.8.6.1. Marketing Strategy
24.8.6.2. Culture Strategy
24.8.6.3. Channel Strategy
24.8.7. SWOT Analysis
24.8.8. Financial Analysis
24.8.9. Revenue Share
24.8.9.1. By Product Ingredient
24.8.9.2. By Region
24.8.10. Key Clients
24.8.11. Analyst Comments
24.9. Algaecytes Limited
24.9.1. Key Inclusions In Company Profiles
24.9.2. Overview
24.9.3. Product Portfolio
24.9.4. Sales Footprint
24.9.5. Channel Footprint
24.9.5.1. Distributors List
24.9.5.2. Sales Channel (Clients)
24.9.6. Strategy Overview
24.9.6.1. Marketing Strategy
24.9.6.2. Culture Strategy
24.9.6.3. Channel Strategy
24.9.7. SWOT Analysis
24.9.8. Financial Analysis
24.9.9. Revenue Share
24.9.9.1. By Product Ingredient
24.9.9.2. By Region
24.9.10. Key Clients
24.9.11. Analyst Comments
24.10. ALGISYS, LLC
24.10.1. Key Inclusions In Company Profiles
24.10.2. Overview
24.10.3. Product Portfolio
24.10.4. Sales Footprint
24.10.5. Channel Footprint
24.10.5.1. Distributors List
24.10.5.2. Sales Channel (Clients)
24.10.6. Strategy Overview
24.10.6.1. Marketing Strategy
24.10.6.2. Culture Strategy
24.10.6.3. Channel Strategy
24.10.7. SWOT Analysis
24.10.8. Financial Analysis
24.10.9. Revenue Share
24.10.9.1. By Product Ingredient
24.10.9.2. By Region
24.10.10. Key Clients
24.10.11. Analyst Comments
24.11. Cellana Inc.
24.11.1. Key Inclusions In Company Profiles
24.11.2. Overview
24.11.3. Product Portfolio
24.11.4. Sales Footprint
24.11.5. Channel Footprint
24.11.5.1. Distributors List
24.11.5.2. Sales Channel (Clients)
24.11.6. Strategy Overview
24.11.6.1. Marketing Strategy
24.11.6.2. Culture Strategy
24.11.6.3. Channel Strategy
24.11.7. SWOT Analysis
24.11.8. Financial Analysis
24.11.9. Revenue Share
24.11.9.1. By Product Ingredient
24.11.9.2. By Region
24.11.10. Key Clients
24.11.11. Analyst Comments
24.12. Koninklijke DSM N.V.
24.12.1. Key Inclusions In Company Profiles
24.12.2. Overview
24.12.3. Product Portfolio
24.12.4. Sales Footprint
24.12.5. Channel Footprint
24.12.5.1. Distributors List
24.12.5.2. Sales Channel (Clients)
24.12.6. Strategy Overview
24.12.6.1. Marketing Strategy
24.12.6.2. Culture Strategy
24.12.6.3. Channel Strategy
24.12.7. SWOT Analysis
24.12.8. Financial Analysis
24.12.9. Revenue Share
24.12.9.1. By Product Ingredient
24.12.9.2. By Region
24.12.10. Key Clients
24.12.11. Analyst Comments
24.13. Cargill Incorporated
24.13.1. Key Inclusions In Company Profiles
24.13.2. Overview
24.13.3. Product Portfolio
24.13.4. Sales Footprint
24.13.5. Channel Footprint
24.13.5.1. Distributors List
24.13.5.2. Sales Channel (Clients)
24.13.6. Strategy Overview
24.13.6.1. Marketing Strategy
24.13.6.2. Culture Strategy
24.13.6.3. Channel Strategy
24.13.7. SWOT Analysis
24.13.8. Financial Analysis
24.13.9. Revenue Share
24.13.9.1. By Product Ingredient
24.13.9.2. By Region
24.13.10. Key Clients
24.13.11. Analyst Comments
24.14. Others (On Request)
25. Recommendation- Critical Success Factors
26. Research Methodology, Assumptions & Acronyms Used
List of Tables
Table 1: Global Fish Free Omega 3 Ingredients Market Value (US$ Mn) Analysis and Forecast by Region, 2019-2029
Table 2: Global Fish Free Omega 3 Ingredients Market Volume (MT) Analysis and Forecast by Region, 2019-2029
Table 3: Global Fish Free Omega 3 Ingredients Market Value (US$ Mn) Analysis and Forecast by Product Type, 2019-2029
Table 4: Global Fish Free Omega 3 Ingredients Market Volume (MT) Analysis and Forecast by Product Type, 2019-2029
Table 5: Global Fish Free Omega 3 Ingredients Market Value (US$ Mn) Analysis and Forecast by Nature, 2019-2029
Table 6: Global Fish Free Omega 3 Ingredients Market Volume (MT) Analysis and Forecast by Nature, 2019-2029
Table 7: Global Fish Free Omega 3 Ingredients Market Value (US$ Mn) Analysis and Forecast by Animal Type 2019-2029
Table 8: Global Fish Free Omega 3 Ingredients Market Volume (MT) Analysis and Forecast by Animal Type, 2019-2029
Table 9: North America Fish Free Omega 3 Ingredients Market Value (US$ Mn) Analysis and Forecast by Country, 2019-2029
Table 10: North America Fish Free Omega 3 Ingredients Market Volume (MT) Analysis and Forecast by Country, 2019-2029
Table 11: North America Fish Free Omega 3 Ingredients Market Value (US$ Mn) Analysis and Forecast by Product Type, 2019-2029
Table 12: North America Fish Free Omega 3 Ingredients Market Volume (MT) Analysis and Forecast by Product Type, 2019-2029
Table 13: North America Fish Free Omega 3 Ingredients Market Value (US$) Analysis and Forecast by Nature, 2019-2029
Table 14: North America Fish Free Omega 3 Ingredients Market Volume (MT) Analysis and Forecast by Nature, 2019-2029
Table 15: North America Fish Free Omega 3 Ingredients Market Value (US$ Mn) Analysis and Forecast by Animal Type, 2019-2029
Table 16: North America Fish Free Omega 3 Ingredients Market Volume (MT) Analysis and Forecast by Animal Type, 2019-2029
Table 17: Latin America Fish Free Omega 3 Ingredients Market Value (US$ Mn) Analysis and Forecast by Country, 2019-2029
Table 18: Latin America Fish Free Omega 3 Ingredients Market Volume (MT) Analysis and Forecast by Country, 2019-2029
Table 19: Latin America Fish Free Omega 3 Ingredients Market Value (US$ Mn) Analysis and Forecast by Product Type, 2019-2029
Table 20: Latin America Fish Free Omega 3 Ingredients Market Volume (MT) Analysis and Forecast by Product Type, 2019-2029
Table 21: Latin America Fish Free Omega 3 Ingredients Market Value (US$) Analysis and Forecast by Nature, 2019-2029
Table 22: Latin America Fish Free Omega 3 Ingredients Market Volume (MT) Analysis and Forecast by Nature, 2019-2029
Table 23: Latin America Fish Free Omega 3 Ingredients Market Value (US$ Mn) Analysis and Forecast by Animal Type, 2019-2029
Table 23: Latin America Fish Free Omega 3 Ingredients Market Volume (MT) Analysis and Forecast by Animal Type, 2019-2029
Table 24: Europe Fish Free Omega 3 Ingredients Market Value (US$ Mn) Analysis and Forecast by Country, 2019-2029
Table 25: Europe Fish Free Omega 3 Ingredients Market Volume (MT) Analysis and Forecast by Country, 2019-2029
Table 26: Europe Fish Free Omega 3 Ingredients Market Value (US$ Mn) Analysis and Forecast by Product Type, 2019-2029
Table 27: Europe Fish Free Omega 3 Ingredients Market Volume (MT) Analysis and Forecast by Product Type, 2019-2029
Table 28: Europe Fish Free Omega 3 Ingredients Market Value (US$) Analysis and Forecast by Nature, 2019-2029
Table 29: Europe Fish Free Omega 3 Ingredients Market Volume (MT) Analysis and Forecast by Nature, 2019-2029
Table 30: Europe Fish Free Omega 3 Ingredients Market Value (US$ Mn) Analysis and Forecast by Animal Type, 2019-2029
Table 31: Europe Fish Free Omega 3 Ingredients Market Volume (MT) Analysis and Forecast by Animal Type, 2019-2029
Table 32: APEJ Fish Free Omega 3 Ingredients Market Value (US$ Mn) Analysis and Forecast by Country, 2019-2029
Table 33: APEJ Fish Free Omega 3 Ingredients Market Volume (MT) Analysis and Forecast by Country, 2019-2029
Table 34: APEJ Fish Free Omega 3 Ingredients Market Value (US$ Mn) Analysis and Forecast by Product Type, 2019-2029
Table 35: APEJ Fish Free Omega 3 Ingredients Market Volume (MT) Analysis and Forecast by Product Type, 2019-2029
Table 36: APEJ Fish Free Omega 3 Ingredients Market Value (US$) Analysis and Forecast by Nature, 2019-2029
Table 37: APEJ Fish Free Omega 3 Ingredients Market Volume (MT) Analysis and Forecast by Nature, 2019-2029
Table 38: APEJ Fish Free Omega 3 Ingredients Market Value (US$ Mn) Analysis and Forecast by Animal Type, 2019-2029
Table 39: APEJ Fish Free Omega 3 Ingredients Market Volume (MT) Analysis and Forecast by Animal Type, 2019-2029
Table 40: MEA Fish Free Omega 3 Ingredients Market Value (US$ Mn) Analysis and Forecast by Country, 2019-2029
Table 41: MEA Fish Free Omega 3 Ingredients Market Volume (MT) Analysis and Forecast by Country, 2019-2029
Table 42: MEA Fish Free Omega 3 Ingredients Market Value (US$ Mn) Analysis and Forecast by Product Type, 2019-2029
Table 43: MEA Fish Free Omega 3 Ingredients Market Volume (MT) Analysis and Forecast by Product Type, 2019-2029
Table 44: MEA Fish Free Omega 3 Ingredients Market Value (US$) Analysis and Forecast by Nature, 2019-2029
Table 45: MEA Fish Free Omega 3 Ingredients Market Volume (MT) Analysis and Forecast by Nature, 2019-2029
Table 46: MEA Fish Free Omega 3 Ingredients Market Value (US$ Mn) Analysis and Forecast by Animal Type, 2019-2029
Table 47: MEA Fish Free Omega 3 Ingredients Market Volume (MT) Analysis and Forecast by Animal Type, 2019-2029
Table 48: Oceania Fish Free Omega 3 Ingredients Market Volume (MT) Analysis and Forecast by Product Type, 2019-2029
Table 49: Oceania Fish Free Omega 3 Ingredients Market Value (US$) Analysis and Forecast by Nature, 2019-2029
Table 50: Oceania Fish Free Omega 3 Ingredients Market Volume (MT) Analysis and Forecast by Nature, 2019-2029
Table 51: Oceania Fish Free Omega 3 Ingredients Market Value (US$ Mn) Analysis and Forecast by Animal Type, 2019-2029
Table 52: Oceania Fish Free Omega 3 Ingredients Market Volume (MT) Analysis and Forecast by Animal Type, 2019-2029
Table 53: Japan Fish Free Omega 3 Ingredients Market Value (US$ Mn) Analysis and Forecast by Product Type, 2019-2029
Table 54: Japan Fish Free Omega 3 Ingredients Market Volume (MT) Analysis and Forecast by Product Type, 2019-2029
Table 55: Japan Fish Free Omega 3 Ingredients Market Value (US$) Analysis and Forecast by Nature, 2019-2029
Table 56: Japan Fish Free Omega 3 Ingredients Market Volume (MT) Analysis and Forecast by Nature, 2019-2029
Table 57: Japan Fish Free Omega 3 Ingredients Market Value (US$ Mn) Analysis and Forecast by Animal Type, 2019-2029
Table 58: Japan Fish Free Omega 3 Ingredients Market Volume (MT) Analysis and Forecast by Animal Type, 2019-2029
List of Figures
Figure 1: Global Fish Free Omega 3 Ingredients Market Value (US$ Mn) and Volume (MT) Forecast, 2019-2029
Figure 2: Global Fish Free Omega 3 Ingredients Market Absolute $ Opportunity (US$ Mn), 2019-2029
Figure 3: Global Fish Free Omega 3 Ingredients Market Share (%) & BPS Analysis by Region, 2019 & 2029
Figure 4: Global Fish Free Omega 3 Ingredients Market Y-o-Y Growth Rate (%) by Region, 2019 - 2029
Figure 5: Global Fish Free Omega 3 Ingredients Market Value (US$ Mn) Analysis & Forecast by Region, 2019-2029
Figure 6: Global Fish Free Omega 3 Ingredients Market Attractiveness Index by Region, 2019 - 2029
Figure 7: Global Fish Free Omega 3 Ingredients Market Share (%) & BPS Analysis by Product Type, 2019 & 2029
Figure 8: Global Fish Free Omega 3 Ingredients Market Y-o-Y Growth Rate (%) by Product Type, 2019 - 2029
Figure 9: Global Fish Free Omega 3 Ingredients Market Value (US$ Mn) Analysis & Forecast by Product Type, 2019-2029
Figure 10: Global Fish Free Omega 3 Ingredients Market Attractiveness Index by Product Type, 2019 - 2029
Figure 11: Global Fish Free Omega 3 Ingredients Market Share (%) & BPS Analysis by Nature, 2019 & 2029
Figure 12: Global Fish Free Omega 3 Ingredients Market Y-o-Y Growth Rate (%) by Nature, 2019 - 2029
Figure 13: Global Fish Free Omega 3 Ingredients Market Value (US$ Mn) Analysis & Forecast by Nature, 2019-2029
Figure 14: Global Fish Free Omega 3 Ingredients Market Attractiveness Index by Nature, 2019 - 2029
Figure 15: Global Fish Free Omega 3 Ingredients Market Share (%) & BPS Analysis by Animal Type, 2019 & 2029
Figure 16: Global Fish Free Omega 3 Ingredients Market Y-o-Y Growth Rate (%) by Animal Type, 2019 - 2029
Figure 17: Global Fish Free Omega 3 Ingredients Market Value (US$ Mn) Analysis & Forecast by Animal Type, 2019-2029
Figure 18: Global Fish Free Omega 3 Ingredients Market Attractiveness Index by Animal Type, 2019 - 2029
Figure 19: North America Fish Free Omega 3 Ingredients Market Share (%) & BPS Analysis by Country, 2019 & 2029
Figure 20: North America Fish Free Omega 3 Ingredients Market Y-o-Y Growth Rate (%) by Country, 2019 - 2029
Figure 21: North America Fish Free Omega 3 Ingredients Market Attractiveness Index by Country, 2019 - 2029
Figure 22: North America Fish Free Omega 3 Ingredients Market Share (%) & BPS Analysis by Product Type, 2019 & 2029
Figure 23: North America Fish Free Omega 3 Ingredients Market Y-o-Y Growth Rate (%) by Product Type, 2019 - 2029
Figure 24: North America Fish Free Omega 3 Ingredients Market Attractiveness Index by Product Type, 2019 - 2029
Figure 25: North America Fish Free Omega 3 Ingredients Market Share (%) & BPS Analysis by Nature, 2019 & 2029
Figure 26: North America Fish Free Omega 3 Ingredients Market Y-o-Y Growth Rate (%) by Nature, 2019 - 2029
Figure 27: North America Fish Free Omega 3 Ingredients Market Attractiveness Index by Nature, 2019 - 2029
Figure 28: North America Fish Free Omega 3 Ingredients Market Share (%) & BPS Analysis by Animal Type, 2019 & 2029
Figure 29: North America Fish Free Omega 3 Ingredients Market Y-o-Y Growth Rate (%) by Animal Type, 2019 - 2029
Figure 30: North America Fish Free Omega 3 Ingredients Market Attractiveness Index by Animal Type, 2019 - 2029
Figure 31: Latin America Fish Free Omega 3 Ingredients Market Share (%) & BPS Analysis by Country, 2019 & 2029
Figure 32: Latin America Fish Free Omega 3 Ingredients Market Y-o-Y Growth Rate (%) by Country, 2019 - 2029
Figure 33: Latin America Fish Free Omega 3 Ingredients Market Attractiveness Index by Country, 2019 - 2029
Figure 34: Latin America Fish Free Omega 3 Ingredients Market Share (%) & BPS Analysis by Product Type, 2019 & 2029
Figure 35: Latin America Fish Free Omega 3 Ingredients Market Y-o-Y Growth Rate (%) by Product Type, 2019 - 2029
Figure 36: Latin America Fish Free Omega 3 Ingredients Market Attractiveness Index by Product Type, 2019 - 2029
Figure 37: Latin America Fish Free Omega 3 Ingredients Market Share (%) & BPS Analysis by Nature, 2019 & 2029
Figure 38: Latin America Fish Free Omega 3 Ingredients Market Y-o-Y Growth Rate (%) by Nature, 2019 - 2029
Figure 39: Latin America Fish Free Omega 3 Ingredients Market Attractiveness Index by Nature, 2019 - 2029
Figure 40: Latin America Fish Free Omega 3 Ingredients Market Share (%) & BPS Analysis by Animal Type, 2019 & 2029
Figure 41: Latin America Fish Free Omega 3 Ingredients Market Y-o-Y Growth Rate (%) by Animal Type, 2019 - 2029
Figure 42: Latin America Fish Free Omega 3 Ingredients Market Attractiveness Index by Animal Type, 2019 - 2029
Figure 43: Europe Fish Free Omega 3 Ingredients Market Share (%) & BPS Analysis by Country, 2019 & 2029
Figure 44: Europe Fish Free Omega 3 Ingredients Market Y-o-Y Growth Rate (%) by Country, 2019 - 2029
Figure 45: Europe Fish Free Omega 3 Ingredients Market Attractiveness Index by Country, 2019 - 2029
Figure 46: Europe Fish Free Omega 3 Ingredients Market Share (%) & BPS Analysis by Product Type, 2019 & 2029
Figure 47: Europe Fish Free Omega 3 Ingredients Market Y-o-Y Growth Rate (%) by Product Type, 2019 - 2029
Figure 48: Europe Fish Free Omega 3 Ingredients Market Attractiveness Index by Product Type, 2019 - 2029
Figure 49: Europe Fish Free Omega 3 Ingredients Market Share (%) & BPS Analysis by Nature, 2019 & 2029
Figure 50: Europe Fish Free Omega 3 Ingredients Market Y-o-Y Growth Rate (%) by Nature, 2019 - 2029
Figure 51: Europe Fish Free Omega 3 Ingredients Market Attractiveness Index by Nature, 2019 - 2029
Figure 52: Europe Fish Free Omega 3 Ingredients Market Share (%) & BPS Analysis by Animal Type, 2019 & 2029
Figure 53: Europe Fish Free Omega 3 Ingredients Market Y-o-Y Growth Rate (%) by Animal Type, 2019 - 2029
Figure 54: Europe Fish Free Omega 3 Ingredients Market Attractiveness Index by Animal Type, 2019 - 2029
Figure 55: APEJ Fish Free Omega 3 Ingredients Market Share (%) & BPS Analysis by Country, 2019 & 2029
Figure 56: APEJ Fish Free Omega 3 Ingredients Market Y-o-Y Growth Rate (%) by Country, 2019 - 2029
Figure 57: APEJ Fish Free Omega 3 Ingredients Market Attractiveness Index by Country, 2019 - 2029
Figure 58: APEJ Fish Free Omega 3 Ingredients Market Share (%) & BPS Analysis by Product Type, 2019 & 2029
Figure 59: APEJ Fish Free Omega 3 Ingredients Market Y-o-Y Growth Rate (%) by Product Type, 2019 - 2029
Figure 60: APEJ Fish Free Omega 3 Ingredients Market Attractiveness Index by Product Type, 2019 - 2029
Figure 61: APEJ Fish Free Omega 3 Ingredients Market Share (%) & BPS Analysis by Nature, 2019 & 2029
Figure 62: APEJ Fish Free Omega 3 Ingredients Market Y-o-Y Growth Rate (%) by Nature, 2019 - 2029
Figure 63: APEJ Fish Free Omega 3 Ingredients Market Attractiveness Index by Nature, 2019 - 2029
Figure 64: APEJ Fish Free Omega 3 Ingredients Market Share (%) & BPS Analysis by Animal Type, 2019 & 2029
Figure 65: APEJ Fish Free Omega 3 Ingredients Market Y-o-Y Growth Rate (%) by Animal Type, 2019 - 2029
Figure 66: APEJ Fish Free Omega 3 Ingredients Market Attractiveness Index by Animal Type, 2019 - 2029
Figure 67: MEA Fish Free Omega 3 Ingredients Market Share (%) & BPS Analysis by Country, 2019 & 2029
Figure 68: MEA Fish Free Omega 3 Ingredients Market Y-o-Y Growth Rate (%) by Country, 2019 - 2029
Figure 69: MEA Fish Free Omega 3 Ingredients Market Attractiveness Index by Country, 2019 - 2029
Figure 70: MEA Fish Free Omega 3 Ingredients Market Share (%) & BPS Analysis by Product Type, 2019 & 2029
Figure 71: MEA Fish Free Omega 3 Ingredients Market Y-o-Y Growth Rate (%) by Product Type, 2019 - 2029
Figure 72: MEA Fish Free Omega 3 Ingredients Market Attractiveness Index by Product Type, 2019 - 2029
Figure 73: MEA Fish Free Omega 3 Ingredients Market Share (%) & BPS Analysis by Nature, 2019 & 2029
Figure 74: MEA Fish Free Omega 3 Ingredients Market Y-o-Y Growth Rate (%) by Nature, 2019 - 2029
Figure 75: MEA Fish Free Omega 3 Ingredients Market Attractiveness Index by Nature, 2019 - 2029
Figure 76: MEA Fish Free Omega 3 Ingredients Market Share (%) & BPS Analysis by Animal Type, 2019 & 2029
Figure 77: MEA Fish Free Omega 3 Ingredients Market Y-o-Y Growth Rate (%) by Animal Type, 2019 - 2029
Figure 78: MEA Fish Free Omega 3 Ingredients Market Attractiveness Index by Animal Type, 2019 - 2029
Figure 79: MEA Fish Free Omega 3 Ingredients Market Share (%) & BPS Analysis by Formulation, 2019 & 2029
Figure 80: MEA Fish Free Omega 3 Ingredients Market Y-o-Y Growth Rate (%) by Formulation, 2019 - 2029
Figure 81: MEA Fish Free Omega 3 Ingredients Market Attractiveness Index by Formulation, 2019 - 2029
Figure 82: MEA Fish Free Omega 3 Ingredients Market Share (%) & BPS Analysis by Distribution Channel, 2019 & 2029
Figure 83: MEA Fish Free Omega 3 Ingredients Market Y-o-Y Growth Rate (%) by Distribution Channel, 2019 - 2029
Figure 84: MEA Fish Free Omega 3 Ingredients Market Attractiveness Index by Distribution Channel, 2019 - 2029
Figure 85: Oceania Fish Free Omega 3 Ingredients Market Share (%) & BPS Analysis by Product Type, 2019 & 2029
Figure 86: Oceania Fish Free Omega 3 Ingredients Market Y-o-Y Growth Rate (%) by Product Type, 2019 - 2029
Figure 87: Oceania Fish Free Omega 3 Ingredients Market Attractiveness Index by Product Type, 2019 - 2029
Figure 88: Oceania Fish Free Omega 3 Ingredients Market Share (%) & BPS Analysis by Nature, 2019 & 2029
Figure 89: Oceania Fish Free Omega 3 Ingredients Market Y-o-Y Growth Rate (%) by Nature, 2019 - 2029
Figure 90: Oceania Fish Free Omega 3 Ingredients Market Attractiveness Index by Nature, 2019 - 2029
Figure 91: Oceania Fish Free Omega 3 Ingredients Market Share (%) & BPS Analysis by Animal Type, 2019 & 2029
Figure 92: Oceania Fish Free Omega 3 Ingredients Market Y-o-Y Growth Rate (%) by Animal Type, 2019 - 2029
Figure 93: Oceania Fish Free Omega 3 Ingredients Market Attractiveness Index by Animal Type, 2019 - 2029
Figure 94: Japan Fish Free Omega 3 Ingredients Market Share (%) & BPS Analysis by Product Type, 2019 & 2029
Figure 95: Japan Fish Free Omega 3 Ingredients Market Y-o-Y Growth Rate (%) by Product Type, 2019 - 2029
Figure 96: Japan Fish Free Omega 3 Ingredients Market Attractiveness Index by Product Type, 2019 - 2029
Figure 97: Japan Fish Free Omega 3 Ingredients Market Share (%) & BPS Analysis by Nature, 2019 & 2029
Figure 98: Japan Fish Free Omega 3 Ingredients Market Y-o-Y Growth Rate (%) by Nature, 2019 - 2029
Figure 99: Japan Fish Free Omega 3 Ingredients Market Attractiveness Index by Nature, 2019 - 2029
Figure 100: Japan Fish Free Omega 3 Ingredients Market Share (%) & BPS Analysis by Animal Type, 2019 & 2029
Figure 101: Japan Fish Free Omega 3 Ingredients Market Y-o-Y Growth Rate (%) by Animal Type, 2019 - 2029
Figure 102: Japan Fish Free Omega 3 Ingredients Market Attractiveness Index by Animal Type, 2019 - 2029
Copyright © Transparency Market Research, Inc. All Rights reserved
Trust Online

Fish-free Omega-3 Ingredients Market