
Reports
Reports
Analysts’ Viewpoint on First and Last Mile Delivery Market Scenario
Rapid urbanization, rise in global population, increase in penetration of digitalization in the retail industry, and changing consumer preference toward online shopping are some of the factors that are projected to drive first and last mile delivery market in the next few years. Furthermore, growing strategic partnerships and collaborative agreements among third-party logistics and technology service providers to offer improved delivery solutions have also propelled the first and last mile delivery market share. Additionally, increased government support by offering certain schemes, such as the production-linked incentive (PLI) schemes, to enhance the export of a company, fuels the first and last mile delivery market.
First mile delivery is defined as the transportation of goods from the warehouse or premises to different hubs, from where it is further forwarded to several suppliers, retailers, and others. However, for the last mile, the goods travel to their last destination in the supply chain, from warehouses or suppliers or retailers to the doorstep of the customers. For instance, in the case of automotive manufacturers, the first mile means transportation of vehicles and their related components to the vehicle assembly companies and further to the vehicle distribution centers such as brand showrooms and service providers. However, for the last mile, these vehicles are supplied to end-users or customers from the showrooms.
Moreover, in the case of e-commerce companies, the first-mile delivery is considered as a process, where the goods are picked from a retailer and then further transferred to courier service providers or third-party logistics providers. Once the goods are received at a warehouse or courier service provider, then they can be delivered to end consumers. Additionally, top last mile delivery companies are investing significantly to develop last mile delivery solutions. Digitalization in the retail industry, rise in adoption of e-commerce platforms, and increase in preference for online shopping among consumers are some of the factors that are expected to drive the first and last mile delivery market. Likewise, advancements in delivery services such as artificial intelligence, robotics, and drones for the development of warehouse automation and first and last mile logistics, are expected to boost the first and last mile delivery market size during the forecast period.
Rise in population across the globe drives the supply and consumption of goods, majorly food and other basic requirements. Governments and private organizations across the world are funding transportation companies in order to fulfill the requirements and for on-time delivery of the goods. However, such increase in funding and transportation advancement offer an opportunity for the logistics industry to improve their first and last mile delivery solutions. Currently, countries are shifting towards greener and sustainable solutions for transport, which can help economies to be more safe and healthy. Moreover, economic expansion in most of the developed and developing countries has also increased commodities transport volumes from one place to another. Such factors are expected to boost the first and last mile delivery market share.
Consumers across the globe are shifting their preference from traditional shopping from stores toward online or e-commerce platforms, which changes the focus of delivery companies for their commodity delivery to end customers. Such a shift in consumer preference prompts companies to enhance their last mile delivery services in order to gain a competitive advantage in the market. However, the need for middle mile logistics has decreased due to technology integration, i.e. delivery of goods from the distribution center or a warehouse to several facilities from where products are purchased by consumers. Furthermore, technological solutions enhance the supply chain management processes, as process automation can increase product delivery. Moreover, service providers are using smart technology, sensors, cameras, and an omnichannel ecosystem to automate their warehouse and logistics process, which further decreases the delivery time and cost. The omnichannel ecosystem can track from product order to the delivery process, which improves delivery efficiency. Therefore, technology integration in logistics is expected to propel the first and last mile delivery market during the forecast period.
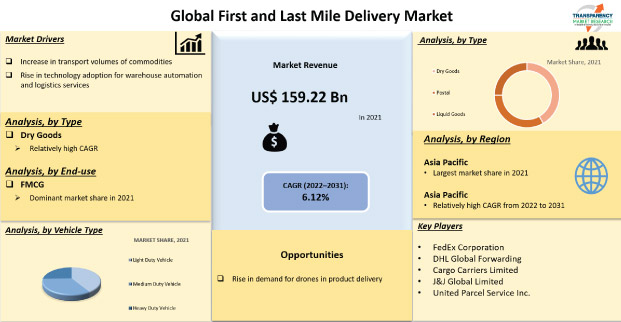
In terms of end-use, the first and last mile delivery market has been classified into chemical, FMCG, pharmaceutical and healthcare, food and beverage, hi-tech product industry, and others. The FMCG segment held a dominant share of the first and last mile delivery market in 2021, owing to increased disposable income, rise in digital connectivity in rural as well as urban areas, and increase in demand for FMCG products via e-commerce portals. Furthermore, the first and last mile delivery market is expected to witness substantial contribution from the food & beverage sector, due to increase in population, rapid urbanization, and rise in food consumption across the globe.
In terms of vehicle type, the global first and last mile delivery market has been split into light duty vehicle, medium duty vehicle, and heavy duty vehicle. The first and last mile delivery market share held by the light duty vehicle segment is expected to rise, as the sales of light commercial vehicle is high and it can carry the FMCG products and food & beverage products with ease. Light duty vehicles can deliver the product at every doorstep and takes less time for delivery, due to small vehicle size.
Asia Pacific holds a dominant share of the global first and last mile delivery market. Population growth; increase in commodity requirements; presence of third-party logistics (3PL) service providers who offer first and last mile deliveries; and a surge in trend of online shopping are some of the major factors boosting the market in Asia Pacific.
Several software companies in Asia Pacific are developing first mile logistics software that can manage and control first-mile delivery operations with no manual intervention and complete visibility, thereby further increasing customer convenience for production orders. The large population in Asia Pacific provides a huge consumer base for growth of the online retail industry, which further boosts transportation services that are involved in first and last mile delivery. Furthermore, small and emerging players in the region provide local delivery services from different storage hubs to the doorsteps of consumers. Additionally, Europe is expected to hold a significant share of the first and last mile delivery market, due to an increase in usage of advanced technology services and higher per capita income in the region.
The global first and last mile delivery market is consolidated with a small number of large-scale vendors that control a majority of the market share. Expansion of product portfolios and mergers and acquisitions are major strategies adopted by key players. Major companies in the first and last mile delivery market are creating continuous changes in their services owing to a rise in adoption of advanced logistics solutions. Some of the first and last mile delivery companies that are identified in the global market are FedEx Corporation, DHL Global Forwarding, Cargo Carriers Limited, J&J Global Limited, United Parcel Service Inc., Concargo Private Limited, Interlogix Pty. Ltd., Tuma Transport, TNT Express, Transtech Logistics, DB SCHENKER, Swift Transport, Kerry Logistics Network Limited, and Procet Freight.
Each of these players has been profiled in the first and last mile delivery market report based on parameters such as company overview, financial overview, business strategies, product portfolio, business segments, and recent developments.
|
Attribute |
Detail |
|
Market Size Value in 2021 |
US$ 159.22 Bn |
|
Market Forecast Value in 2031 |
US$ 288.38 Bn |
|
Growth Rate (CAGR) |
6.12% |
|
Forecast Period |
2022–2031 |
|
Historical Data Available for |
2017–2021 |
|
Quantitative Units |
US$ Bn for Value and Thousand Units for Volume |
|
Market Analysis |
It includes cross segment analysis at global as well as regional level. Furthermore, qualitative analysis includes drivers, restraints, opportunities, key trends, Porter’s Five Forces analysis, value chain analysis, and key trend analysis. |
|
Competition Landscape |
|
|
Format |
Electronic (PDF) + Excel |
|
Market Segmentation |
|
|
Regions Covered |
|
|
Countries Covered |
|
|
Companies Profiled |
|
|
Customization Scope |
Available upon request |
|
Pricing |
Available upon request |
The first and last mile delivery market was valued at US$ 159.22 Bn in 2021.
The first and last mile delivery market is expected to grow at a CAGR of 6.12% by 2031.
The first and last mile delivery market is expected to reach US$ 288.38 Bn in 2031.
Rise in transport volume and commodities across the globe and increase in adoption of technology for warehouse automation and logistics services.
The dry goods segment accounted for 43.6% share of the first and last mile delivery market.
Asia Pacific is a highly lucrative region of the global first and last mile delivery market.
FedEx Corporation, DHL Global Forwarding, Cargo Carriers Limited, J&J Global Limited, United Parcel Service Inc., Concargo Private Limited, Interlogix Pty. Ltd., Tuma Transport, TNT Express, Transtech Logistics, DB SCHENKER, Swift Transport, Kerry Logistics Network Limited, and Procet Freight.
1. Preface
1.1. About TMR
1.2. Market Coverage / Taxonomy
1.3. Assumptions and Research Methodology
2. Executive Summary
2.1. Global Market Outlook
2.1.1. Market Size, Units, US$ Bn, 2017-2031
2.2. Demand & Supply Side Trends
2.3. TMR Analysis and Recommendations
2.4. Competitive Dashboard Analysis
3. Market Overview
3.1. Macro-Economic Factors
3.2. Market Dynamics
3.2.1. Drivers
3.2.2. Restraints
3.2.3. Opportunity
3.3. Market Factor Analysis
3.3.1. Porter’s Five Force Analysis
3.3.2. SWOT Analysis
3.4. Regulatory Scenario
3.5. Key Trend Analysis
3.6. Value Chain Analysis
3.7. Cost Structure Analysis
3.8. Profit Margin Analysis
4. COVID-19 Impact Analysis – First and Last Mile Delivery Market
5. Global First and Last Mile Delivery Market, by Type
5.1. Market Snapshot
5.1.1. Introduction, Definition, and Key Findings
5.1.2. Market Growth & Y-o-Y Projections
5.1.3. Base Point Share Analysis
5.2. Global First and Last Mile Delivery Market Value (US$ Bn) & Volume (Thousand Units) Analysis & Forecast, by Type, 2017-2031
5.2.1. Dry Goods
5.2.2. Postal
5.2.3. Liquid Goods
6. Global First and Last Mile Delivery Market, by Vehicle Type
6.1. Market Snapshot
6.1.1. Introduction, Definition, and Key Findings
6.1.2. Market Growth & Y-o-Y Projections
6.1.3. Base Point Share Analysis
6.2. Global First and Last Mile Delivery Market Value (US$ Bn) & Volume (Thousand Units) Analysis & Forecast, by Vehicle Type, 2017-2031
6.2.1. Light Duty Vehicle
6.2.2. Medium Duty Vehicle
6.2.3. Heavy Duty Vehicle
7. Global First and Last Mile Delivery Market, by End-use
7.1. Market Snapshot
7.1.1. Introduction, Definition, and Key Findings
7.1.2. Market Growth & Y-o-Y Projections
7.1.3. Base Point Share Analysis
7.2. Global First and Last Mile Delivery Market Value (US$ Bn) & Volume (Thousand Units) Analysis & Forecast, by End-use, 2017-2031
7.2.1. Chemical
7.2.2. Pharmaceutical and Healthcare
7.2.3. FMCG
7.2.4. Hi-tech Product Industry
7.2.5. Food and Beverage
7.2.6. Others
8. Global First and Last Mile Delivery Market, by Region
8.1. Market Snapshot
8.1.1. Introduction, Definition, and Key Findings
8.1.2. Market Growth & Y-o-Y Projections
8.1.3. Base Point Share Analysis
8.2. Global First and Last Mile Delivery Market Value (US$ Bn) & Volume (Thousand Units) Analysis & Forecast, by Region, 2017-2031
8.2.1. North America
8.2.2. Europe
8.2.3. Asia Pacific
8.2.4. Middle East & Africa
8.2.5. South America
9. North America First and Last Mile Delivery Market
9.1. Market Snapshot
9.2. First and Last Mile Delivery Market Value (US$ Bn) & Volume (Thousand Units) Analysis & Forecast, by Type, 2017-2031
9.2.1. Dry Goods
9.2.2. Postal
9.2.3. Liquid Goods
9.3. First and Last Mile Delivery Market Value (US$ Bn) & Volume (Thousand Units) Analysis & Forecast, by Vehicle Type, 2017-2031
9.3.1. Light Duty Vehicle
9.3.2. Medium Duty Vehicle
9.3.3. Heavy Duty Vehicle
9.4. First and Last Mile Delivery Market Value (US$ Bn) & Volume (Thousand Units) Analysis & Forecast, by End-use, 2017-2031
9.4.1. Chemical
9.4.2. Pharmaceutical and Healthcare
9.4.3. FMCG
9.4.4. Hi-tech Product Industry
9.4.5. Food and Beverage
9.4.6. Others
9.5. Key Country Analysis – North America First and Last Mile Delivery Market Value (US$ Bn) & Volume (Thousand Units) Analysis & Forecast, 2017-2031
9.5.1. The U. S.
9.5.2. Canada
9.5.3. Mexico
10. Europe First and Last Mile Delivery Market
10.1. Market Snapshot
10.2. First and Last Mile Delivery Market Value (US$ Bn) & Volume (Thousand Units) Analysis & Forecast, by Type, 2017-2031
10.2.1. Dry Goods
10.2.2. Postal
10.2.3. Liquid Goods
10.3. First and Last Mile Delivery Market Value (US$ Bn) & Volume (Thousand Units) Analysis & Forecast, by Vehicle Type, 2017-2031
10.3.1. Light Duty Vehicle
10.3.2. Medium Duty Vehicle
10.3.3. Heavy Duty Vehicle
10.4. First and Last Mile Delivery Market Value (US$ Bn) & Volume (Thousand Units) Analysis & Forecast, by End-use, 2017-2031
10.4.1. Chemical
10.4.2. Pharmaceutical and Healthcare
10.4.3. FMCG
10.4.4. Hi-tech Product Industry
10.4.5. Food and Beverage
10.4.6. Others
10.5. Key Country Analysis – Europe First and Last Mile Delivery Market Value (US$ Bn) & Volume (Thousand Units) Analysis & Forecast, 2017-2031
10.5.1. Germany
10.5.2. U. K.
10.5.3. France
10.5.4. Italy
10.5.5. Spain
10.5.6. Nordic Countries
10.5.7. Russia & CIS
10.5.8. Rest of Europe
11. Asia Pacific First and Last Mile Delivery Market
11.1. Market Snapshot
11.2. First and Last Mile Delivery Market Value (US$ Bn) & Volume (Thousand Units) Analysis & Forecast, by Type, 2017-2031
11.2.1. Dry Goods
11.2.2. Postal
11.2.3. Liquid Goods
11.3. First and Last Mile Delivery Market Value (US$ Bn) & Volume (Thousand Units) Analysis & Forecast, by Vehicle Type, 2017-2031
11.3.1. Light Duty Vehicle
11.3.2. Medium Duty Vehicle
11.3.3. Heavy Duty Vehicle
11.4. First and Last Mile Delivery Market Value (US$ Bn) & Volume (Thousand Units) Analysis & Forecast, by End-use, 2017-2031
11.4.1. Chemical
11.4.2. Pharmaceutical and Healthcare
11.4.3. FMCG
11.4.4. Hi-tech Product Industry
11.4.5. Food and Beverage
11.4.6. Others
11.5. Key Country Analysis – Asia Pacific First and Last Mile Delivery Market Value (US$ Bn) & Volume (Thousand Units) Analysis & Forecast, 2017-2031
11.5.1. China
11.5.2. India
11.5.3. Japan
11.5.4. ASEAN Countries
11.5.5. South Korea
11.5.6. ANZ
11.5.7. Rest of Asia Pacific
12. Middle East & Africa First and Last Mile Delivery Market
12.1. Market Snapshot
12.2. First and Last Mile Delivery Market Value (US$ Bn) & Volume (Thousand Units) Analysis & Forecast, by Type, 2017-2031
12.2.1. Dry Goods
12.2.2. Postal
12.2.3. Liquid Goods
12.3. First and Last Mile Delivery Market Value (US$ Bn) & Volume (Thousand Units) Analysis & Forecast, by Vehicle Type, 2017-2031
12.3.1. Light Duty Vehicle
12.3.2. Medium Duty Vehicle
12.3.3. Heavy Duty Vehicle
12.4. First and Last Mile Delivery Market Value (US$ Bn) & Volume (Thousand Units) Analysis & Forecast, by End-use, 2017-2031
12.4.1. Chemical
12.4.2. Pharmaceutical and Healthcare
12.4.3. FMCG
12.4.4. Hi-tech Product Industry
12.4.5. Food and Beverage
12.4.6. Others
12.5. Key Country Analysis – Middle East & Africa First and Last Mile Delivery Market Value (US$ Bn) & Volume (Thousand Units) Analysis & Forecast, 2017-2031
12.5.1. GCC
12.5.2. South Africa
12.5.3. Turkey
12.5.4. Rest of Middle East & Africa
13. South America First and Last Mile Delivery Market
13.1. Market Snapshot
13.2. First and Last Mile Delivery Market Value (US$ Bn) & Volume (Thousand Units) Analysis & Forecast, by Type, 2017-2031
13.2.1. Dry Goods
13.2.2. Postal
13.2.3. Liquid Goods
13.3. First and Last Mile Delivery Market Value (US$ Bn) & Volume (Thousand Units) Analysis & Forecast, by Vehicle Type, 2017-2031
13.3.1. Light Duty Vehicle
13.3.2. Medium Duty Vehicle
13.3.3. Heavy Duty Vehicle
13.4. First and Last Mile Delivery Market Value (US$ Bn) & Volume (Thousand Units) Analysis & Forecast, by End-use, 2017-2031
13.4.1. Chemical
13.4.2. Pharmaceutical and Healthcare
13.4.3. FMCG
13.4.4. Hi-tech Product Industry
13.4.5. Food and Beverage
13.4.6. Others
13.5. Key Country Analysis – South America First and Last Mile Delivery Market Value (US$ Bn) & Volume (Thousand Units) Analysis & Forecast, 2017-2031
13.5.1. Brazil
13.5.2. Argentina
13.5.3. Rest of South America
14. Competitive Landscape
14.1. Company Share Analysis/ Brand Share Analysis, 2020
14.2. Company Analysis for each player (Company Overview, Company Footprints, Production Locations, Product Portfolio, Competitors & Customers, Subsidiaries & Parent Organization, Recent Developments, Financial Analysis, Profitability, Revenue Share, Executive Bios)
14.3. Company Profile/ Key Players – First and Last Mile Delivery Market
14.3.1. FedEx Corporation
14.3.1.1. Company Overview
14.3.1.2. Company Footprints
14.3.1.3. Production Locations
14.3.1.4. Product Portfolio
14.3.1.5. Competitors & Customers
14.3.1.6. Subsidiaries & Parent Organization
14.3.1.7. Recent Developments
14.3.1.8. Financial Analysis
14.3.1.9. Profitability
14.3.1.10. Revenue Share
14.3.1.11. Executive Bios
14.3.2. DHL Global Forwarding
14.3.2.1. Company Overview
14.3.2.2. Company Footprints
14.3.2.3. Production Locations
14.3.2.4. Product Portfolio
14.3.2.5. Competitors & Customers
14.3.2.6. Subsidiaries & Parent Organization
14.3.2.7. Recent Developments
14.3.2.8. Financial Analysis
14.3.2.9. Profitability
14.3.2.10. Revenue Share
14.3.2.11. Executive Bios
14.3.3. Cargo Carriers Limited
14.3.3.1. Company Overview
14.3.3.2. Company Footprints
14.3.3.3. Production Locations
14.3.3.4. Product Portfolio
14.3.3.5. Competitors & Customers
14.3.3.6. Subsidiaries & Parent Organization
14.3.3.7. Recent Developments
14.3.3.8. Financial Analysis
14.3.3.9. Profitability
14.3.3.10. Revenue Share
14.3.3.11. Executive Bios
14.3.4. J&J Global Limited
14.3.4.1. Company Overview
14.3.4.2. Company Footprints
14.3.4.3. Production Locations
14.3.4.4. Product Portfolio
14.3.4.5. Competitors & Customers
14.3.4.6. Subsidiaries & Parent Organization
14.3.4.7. Recent Developments
14.3.4.8. Financial Analysis
14.3.4.9. Profitability
14.3.4.10. Revenue Share
14.3.4.11. Executive Bios
14.3.5. United Parcel Service Inc.
14.3.5.1. Company Overview
14.3.5.2. Company Footprints
14.3.5.3. Production Locations
14.3.5.4. Product Portfolio
14.3.5.5. Competitors & Customers
14.3.5.6. Subsidiaries & Parent Organization
14.3.5.7. Recent Developments
14.3.5.8. Financial Analysis
14.3.5.9. Profitability
14.3.5.10. Revenue Share
14.3.5.11. Executive Bios
14.3.6. Concargo Private Limited
14.3.6.1. Company Overview
14.3.6.2. Company Footprints
14.3.6.3. Production Locations
14.3.6.4. Product Portfolio
14.3.6.5. Competitors & Customers
14.3.6.6. Subsidiaries & Parent Organization
14.3.6.7. Recent Developments
14.3.6.8. Financial Analysis
14.3.6.9. Profitability
14.3.6.10. Revenue Share
14.3.6.11. Executive Bios
14.3.7. Interlogix Pty. Ltd.
14.3.7.1. Company Overview
14.3.7.2. Company Footprints
14.3.7.3. Production Locations
14.3.7.4. Product Portfolio
14.3.7.5. Competitors & Customers
14.3.7.6. Subsidiaries & Parent Organization
14.3.7.7. Recent Developments
14.3.7.8. Financial Analysis
14.3.7.9. Profitability
14.3.7.10. Revenue Share
14.3.7.11. Executive Bios
14.3.8. Tuma Transport
14.3.8.1. Company Overview
14.3.8.2. Company Footprints
14.3.8.3. Production Locations
14.3.8.4. Product Portfolio
14.3.8.5. Competitors & Customers
14.3.8.6. Subsidiaries & Parent Organization
14.3.8.7. Recent Developments
14.3.8.8. Financial Analysis
14.3.8.9. Profitability
14.3.8.10. Revenue Share
14.3.8.11. Executive Bios
14.3.9. TNT Express
14.3.9.1. Company Overview
14.3.9.2. Company Footprints
14.3.9.3. Production Locations
14.3.9.4. Product Portfolio
14.3.9.5. Competitors & Customers
14.3.9.6. Subsidiaries & Parent Organization
14.3.9.7. Recent Developments
14.3.9.8. Financial Analysis
14.3.9.9. Profitability
14.3.9.10. Revenue Share
14.3.9.11. Executive Bios
14.3.10. Transtech Logistics
14.3.10.1. Company Overview
14.3.10.2. Company Footprints
14.3.10.3. Production Locations
14.3.10.4. Product Portfolio
14.3.10.5. Competitors & Customers
14.3.10.6. Subsidiaries & Parent Organization
14.3.10.7. Recent Developments
14.3.10.8. Financial Analysis
14.3.10.9. Profitability
14.3.10.10. Revenue Share
14.3.10.11. Executive Bios
14.3.11. DB SCHENKER
14.3.11.1. Company Overview
14.3.11.2. Company Footprints
14.3.11.3. Production Locations
14.3.11.4. Product Portfolio
14.3.11.5. Competitors & Customers
14.3.11.6. Subsidiaries & Parent Organization
14.3.11.7. Recent Developments
14.3.11.8. Financial Analysis
14.3.11.9. Profitability
14.3.11.10. Revenue Share
14.3.11.11. Executive Bios
14.3.12. Swift Transport
14.3.12.1. Company Overview
14.3.12.2. Company Footprints
14.3.12.3. Production Locations
14.3.12.4. Product Portfolio
14.3.12.5. Competitors & Customers
14.3.12.6. Subsidiaries & Parent Organization
14.3.12.7. Recent Developments
14.3.12.8. Financial Analysis
14.3.12.9. Profitability
14.3.12.10. Revenue Share
14.3.12.11. Executive Bios
14.3.13. Kerry Logistics Network Limited
14.3.13.1. Company Overview
14.3.13.2. Company Footprints
14.3.13.3. Production Locations
14.3.13.4. Product Portfolio
14.3.13.5. Competitors & Customers
14.3.13.6. Subsidiaries & Parent Organization
14.3.13.7. Recent Developments
14.3.13.8. Financial Analysis
14.3.13.9. Profitability
14.3.13.10. Revenue Share
14.3.13.11. Executive Bios
14.3.14. Procet Freight
14.3.14.1. Company Overview
14.3.14.2. Company Footprints
14.3.14.3. Production Locations
14.3.14.4. Product Portfolio
14.3.14.5. Competitors & Customers
14.3.14.6. Subsidiaries & Parent Organization
14.3.14.7. Recent Developments
14.3.14.8. Financial Analysis
14.3.14.9. Profitability
14.3.14.10. Revenue Share
14.3.14.11. Executive Bios
14.3.15. Other Key Players
14.3.15.1. Company Overview
14.3.15.2. Company Footprints
14.3.15.3. Production Locations
14.3.15.4. Product Portfolio
14.3.15.5. Competitors & Customers
14.3.15.6. Subsidiaries & Parent Organization
14.3.15.7. Recent Developments
14.3.15.8. Financial Analysis
14.3.15.9. Profitability
14.3.15.10. Revenue Share
14.3.15.11. Executive Bios
List of Tables
Table 1: Global First and Last Mile Delivery Market Size & Forecast, Volume (Thousand Units), by Type, 2017-2031
Table 2: Global First and Last Mile Delivery Market Size & Forecast, Value (US$ Bn), by Type, 2017-2031
Table 3: Global First and Last Mile Delivery Market Size & Forecast, Volume (Thousand Units), by Vehicle Type, 2017-2031
Table 4: Global First and Last Mile Delivery Market Size & Forecast, Value (US$ Bn), by Vehicle Type, 2017-2031
Table 5: Global First and Last Mile Delivery Market Size & Forecast, Volume (Thousand Units), by End-use, 2017-2031
Table 6: Global First and Last Mile Delivery Market Size & Forecast, Value (US$ Bn), by End-use, 2017-2031
Table 7: Global First and Last Mile Delivery Market Size & Forecast, Volume (Thousand Units), by Region, 2017-2031
Table 8: Global First and Last Mile Delivery Market Size & Forecast, Value (US$ Bn), by Region, 2017-2031
Table 9: North America First and Last Mile Delivery Market Size & Forecast, Volume (Thousand Units), by Type, 2017-2031
Table 10: North America First and Last Mile Delivery Market Size & Forecast, Value (US$ Bn), by Type, 2017-2031
Table 11: North America First and Last Mile Delivery Market Size & Forecast, Volume (Thousand Units), by Vehicle Type, 2017-2031
Table 12: North America First and Last Mile Delivery Market Size & Forecast, Value (US$ Bn), by Vehicle Type, 2017-2031
Table 13: North America First and Last Mile Delivery Market Size & Forecast, Volume (Thousand Units), by End-use, 2017-2031
Table 14: North America First and Last Mile Delivery Market Size & Forecast, Value (US$ Bn), by End-use, 2017-2031
Table 15: North America First and Last Mile Delivery Market Size & Forecast, Volume (Thousand Units), by Country, 2017-2031
Table 16: North America First and Last Mile Delivery Market Size & Forecast, Value (US$ Bn), by Country, 2017-2031
Table 17: Europe First and Last Mile Delivery Market Size & Forecast, Volume (Thousand Units), by Type, 2017-2031
Table 18: Europe First and Last Mile Delivery Market Size & Forecast, Value (US$ Bn), by Type, 2017-2031
Table 19: Europe First and Last Mile Delivery Market Size & Forecast, Volume (Thousand Units), by Vehicle Type, 2017-2031
Table 20: Europe First and Last Mile Delivery Market Size & Forecast, Value (US$ Bn), by Vehicle Type, 2017-2031
Table 21: Europe First and Last Mile Delivery Market Size & Forecast, Volume (Thousand Units), by End-use, 2017-2031
Table 22: Europe First and Last Mile Delivery Market Size & Forecast, Value (US$ Bn), by End-use, 2017-2031
Table 23: Europe First and Last Mile Delivery Market Size & Forecast, Volume (Thousand Units), by Country and Sub-region, 2017-2031
Table 24: Europe First and Last Mile Delivery Market Size & Forecast, Value (US$ Bn), by Country and Sub-region, 2017-2031
Table 25: Asia Pacific First and Last Mile Delivery Market Size & Forecast, Volume (Thousand Units), by Type, 2017-2031
Table 26: Asia Pacific First and Last Mile Delivery Market Size & Forecast, Value (US$ Bn), by Type, 2017-2031
Table 27: Asia Pacific First and Last Mile Delivery Market Size & Forecast, Volume (Thousand Units), by Vehicle Type, 2017-2031
Table 28: Asia Pacific First and Last Mile Delivery Market Size & Forecast, Value (US$ Bn), by Vehicle Type, 2017-2031
Table 29: Asia Pacific First and Last Mile Delivery Market Size & Forecast, Volume (Thousand Units), by End-use, 2017-2031
Table 30: Asia Pacific First and Last Mile Delivery Market Size & Forecast, Value (US$ Bn), by End-use, 2017-2031
Table 31: Asia Pacific First and Last Mile Delivery Market Size & Forecast, Volume (Thousand Units), by Country and Sub-region, 2017-2031
Table 32: Asia Pacific First and Last Mile Delivery Market Size & Forecast, Value (US$ Bn), by Country and Sub-region, 2017-2031
Table 33: Middle East & Africa First and Last Mile Delivery Market Size & Forecast, Volume (Thousand Units), by Type, 2017-2031
Table 34: Middle East & Africa First and Last Mile Delivery Market Size & Forecast, Value (US$ Bn), by Type, 2017-2031
Table 35: Middle East & Africa First and Last Mile Delivery Market Size & Forecast, Volume (Thousand Units), by Vehicle Type, 2017-2031
Table 36: Middle East & Africa First and Last Mile Delivery Market Size & Forecast, Value (US$ Bn), by Vehicle Type, 2017-2031
Table 37: Middle East & Africa First and Last Mile Delivery Market Size & Forecast, Volume (Thousand Units), by End-use, 2017-2031
Table 38: Middle East & Africa First and Last Mile Delivery Market Size & Forecast, Value (US$ Bn), by End-use, 2017-2031
Table 39: Middle East & Africa First and Last Mile Delivery Market Size & Forecast, Volume (Thousand Units), by Country and Sub-region, 2017-2031
Table 40: Middle East & Africa First and Last Mile Delivery Market Size & Forecast, Value (US$ Bn), by Country and Sub-region, 2017-2031
Table 41: South America First and Last Mile Delivery Market Size & Forecast, Volume (Thousand Units), by Type, 2017-2031
Table 42: South America First and Last Mile Delivery Market Size & Forecast, Value (US$ Bn), by Type, 2017-2031
Table 43: South America First and Last Mile Delivery Market Size & Forecast, Volume (Thousand Units), by Vehicle Type, 2017-2031
Table 44: South America First and Last Mile Delivery Market Size & Forecast, Value (US$ Bn), by Vehicle Type, 2017-2031
Table 45: South America First and Last Mile Delivery Market Size & Forecast, Volume (Thousand Units), by End-use, 2017-2031
Table 46: South America First and Last Mile Delivery Market Size & Forecast, Value (US$ Bn), by End-use, 2017-2031
Table 47: South America First and Last Mile Delivery Market Size & Forecast, Volume (Thousand Units), by Country and Sub-region, 2017-2031
Table 48: South America First and Last Mile Delivery Market Size & Forecast, Value (US$ Bn), by Country and Sub-region, 2017-2031
List of Figures
Figure 1: Global First and Last Mile Delivery Market Volume (Thousand Units) Forecast, 2017–2031
Figure 2: Global First and Last Mile Delivery Market Value (US$ Bn) Forecast, 2017–2031
Figure 3: Key Segment Analysis for Global
Figure 4: Global First and Last Mile Delivery Market Size & Forecast, Value (US$ Bn), 2017-2031
Figure 5: Global First and Last Mile Delivery Market Size & Forecast, Value (US$ Bn), by Type, 2017-2031
Figure 6: Global Market Attractiveness, Value (US$ Bn), by Type, 2022-2031
Figure 7: Global First and Last Mile Delivery Market Size & Forecast, Value (US$ Bn), by Vehicle Type, 2017-2031
Figure 8: Global Market Attractiveness, Value (US$ Bn), by Vehicle Type, 2022-2031
Figure 9: Global First and Last Mile Delivery Market Size & Forecast, Value (US$ Bn), by End-use, 2017-2031
Figure 10: Global Market Attractiveness, Value (US$ Bn), by End-use, 2022-2031
Figure 11: Global First and Last Mile Delivery Market Size & Forecast, Value (US$ Bn), by Region, 2017-2031
Figure 12: Global Market Attractiveness, Value (US$ Bn), by Region, 2022-2031
Figure 13: North America First and Last Mile Delivery Market Size & Forecast, Value (US$ Bn), by Type, 2017-2031
Figure 14: North America Market Attractiveness, Value (US$ Bn), by Type, 2022-2031
Figure 15: North America First and Last Mile Delivery Market Size & Forecast, Value (US$ Bn), by Vehicle Type, 2017-2031
Figure 16: North America Market Attractiveness, Value (US$ Bn), by Vehicle Type, 2022-2031
Figure 17: North America First and Last Mile Delivery Market Size & Forecast, Value (US$ Bn), by End-use, 2017-2031
Figure 18: North America Market Attractiveness, Value (US$ Bn), by End-use, 2022-2031
Figure 19: North America First and Last Mile Delivery Market Size & Forecast, Value (US$ Bn), by Country, 2017-2031
Figure 20: North America Market Attractiveness, Value (US$ Bn), by Country, 2022-2031
Figure 21: Europe First and Last Mile Delivery Market Size & Forecast, Value (US$ Bn), by Type, 2017-2031
Figure 22: Europe Market Attractiveness, Value (US$ Bn), by Type, 2022-2031
Figure 23: Europe First and Last Mile Delivery Market Size & Forecast, Value (US$ Bn), by Vehicle Type, 2017-2031
Figure 24: Europe Market Attractiveness, Value (US$ Bn), by Vehicle Type, 2022-2031
Figure 25: Europe First and Last Mile Delivery Market Size & Forecast, Value (US$ Bn), by End-use, 2017-2031
Figure 26: Europe Market Attractiveness, Value (US$ Bn), by End-use, 2022-2031
Figure 27: Europe First and Last Mile Delivery Market Size & Forecast, Value (US$ Bn), by Country and Sub-region, 2017-2031
Figure 28: Europe Market Attractiveness, Value (US$ Bn), by Country and Sub-region, 2022-2031
Figure 29: Asia Pacific First and Last Mile Delivery Market Size & Forecast, Value (US$ Bn), by Type, 2017-2031
Figure 30: Asia Pacific Market Attractiveness, Value (US$ Bn), by Type, 2022-2031
Figure 31: Asia Pacific First and Last Mile Delivery Market Size & Forecast, Value (US$ Bn), by Vehicle Type, 2017-2031
Figure 32: Asia Pacific Market Attractiveness, Value (US$ Bn), by Vehicle Type, 2022-2031
Figure 33: Asia Pacific First and Last Mile Delivery Market Size & Forecast, Value (US$ Bn), by End-use, 2017-2031
Figure 34: Asia Pacific Market Attractiveness, Value (US$ Bn), by End-use, 2022-2031
Figure 35: Asia Pacific First and Last Mile Delivery Market Size & Forecast, Value (US$ Bn), by Country and Sub-region, 2017-2031
Figure 36: Asia Pacific Market Attractiveness, Value (US$ Bn), by Country and Sub-region, 2022-2031
Figure 37: Middle East & Africa First and Last Mile Delivery Market Size & Forecast, Value (US$ Bn), by Type, 2017-2031
Figure 38: Middle East & Africa Market Attractiveness, Value (US$ Bn), by Type, 2022-2031
Figure 39: Middle East & Africa First and Last Mile Delivery Market Size & Forecast, Value (US$ Bn), by Vehicle Type, 2017-2031
Figure 40: Middle East & Africa Market Attractiveness, Value (US$ Bn), by Vehicle Type, 2022-2031
Figure 41: Middle East & Africa First and Last Mile Delivery Market Size & Forecast, Value (US$ Bn), by End-use, 2017-2031
Figure 42: Middle East & Africa Market Attractiveness, Value (US$ Bn), by End-use, 2022-2031
Figure 43: Middle East & Africa First and Last Mile Delivery Market Size & Forecast, Value (US$ Bn), by Country and Sub-region, 2017-2031
Figure 44: Middle East & Africa Market Attractiveness, Value (US$ Bn), by Country and Sub-region, 2022-2031
Figure 45: South America First and Last Mile Delivery Market Size & Forecast, Value (US$ Bn), by Type, 2017-2031
Figure 46: South America Market Attractiveness, Value (US$ Bn), by Type, 2022-2031
Figure 47: South America First and Last Mile Delivery Market Size & Forecast, Value (US$ Bn), by Vehicle Type, 2017-2031
Figure 48: South America Market Attractiveness, Value (US$ Bn), by Vehicle Type, 2022-2031
Figure 49: South America First and Last Mile Delivery Market Size & Forecast, Value (US$ Bn), by End-use, 2017-2031
Figure 50: South America Market Attractiveness, Value (US$ Bn), by End-use, 2022-2031
Figure 51: South America First and Last Mile Delivery Market Size & Forecast, Value (US$ Bn), by Country and Sub-region, 2017-2031
Figure 52: South America Market Attractiveness, Value (US$ Bn), by Country and Sub-region, 2022-2031
Copyright © Transparency Market Research, Inc. All Rights reserved
Trust Online

First and Last Mile Delivery Market