
Reports
Reports
Global Ethoxyquin Market: Snapshot
The global market for ethoxyquin has been witnessing a significant upsurge in its size and valuation, thanks to the increased pet adoption across the world. Since ethoxyquin, as a preservative, is highly efficient in slowing down the oxidation of carotene, xanthophyll, and vitamin A and vitamin E in pet food products, to ensure long shelf-life, its demand is rising substantially with the augmenting need for pet food products, reflecting greatly on the overall market.
The demand for ethoxyquin is also experiencing a considerable rise due to the increasing need for efficient preservation for demand for poultry and fish meals is influencing the, thereby increasing the demand for ethoxyquin, globally. Going forward, the rise in the food trade is likely to boost the worldwide market for ethoxyquin in the near future. However, the toxicity of ethoxyquin, implementation of stringent regulations, and the complications in practicing antioxidants may hamper the growth of this market in the years to come.
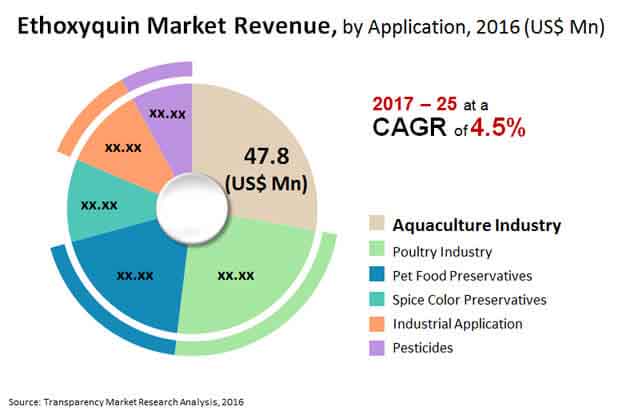
On the whole, the opportunity in the global ethoxyquin market is expected to rise at a CAGR of 4.50% between 2017 and 2025, increasing from a value of US$172.2 mn in 2016 to US$255.0 mn by the end of 2025.
Demand for Ethoxyquin-95 Oil to Remain Strong
Ethoxyquin-95 Oil, ethoxyquin-66 powder, and ethoxyquin-33 powder are the three main products available in the global market for ethoxyquin. The demand for ethoxyquin-95 oil is much higher than the other two across the world, thanks to the growing demand for fishmeal, fueled by the rising preference of fish and shrimps for consumption among people across the world. Ethoxyquin-95 oil led the global market in 2016 with a share of 55.5% and is expected to remain on the top over the next few years.
Ethoxyquin finds a widespread usage in the poultry industry, pesticides, pet food preservatives, spice color preservatives, industrial applications, and the aquaculture sector. The demand for ethoxyquin has been significantly high in the aquaculture industry and is expected to witness a remarkable upsurge in the years to come, owing to the increasing demand for fish and fishmeal products in emerging economies. Apart from this, the poultry industry is also anticipated to report healthy growth in the demand for ethoxyquin in the near future due to the rise in the poultry consumption.
North America to Retain its Dominance
The worldwide market for ethoxyquin is spread across Asia Pacific, the Middle East and Africa, North America, Latin America, and Europe. With a share of nearly 30%, North America led the global market in 2016. Researchers anticipate the regional market to remain dominant over the forthcoming years. The FDA approval for the usage of ethoxyquin in animal feed has propelled the market for ethoxyquin in North America. Over the coming years, the increasing consumption of ethoxyquin-95, especially in the aquaculture industry, is likely to boost this regional market substantially.
Europe and Asia Pacific are also established markets for ethoxyquin. While Asia Pacific is likely to report a rise in its overall share in the near future, thanks to the increasing usage of ethoxyquin-66 powder, the market in Europe will be experiencing a decline in its share due to the government regulations regarding the usage of ethoxyquin.
Camlin Fine Sciences Ltd., Merck KGaA., Mitsui & Co. Ltd., Shanghai Fuda Fine Material Co. Ltd., Skystone Feed Co. Ltd., Industrial Técnica Pecuaria S.A., Kemin Industries Inc., Jiangsu Zhongdan Group Co. Ltd., Impextraco N.V., and Rensin Chemicals Ltd. are some of the prominent participants in the global ethoxyquin market.
Demand for Increased Agricultural Production to Benefit Global Ethoxyquin Market
The global ethoxyquin market is anticipated to rise rapidly over the next few years. Such growth of the market is driven by increased demand for pet food preservatives and increased food trade between distant countries. Increased agricultural production across the globe and augmented demand for appropriate pesticides are further estimated to add to the growth of the market in the years to come. Ethoxyquin is a naturally occurring antioxidant that is widely used in spice colouring, pet food preservatives, and pesticides. Other factors that are expected to drive expansion of the global ethoxyquin market include the price of feed products and increased knowledge amongst animal breeders about the role of antioxidants in lowering feed costs.
Because of the defence it offers against lipid peroxidation, ethoxyquin is commonly utilized in animal feed. It can be included in foods intended for human consumption. Pet feed to poultry and farmed fish, on the other hand, may be used to feed humans. Significant experiments were performed in the 1980s to gauge the amount of toxicity people are exposed to as a result of their ingestion. The outcomes are still up for debate.
Increasing Demand for Use in Food Preservatives to Work in Favor of the market
Due to increasing demand for pet food, preservatives, successful pesticides, foreign trade, and agricultural production, the size of global ethoxyquin market is predicted to rise significantly over the forecast period. It is an antioxidant that's typically utilized in pet food to prevent lipids from oxidizing. Market growth should be driven by rising feed prices, reduced feed waste, and increased understanding of the role of feed antioxidants in lowering feed costs.
Ethoxyquin is an antioxidant that finds utilization in food preservatives to prevent scald on pears after they have been picked. The item has a wide variety of applications, including insecticides, fungicides, herbicides, plant growth regulators, and anti-degradation agents making the market versatile and profitable. The intensified demand for effective preservation of fish and poultry meals is also likely to drive up demand in global ethoxyquin market in the years to come. In the forecasted timeframe, a considerable increase in the food trade is likely to fuel growth of the global ethoxyquin market.
Ethoxyquin Market is expected to reach US$255.0 mn by 2025
Ethoxyquin Market is estimated to rise at a CAGR of 4.5% during forecast period
Increase animal feed industry activities are driving the growth of the Ethoxyquin Market
Asia Pacific is more attractive for vendors in the Ethoxyquin Market
Key players of Ethoxyquin Market are Camlin Fine Sciences Ltd., Merck KGaA., Mitsui & Co. Ltd., Shanghai Fuda Fine Material Co. Ltd., Skystone Feed Co. Ltd., Industrial Técnica Pecuaria S.A., Kemin Industries Inc., Jiangsu Zhongdan Group Co. Ltd., Impextraco N.V., and Rensin Chemicals Ltd
1. Executive Summary
2. Market Introduction
2.1. Market Definition
2.2. Market Taxonomy
3. Global Ethoxyquin Market Analysis Scenario
3.1. Market Size and Forecast
3.1.1. Market Size and Y-o-Y Growth
3.1.2. bsolute $ Opportunity
3.2. Market Overview
3.2.1. Value Chain
4. Market Dynamics
4.1. Drivers
4.2. Restraints
4.3. Opportunity
4.4. Trends
4.5. Key Regulations
5. Global Ethoxyquin Market Analysis and Forecast, By Product Type
5.1. Introduction
5.1.1. Basis Point Share (BPS) Analysis, By Product Type
5.1.2. Y-o-Y Growth Projections, By Product Type
5.2. Market Size Forecast, By Product Type
5.2.1. Ethoxyquin- 95 Oil
5.2.2. Ethoxyquin- 66 Powder
5.2.3. Ethoxyquin-33 Powder
5.3. Market Attractiveness Analysis, By Product Type
6. Global Ethoxyquin Market Analysis and Forecast, By Application
6.1. Introduction
6.1.1. Basis Point Share (BPS) Analysis, By Application
6.1.2. Y-o-Y Growth Projections, By Application
6.2. Market Size Forecast, By Application
6.2.1. Pesticides
6.2.2. Pet Food Preservatives
6.2.3. Poultry Industry
6.2.4. quaculture Industry
6.2.5. Spice Color Preservatives
6.2.6. Industrial Application
6.3. Market Attractiveness Analysis, By Application
7. Global Ethoxyquin Market Analysis and Forecast, By Region
7.1. Introduction
7.1.1. Basis Point Share (BPS) Analysis, By Region
7.1.2. Y-o-Y Growth Projections, By Region
7.2. Market Size Forecast, By Region
7.2.1. North America
7.2.2. Europe
7.2.3. sia Pacific
7.2.4. Latin America
7.2.5. Middle East and Africa (MEA)
7.3. Market Attractiveness Analysis, By Region
8. North America Ethoxyquin Market Analysis and Forecast
8.1. Introduction
8.1.1. Basis Point Share (BPS) Analysis, By Country
8.1.2. Y-o-Y Growth Projections, By Country
8.2. Market Size Forecast, By Country
8.2.1. U.S.
8.2.2. Canada
8.3. Market Size Forecast, By Product Type
8.3.1. Ethoxyquin- 95 Oil
8.3.2. Ethoxyquin- 66 Powder
8.3.3. Ethoxyquin-33 Powder
8.4. Market Size Forecast, By Application
8.4.1. Pesticides
8.4.2. Pet Food Preservatives
8.4.3. Poultry Industry
8.4.4. quaculture Industry
8.4.5. Spice Color Preservatives
8.4.6. Industrial Application
8.5. Market Attractiveness Analysis
8.5.1. By Country
8.5.2. By Product Type
8.5.3. By Application
9. Latin America Ethoxyquin Market Analysis and Forecast
9.1. Introduction
9.1.1. Basis Point Share (BPS) Analysis, By Country
9.1.2. Y-o-Y Growth Projections, By Country
9.2. Market Size Forecast, By Country
9.2.1. Brazil
9.2.2. Mexico
9.2.3. rgentina
9.2.4. Rest of LA
9.3. Market Size Forecast, By Product Type
9.3.1. Ethoxyquin- 95 Oil
9.3.2. Ethoxyquin- 66 Powder
9.3.3. Ethoxyquin-33 Powder
9.4. Market Size Forecast, By Application
9.4.1. Pesticides
9.4.2. Pet Food Preservatives
9.4.3. Poultry Industry
9.4.4. quaculture Industry
9.4.5. Spice Color Preservatives
9.4.6. Industrial Application
9.5. Market Attractiveness Analysis
9.5.1. By Country
9.5.2. By Product Type
9.5.3. By Application
10. Europe Ethoxyquin Market Analysis and Forecast
10.1. Introduction
10.1.1. Basis Point Share (BPS) Analysis, By Country
10.1.2. Y-o-Y Growth Projections, By Country
10.2. Market Size Forecast, By Country
10.2.1. EU5
10.2.2. Nordic
10.2.3. Russia
10.2.4. Poland
10.2.5. Rest of Europe
10.3. Market Size Forecast, By Product Type
10.3.1. Ethoxyquin- 95 Oil
10.3.2. Ethoxyquin- 66 Powder
10.3.3. Ethoxyquin-33 Powder
10.4. Market Size Forecast, By Application
10.4.1. Pesticides
10.4.2. Pet Food Preservatives
10.4.3. Poultry Industry
10.4.4. Aquaculture Industry
10.4.5. Spice Color Preservatives
10.4.6. Industrial Application
10.5. Market Attractiveness Analysis
10.5.1. By Country
10.5.2. By Product Type
10.5.3. By Application
11. sia Pacific Ethoxyquin Market Analysis and Forecast
11.1. Introduction
11.1.1. Basis Point Share (BPS) Analysis, By Country
11.1.2. Y-o-Y Growth Projections, By Country
11.2. Market Size Forecast, By Country
11.2.1. China
11.2.2. India
11.2.3. Japan
11.2.4. A&NZ
11.2.5. Rest of APAC
11.3. Market Size Forecast, By Product Type
11.3.1. Ethoxyquin- 95 Oil
11.3.2. Ethoxyquin- 66 Powder
11.3.3. Ethoxyquin-33 Powder
11.4. Market Size Forecast, By Application
11.4.1. Pesticides
11.4.2. Pet Food Preservatives
11.4.3. Poultry Industry
11.4.4. Aquaculture Industry
11.4.5. Spice Color Preservatives
11.4.6. Industrial Application
11.5. Market Attractiveness Analysis
11.5.1. By Country
11.5.2. By Product Type
11.5.3. By Application
12. Middle East and Africa (MEA) Ethoxyquin Market Analysis and Forecast
12.1. Introduction
12.1.1. Basis Point Share (BPS) Analysis, By Country
12.1.2. Y-o-Y Growth Projections, By Country
12.2. Market Size Forecast, By Country
12.2.1. North Africa
12.2.2. South Africa
12.2.3. GCC countries
12.2.4. Rest of MEA
12.3. Market Size Forecast, By Product Type
12.3.1. Ethoxyquin- 95 Oil
12.3.2. Ethoxyquin- 66 Powder
12.3.3. Ethoxyquin-33 Powder
12.4. Market Size Forecast, By Application
12.4.1. Pesticides
12.4.2. Pet Food Preservatives
12.4.3. Poultry Industry
12.4.4. Aquaculture Industry
12.4.5. Spice Color Preservatives
12.4.6. Industrial Application
12.5. Market Attractiveness Analysis
12.5.1. By Country
12.5.2. By Product Type
12.5.3. By Application
13. Competitive Landscape
13.1. Market Structure
13.2. Competition Dashboard
13.3. Company Profiles
13.4. Global Players
13.4.1. Rensin Chemicals Limited
13.4.1.1. Overview
13.4.1.2. Strategic Overview
13.4.1.3. Product Offerings
13.4.1.4. Recent Developments
13.4.1.5. SWOT Analysis
13.4.2. Impextraco N.V.
13.4.2.1. Overview
13.4.2.2. Strategic Overview
13.4.2.3. Product Offerings
13.4.2.4. Recent Developments
13.4.2.5. SWOT Analysis
13.4.3. Jiangsu Zhongdan Group Co., Ltd.
13.4.3.1. Overview
13.4.3.2. Strategic Overview
13.4.3.3. Product Offerings
13.4.3.4. Recent Developments
13.4.3.5. SWOT Analysis
13.4.3.6. Financial Overview
13.4.4. Kemin Industries, Inc.
13.4.4.1. Overview
13.4.4.2. Strategic Overview
13.4.4.3. Product Offerings
13.4.4.4. Recent Developments
13.4.4.5. SWOT Analysis
13.4.5. Industrial Técnica Pecuaria, S.A. (ITPSA)
13.4.5.1. Overview
13.4.5.2. Strategic Overview
13.4.5.3. Product Offerings
13.4.5.4. Recent Developments
13.4.5.5. SWOT Analysis
13.4.5.6. Financial Overview
13.4.6. Skystone Feed Co., Ltd.
13.4.6.1. Overview
13.4.6.2. Strategic Overview
13.4.6.3. Product Offerings
13.4.6.4. Recent Developments
13.4.6.5. SWOT Analysis
13.4.6.6. Financial Overview
13.4.7. Shanghai Fuda Fine Material Co., Ltd.,
13.4.7.1. Overview
13.4.7.2. Strategic Overview
13.4.7.3. Product Offerings
13.4.7.4. Recent Developments
13.4.7.5. SWOT Analysis
13.4.8. Mitsui & Co., Ltd.
13.4.8.1. Overview
13.4.8.2. Strategic Overview
13.4.8.3. Product Offerings
13.4.8.4. Recent Developments
13.4.8.5. SWOT Analysis
13.4.8.6. Financial Overview
13.4.9. Merck KGaA.
13.4.9.1. Overview
13.4.9.2. Strategic Overview
13.4.9.3. Product Offerings
13.4.9.4. Recent Developments
13.4.9.5. SWOT Analysis
13.4.9.6. Financial Overview
13.4.10. Camlin Fine Sciences Ltd.
13.4.10.1. Overview
13.4.10.2. Strategic Overview
13.4.10.3. Product Offerings
13.4.10.4. Recent Developments
13.4.10.5. SWOT Analysis
13.4.10.6. Financial Overview
14. ssumptions & Acronyms Used
15. Research Methodology
List of Table
Table 1: Global Ethoxyquin Market Value (US$ Mn) and Volume (Tons) Forecast by Product
Table 2: Global Ethoxyquin Market Value (US$ Mn) and Volume (Tons) Forecast, By Application
Table 3: Global Ethoxyquin Market Value (US$ Mn) and Market Volume (Tons) Forecast, by Region
Table 4: North America Ethoxyquin Market Value (US$ Mn) and Market Volume (Tons) Forecast, by Country
Table 5: North America Ethoxyquin Market Value (US$ Mn) and Volume (Tons) Forecast, by Product
Table 6: North America Ethoxyquin Market Value (US$ Mn) and Volume (Tons) Forecast, By Application
Table 7: Latin America Ethoxyquin Market Value (US$ Mn) and Market Volume (Tons) Forecast, by Country
Table 8: Latin America Ethoxyquin Market Value (US$ Mn) and Volume (Tons) Forecast, by Product
Table 9: Latin America Ethoxyquin Market Value (US$ Mn) and Volume (Tons) Forecast, By Application
Table 10: Europe Ethoxyquin Market Value (US$ Mn) and Market Volume (Tons) Forecast, by Country
Table 11: Europe Ethoxyquin Market Value (US$ Mn) and Volume (Tons) Forecast, by Product
Table 12: Europe Ethoxyquin Market Value (US$ Mn) and Volume (Tons) Forecast, By Application
Table 13: Asia Pacific Ethoxyquin Market Value (US$ Mn) and Market Volume (Tons) Forecast, by Country
Table 14: Asia Pacific Ethoxyquin Market Value (US$ Mn) and Volume (Tons) Forecast, by Product
Table 15: Asia Pacific Ethoxyquin Market Value (US$ Mn) and Volume (Tons) Forecast, By Application
Table 16: Middle East & Africa Ethoxyquin Market Value (US$ Mn) and Market Volume (Tons) Forecast, by Country
Table 17: Middle East & Africa Ethoxyquin Market Value (US$ Mn) and Volume (Tons) Forecast, by Product
Table 18: Middle East & Africa Ethoxyquin Market Value (US$ Mn) and Volume (Tons) Forecast, By Application
List of Figure
Figure 1: Global Ethoxyquin Market Value (US$ Mn) & Volume (Tons), 2016–2025
Figure 2: Global Ethoxyquin Market Absolute $ Opportunity
Figure 3: Global Ethoxyquin Market Y-o-Y Growth by Product, 2017–2025
Figure 4: Global Ethoxyquin Market Value (US$ Mn) Share and BPS Analysis, by Product, 2017 & 2025
Figure 5: Global Ethoxyquin Market Value (US$ Mn) & Volume (Tons), by Ethoxyquin- 95 Oil Segment, 2016–2025
Figure 6: Global Ethoxyquin Market Absolute $ Opportunity
Figure 7: Global Ethoxyquin Market Value (US$ Mn) & Volume (Tons), by Ethoxyquin- 66 Powder Segment, 2016–2025
Figure 8: Global Ethoxyquin Market Absolute $ Opportunity (US$ Mn), by Ethoxyquin- 66 Powder Segment, 2016–2025
Figure 9: Global Ethoxyquin Market Value (US$ Mn) & Volume (Tons), by Ethoxyquin-33 Powder Segment, 2016–2025
Figure 10: Global Ethoxyquin Market Absolute $ Opportunity (US$ Mn), by Ethoxyquin-33 Powder Segment, 2016–2025
Figure 11: Global Ethoxyquin Market Attractiveness Analysis by Product, 2017–2025
Figure 12: Global Ethoxyquin Market Y-o-Y Growth by Application, 2017–2025
Figure 13: Global Ethoxyquin Market Value (US$ Mn) Share and BPS Analysis, by Application, 2017 & 2025
Figure 14: Global Ethoxyquin Market Value (US$ Mn) and Volume (Tons), by Pesticides Segment, 2016–2025
Figure 15: Global Ethoxyquin Market Absolute $ Opportunity (US$ Mn), by Pesticides Segment, 2016–2025
Figure 16: Global Ethoxyquin Market Value (US$ Mn) and Volume (Tons), by Pet Food Preservatives Segment, 2016–2025
Figure 17: Global Ethoxyquin Market Absolute $ Opportunity (US$ Mn), by Pet Food Preservatives Segment, 2016–2025
Figure 18: Global Ethoxyquin Market Value (US$ Mn) and Volume (Tons), by Poultry Industry Segment, 2016–2025
Figure 19: Global Ethoxyquin Market Absolute $ Opportunity (US$ Mn), by Poultry Industry Segment, 2016–2025
Figure 20: Global Ethoxyquin Market Value (US$ Mn) and Volume (Tons), by Aquaculture Industry Segment, 2016–2025
Figure 21: Global Ethoxyquin Market Absolute $ Opportunity (US$ Mn), by Aquaculture Industry Segment, 2016–2025
Figure 22: Global Ethoxyquin Market Value (US$ Mn) and Volume (Tons), by Spice Color Preservatives Segment, 2016–2025
Figure 23: Global Ethoxyquin Market Absolute $ Opportunity (US$ Mn), by Spice Color Preservatives Segment, 2016–2025
Figure 24: Global Ethoxyquin Market Value (US$ Mn) and Volume (Tons), by Industrial Application Segment, 2016–2025
Figure 25: Global Ethoxyquin Market Absolute $ Opportunity (US$ Mn), by Industrial Application Segment, 2016–2025
Figure 26: Global Ethoxyquin Market Attractiveness Analysis, By Application, 2017–2025
Figure 27: Global Ethoxyquin Market Y-o-Y Growth, by Region, 2017–2025
Figure 28: Global Ethoxyquin Market Value (US$ Mn) Share and BPS Analysis, by Region, 2017 & 2025
Figure 29: Global Ethoxyquin Market Attractiveness Analysis, By Region, 2017–2025
Figure 30: North America Ethoxyquin Market Value (US$ Mn) and Volume (Tons), 2016–2025
Figure 31: North America Ethoxyquin Market Absolute $ Opportunity (US$ Mn), 2016–2025
Figure 32: North America Ethoxyquin Market Y-o-Y Growth, by Country, 2017–2025
Figure 33: North America Ethoxyquin Market Value (US$ Mn) Share and BPS Analysis, by Country, 2017 & 2025
Figure 34: North America Ethoxyquin Market Y-o-Y Growth by Product, 2017–2025
Figure 35: North America Ethoxyquin Market Value (US$ Mn) Share and BPS Analysis, by Product, 2017 & 2025
Figure 36: North America Ethoxyquin Market Absolute $ Opportunity (US$ Mn), by Ethoxyquin- 95 Oil Segment, 2016–2025
Figure 37: North America Ethoxyquin Market Absolute $ Opportunity (US$ Mn), by Ethoxyquin- 66 Powder Segment, 2016–2025
Figure 38: North America Ethoxyquin Market Absolute $ Opportunity (US$ Mn), by Ethoxyquin-33 Powder Segment, 2016–2025
Figure 39: North America Ethoxyquin Market Y-o-Y Growth by Application, 2017–2025
Figure 40: North America Ethoxyquin Market Value (US$ Mn) Share and BPS Analysis, by Application, 2017 & 2025
Figure 41: North America Ethoxyquin Market Absolute $ Opportunity (US$ Mn), by Pesticides Segment, 2016–2025
Figure 42: North America Ethoxyquin Market Absolute $ Opportunity (US$ Mn), by Pet Food Preservatives Segment, 2016–2025
Figure 43: North America Ethoxyquin Market Absolute $ Opportunity (US$ Mn), by Poultry Industry Segment, 2016–2025
Figure 44: North America Ethoxyquin Market Absolute $ Opportunity (US$ Mn), by Aquaculture Industry Segment, 2016–2025
Figure 45: North America Ethoxyquin Market Absolute $ Opportunity (US$ Mn), by Spice Color Preservatives Segment, 2016–2025
Figure 46: North America Ethoxyquin Market Absolute $ Opportunity (US$ Mn), by Industrial Application Segment, 2016–2025
Figure 47: North America Ethoxyquin Market Attractiveness Analysis, by Product, 2017–2025
Figure 48: North America Ethoxyquin Market Attractiveness Analysis, By Application, 2017–2025
Figure 49: North America Ethoxyquin Market Attractiveness Analysis, By Country, 2017–2025
Figure 50: Latin America Ethoxyquin Market Value (US$ Mn) and Volume (Tons), 2016–2025
Figure 51: Latin America Ethoxyquin Market Absolute $ Opportunity (US$ Mn), 2016–2025
Figure 52: Latin America Ethoxyquin Market Y-o-Y Growth, by Country, 2017–2025
Figure 53: Latin America Ethoxyquin Market Value (US$ Mn) Share and BPS Analysis, by Country, 2017 & 2025
Figure 54: Latin America Ethoxyquin Market Y-o-Y Growth by Product, 2017–2025
Figure 55: Latin America Ethoxyquin Market Value (US$ Mn) Share and BPS Analysis, by Product, 2017 & 2025
Figure 56: Latin America Ethoxyquin Market Absolute $ Opportunity (US$ Mn), by Ethoxyquin- 95 Oil Segment, 2016–2025
Figure 57: Latin America Ethoxyquin Market Absolute $ Opportunity (US$ Mn), by Ethoxyquin- 66 Powder Segment, 2016–2025
Figure 58: Latin America Ethoxyquin Market Absolute $ Opportunity (US$ '000), by Ethoxyquin-33 Powder Segment, 2016–2025
Figure 59: Latin America Ethoxyquin Market Y-o-Y Growth by Application, 2017–2025
Figure 60: Latin America Ethoxyquin Market Value (US$ Mn) Share and BPS Analysis, by Application, 2017 & 2025
Figure 61: Latin America Ethoxyquin Market Absolute $ Opportunity (US$ '000), by Pesticides Segment, 2016–2025
Figure 62: Latin America Ethoxyquin Market Absolute $ Opportunity (US$ '000), by Pet Food Preservatives Segment, 2016–2025
Figure 63: Latin America Ethoxyquin Market Absolute $ Opportunity (US$ Mn), by Poultry Industry Segment, 2016–2025
Figure 64: Latin America Ethoxyquin Market Absolute $ Opportunity (US$ Mn), by Aquaculture Industry Segment, 2016–2025
Figure 65: Latin America Ethoxyquin Market Absolute $ Opportunity (US$ '000), by Spice Color Preservatives Segment, 2016–2025
Figure 66: Latin America Ethoxyquin Market Absolute $ Opportunity (US$ '000), by Industrial Application Segment, 2016–2025
Figure 67: Latin America Ethoxyquin Market Attractiveness Analysis, by Product, 2017–2025
Figure 68: Latin America Ethoxyquin Market Attractiveness Analysis, By Application, 2017–2025
Figure 69: Latin America Ethoxyquin Market Attractiveness Analysis, By Country, 2017–2025
Figure 70: Europe Ethoxyquin Market Value (US$ Mn) and Volume (Tons), 2016–2025
Figure 71: Europe Ethoxyquin Market Absolute $ Opportunity (US$ Mn), 2016–2025
Figure 72: Europe Ethoxyquin Market Y-o-Y Growth, by Country, 2017–2025
Figure 73: Europe Ethoxyquin Market Value (US$ Mn) Share and BPS Analysis, by Country, 2017 & 2025
Figure 74: Europe Ethoxyquin Market Y-o-Y Growth by Product, 2017–2025
Figure 75: Europe Ethoxyquin Market Value (US$ Mn) Share and BPS Analysis, by Product, 2017 & 2025
Figure 76: Europe Ethoxyquin Market Absolute $ Opportunity (US$ Mn), by Ethoxyquin- 95 Oil Segment, 2016–2025
Figure 77: Europe Ethoxyquin Market Absolute $ Opportunity (US$ Mn), by Ethoxyquin- 66 Powder Segment, 2016–2025
Figure 78: Europe Ethoxyquin Market Absolute $ Opportunity (US$ '000), by Ethoxyquin-33 Powder Segment, 2016–2025
Figure 79: Europe Ethoxyquin Market Y-o-Y Growth by Application, 2017–2025
Figure 80: Europe Ethoxyquin Market Value (US$ Mn) Share and BPS Analysis, by Application, 2017 & 2025
Figure 81: Europe Ethoxyquin Market Absolute $ Opportunity (US$ Mn), by Pesticides Segment, 2016–2025
Figure 82: Europe Ethoxyquin Market Absolute $ Opportunity (US$ Mn), by Pet Food Preservatives Segment, 2016–2025
Figure 83: Europe Ethoxyquin Market Absolute $ Opportunity (US$ Mn), by Poultry Industry Segment, 2016–2025
Figure 84: Europe Ethoxyquin Market Absolute $ Opportunity (US$ Mn), by Aquaculture Industry Segment, 2016–2025
Figure 85: Europe Ethoxyquin Market Absolute $ Opportunity (US$ Mn), by Spice Color Preservatives Segment, 2016–2025
Figure 86: Europe Ethoxyquin Market Absolute $ Opportunity (US$ Mn), by Industrial Application Segment, 2016–2025
Figure 87: Europe Ethoxyquin Market Attractiveness Analysis, by Product, 2017–2025
Figure 88: Europe Ethoxyquin Market Attractiveness Analysis, By Application, 2017–2025
Figure 89: Europe Ethoxyquin Market Attractiveness Analysis, By Country, 2017–2025
Figure 90: Asia Pacific Ethoxyquin Market Value (US$ Mn) and Volume (Tons), 2016–2025
Figure 91: Asia Pacific Ethoxyquin Market Absolute $ Opportunity (US$ Mn), 2016–2025
Figure 92: Asia Pacific Ethoxyquin Market Y-o-Y Growth, by Country, 2017–2025
Figure 93: Asia Pacific Ethoxyquin Market Value (US$ Mn) Share and BPS Analysis, by Country, 2017 & 2025
Figure 94: Asia Pacific Ethoxyquin Market Y-o-Y Growth by Product, 2017–2025
Figure 95: Asia Pacific Ethoxyquin Market Value (US$ Mn) Share and BPS Analysis, by Product, 2017 & 2025
Figure 96: Asia Pacific Ethoxyquin Market Absolute $ Opportunity (US$ Mn), by Ethoxyquin- 95 Oil Segment, 2016–2025
Figure 97: Asia Pacific Ethoxyquin Market Absolute $ Opportunity (US$ Mn), by Ethoxyquin- 66 Powder Segment, 2016–2025
Figure 98: Asia Pacific Ethoxyquin Market Absolute $ Opportunity (US$ '000), by Ethoxyquin-33 Powder Segment, 2016–2025
Figure 99: Asia Pacific Ethoxyquin Market Y-o-Y Growth by Application, 2017–2025
Figure 100: Asia Pacific Ethoxyquin Market Value (US$ Mn) Share and BPS Analysis, by Application, 2017 & 2025
Figure 101: Asia Pacific Ethoxyquin Market Absolute $ Opportunity (US$ Mn), by Pesticides Segment, 2016–2025
Figure 102: Asia Pacific Ethoxyquin Market Absolute $ Opportunity (US$ Mn), by Pet Food Preservatives Segment, 2016–2025
Figure 103: Asia Pacific Ethoxyquin Market Absolute $ Opportunity (US$ Mn), by Poultry Industry Segment, 2016–2025
Figure 104: Asia Pacific Ethoxyquin Market Absolute $ Opportunity (US$ Mn), by Aquaculture Industry Segment, 2016–2025
Figure 105: Asia Pacific Ethoxyquin Market Absolute $ Opportunity (US$ Mn), by Spice Color Preservatives Segment, 2016–2025
Figure 106: Asia Pacific Ethoxyquin Market Absolute $ Opportunity (US$ Mn), by Industrial Application Segment, 2016–2025
Figure 107: Asia Pacific Ethoxyquin Market Attractiveness Analysis, by Product, 2017–2025
Figure 108: Asia Pacific Ethoxyquin Market Attractiveness Analysis, By Application, 2017–2025
Figure 109: Asia Pacific Ethoxyquin Market Attractiveness Analysis, By Country, 2017–2025
Figure 110: Middle East & Africa Ethoxyquin Market Value (US$ Mn) and Volume (Tons), 2016–2025
Figure 111: Middle East & Africa Ethoxyquin Market Absolute $ Opportunity (US$ Mn), 2016–2025
Figure 112: Middle East & Africa Ethoxyquin Market Y-o-Y Growth, by Country, 2017–2025
Figure 113: Middle East & Africa Ethoxyquin Market Value (US$ Mn) Share and BPS Analysis, by Country, 2017 & 2025
Figure 114: Middle East & Africa Ethoxyquin Market Y-o-Y Growth by Product, 2017–2025
Figure 115: Middle East & Africa Ethoxyquin Market Value (US$ Mn) Share and BPS Analysis, by Product, 2017 & 2025
Figure 116: Middle East & Africa Ethoxyquin Market Absolute $ Opportunity (US$ Mn), by Ethoxyquin- 95 Oil Segment, 2016–2025
Figure 117: Middle East & Africa Ethoxyquin Market Absolute $ Opportunity (US$ Mn), by Ethoxyquin- 66 Powder Segment, 2016–2025
Figure 118: Middle East & Africa Ethoxyquin Market Absolute $ Opportunity (US$ '000), by Ethoxyquin-33 Powder Segment, 2016–2025
Figure 119: Middle East & Africa Ethoxyquin Market Y-o-Y Growth by Application, 2017–2025
Figure 120: Middle East & Africa Ethoxyquin Market Value (US$ Mn) Share and BPS Analysis, by Application, 2017 & 2025
Figure 121: Middle East & Africa Ethoxyquin Market Absolute $ Opportunity (US$ '000), by Pesticides Segment, 2016–2025
Figure 122: Middle East & Africa Ethoxyquin Market Absolute $ Opportunity (US$ '000), by Pet Food Preservatives Segment, 2016–2025
Figure 123: Middle East & Africa Ethoxyquin Market Absolute $ Opportunity (US$ Mn), by Poultry Industry Segment, 2016–2025
Figure 124: Middle East & Africa Ethoxyquin Market Absolute $ Opportunity (US$ Mn), by Aquaculture Industry Segment, 2016–2025
Figure 125: Middle East & Africa Ethoxyquin Market Absolute $ Opportunity (US$ '000), by Spice Color Preservatives Segment, 2016–2025
Figure 126: Middle East & Africa Ethoxyquin Market Absolute $ Opportunity (US$ '000), by Industrial Application Segment, 2016–2025
Figure 127: Middle East & Africa Ethoxyquin Market Attractiveness Analysis, by Product, 2017–2025
Figure 128: Middle East & Africa Ethoxyquin Market Attractiveness Analysis, By Application, 2017–2025
Figure 129: Middle East & Africa Ethoxyquin Market Attractiveness Analysis, By Country, 2017–2025
Copyright © Transparency Market Research, Inc. All Rights reserved
Trust Online

Ethoxyquin Market Forecast Report, 2017-2025