
Reports
Reports
Analysts’ Viewpoint on Equine Supplement Products Market Scenario
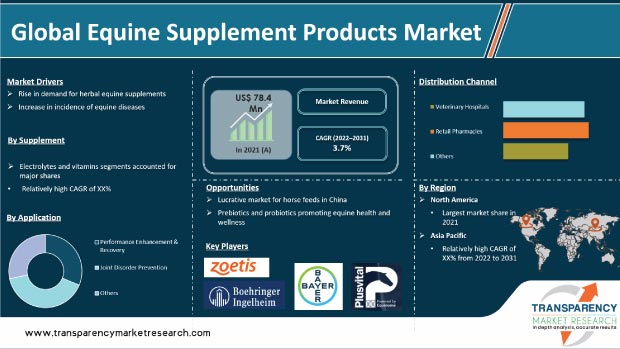
The global equine supplement products market is expected to grow at a moderate pace during the forecast period, led by the launch of new products. For instance, in July 2020, Buckeye Nutrition launched Ultimate Recovery, an extruded recovery supplement for performance horses. In 2019, Linkreservations, Inc. launched Cannabidiol (CBD) product for horses under the LinkResPet brand. Leading equine supplement companies are engaging in merger and acquisition activities to increase their presence in the market. Rise in government initiatives for equine health and growth in economic impact of the equine health industry are propelling the global equine supplement products market.
Equines are remarkable athletes and regularly require assistance for their high-performance regimen in the form of dietary horse supplements and additives. All horses, whether used for breeding, dressage, racing, or showing, need a balanced diet to improve their health. Performance horses have higher dietary needs than conventional horses due to the demands imposed on their bodies. A balanced diet, which sets priority on providing horses the nutrients they need for energy, is the secret to keep them strong and active. High-performance horses constantly burn their stored energy; hence, they need higher-than-average protein intake to maintain optimum health. In the U.S., the National Equine Health Plan was developed by the American Equine Council, the American Association of Equine Practitioners (AAEP), and the United States Department of Agriculture (USDA). Additionally, the National Animal Health Surveillance System (NAHMS), the Non-Regulatory Veterinary Services (VS) division of the USDA Animal and Plant Health Inspection Service, was developed to meet the national animal health information needs.
Incidence of equine diseases has increased globally over the last few years. Joint infections, microorganism infections, and higher metabolism infections are the common infections among horses. Horses in North America develop equine infectious anemia, salmonellosis, clostridial enteritis, and alternative diseases. In Europe, equine inflammation viral infection and animal disease are the key equine diseases reported in horses. According to the U.S. Department of Agriculture, cephalitis (EEE), Japanese Equine Infectious Anemia (EIA), equine viral arteritis (EVA), and West Nile River Virus (WNV) are the usually reported equine diseases in the country.
Various equine supplements, such as vitamins, minerals, and protein/amino acid supplements, are commercially available in the market. Veterinary supplements, especially herbal supplements, are increasingly being used as part of health and wellness programs for horses. Rise in availability of digestive products and food & energy supplements for equine animals; growth in studies on the effect of herbal supplements on horse health; and increase in preference for herbal products among owners are driving the demand for equine supplements, thus augmenting the equine supplement products market size.
In terms of supplement, the global equine supplement products market has been classified into protein/amino acid, vitamins, enzymes & electrolytes, and others. The electrolytes & vitamins segment accounted for major share of the global market in 2021. Horses need vitamins for growth, tissue maintenance, bodily functions, and peak sports performance. Several diets, especially those in coastal areas, contain low levels of copper and zinc. Hence, nutritional deficiency in horses is common. A growing horse requires at least 400 mg of zinc and 120 mg of copper per day. This increases the need for mineral supplements such as magnesium for horses.
Based on application, the global equine supplement products market has been segregated into performance enhancement/recovery, joint disorder prevention, and others. The joint disorder prevention segment dominated the global market in 2021. Young horses' orthopedic injuries not only have a significant financial impact on the horse business, but can be detrimental to the horse owner. Hence, the horse industry focuses on managing joint health by providing the right joint supplements for horses.
In terms of distribution channel, the global equine supplement products market has been divided into retail pharmacies, veterinary hospitals, and others. The others segment accounted for major share of the global equine supplement products market in 2021. Distribution channels such as online pharmacies save time, offer good discounts, and provide home delivery of equine supplement products.
North America dominated the global equine supplement products market in 2021. This can be ascribed to the increase in equine population, rise in awareness about various infectious as well as chronic diseases in horses, high per capita equine care expenditure, and launch of healthy supplements for equine by leading players in in the U.S.
Europe held the second largest share of the global market in 2021. The market in the region is expected to be driven by the increase in number of horse riders and rise in spending on horse care in countries such as the U.K.
Asia Pacific is anticipated to be the fastest growing market for equine supplement products during the forecast period. The equine supplement products market outlook appears promising in the region owing to the increase in number of horse clubs, rise in interest in horse racing among the youth, high demand for horse feed supplements, and distribution agreements for business expansion. Furthermore, growth in number of equine shows is expected to propel the demand for equine health products in Asia Pacific.
The global equine supplement products market is consolidated, with the presence of a small number of large-scale players. Most of the firms are investing significantly in comprehensive research and development activities, primarily to introduce environmentally-friendly products in the market. Expansion of product portfolio and mergers & acquisitions are the major strategies adopted by the key players. Leading players in the global equine supplement products market are Zoetis, Boehringer Ingelheim International GmbH, Bayer AG, Equine Products UK LTD, Purina Animal Nutrition LLC., Vetoquinol S.A., Kentucky Equine Research, Plusvital Limited, Lallemand, Inc., and Virbac.
Each of these players has been profiled in the equine supplement products market report based on parameters such as company overview, financial overview, business strategies, product portfolio, business segments, and recent developments.
|
Attribute |
Detail |
|
Market Size Value in 2021 |
US$ 78.4 Mn |
|
Market Forecast Value in 2031 |
US$ 111 Mn |
|
Growth Rate (CAGR) |
3.7% |
|
Forecast Period |
2022–2031 |
|
Historical Data Available for |
2017–2020 |
|
Quantitative Units |
US$ Mn for Value |
|
Market Analysis |
It includes segment analysis as well as regional level analysis. Moreover, qualitative analysis includes drivers, restraints, opportunities, key trends, Porter’s Five Forces analysis, value chain analysis, and key trend analysis. |
|
Competition Landscape |
|
|
Format |
Electronic (PDF) + Excel |
|
Market Segmentation |
|
|
Regions Covered |
|
|
Countries Covered |
|
|
Companies Profiled |
|
|
Customization Scope |
Available upon request |
|
Pricing |
Available upon request |
The global equine supplement products market was valued at US$ 78.4 Mn in 2021
The global equine supplement products market is projected to reach US$ 111 Mn by 2031
The global equine supplement products market is anticipated to grow at a CAGR 3.7% from 2022 to 2031
Rise in demand for herbal equine supplements, increase in incidence of equine diseases, and growth in government initiatives toward equine health
North America is expected to account for major share of the global equine supplement products market during the forecast period
Zoetis, Boehringer Ingelheim International GmbH, Bayer AG, Equine Products UK LTD, Purina Animal Nutrition LLC., Vetoquinol S.A., Kentucky Equine Research, Plusvital Limited, Lallemand, Inc., and Virbac
1. Preface
1.1. Market Definition and Scope
1.2. Market Segmentation
1.3. Key Research Objectives
1.4. Research Highlights
2. Assumptions and Research Methodology
3. Executive Summary: Global Equine Supplement Products Market
4. Market Overview
4.1. Introduction
4.1.1. Definition
4.1.2. Industry Evolution / Developments
4.2. Overview
4.3. Market Dynamics
4.3.1. Drivers
4.3.2. Restraints
4.3.3. Opportunities
4.4. Global Equine Supplement Products Market Analysis and Forecast, 2017-2031
4.5. Porter’s Five Force Analysis
5. Market Outlook
5.1. New Product Launch
5.2. Key Mergers & Acquisitions
5.3. Equine Population Overview, by Region
5.4. Regulatory Scenario, by Region/globally
6. Global Equine Supplement Products Market Analysis and Forecast, by Supplement
6.1. Introduction & Definition
6.2. Key Findings / Developments
6.3. Market Value Forecast, by Supplement, 2017-2031
6.3.1. Proteins/Amino Acids
6.3.2. Vitamins
6.3.3. Enzymes
6.3.4. Electrolytes & Minerals
6.3.5. Others
6.4. Market Attractiveness Analysis, by Supplement
7. Global Equine Supplement Products Market Analysis and Forecasts, by Application
7.1. Introduction & Definition
7.2. Key Findings / Developments
7.3. Market Value Forecast, by Application, 2017-2031
7.3.1. Performance Enhancement/Recovery
7.3.2. Joint Disorder Prevention
7.3.3. Others
7.4. Market Attractiveness Analysis, by Application
8. Global Equine Supplement Products Market Analysis and Forecast, by Distribution Channel
8.1. Introduction & Definition
8.2. Key Findings / Developments
8.3. Market Value Forecast, by Distribution Channel, 2017-2031
8.3.1. Veterinary Hospital Pharmacies
8.3.2. Retail Pharmacies
8.3.3. Others
8.4. Market Attractiveness Analysis, by Distribution Channel
9. Global Equine Supplement Products Market Analysis and Forecast, by Region
9.1. Key Findings
9.2. Market Value Forecast, by Region
9.2.1. North America
9.2.2. Europe
9.2.3. Asia Pacific
9.2.4. Latin America
9.2.5. Middle East & Africa
9.3. Market Attractiveness Analysis, by Region
10. North America Equine Supplement Products Market Analysis and Forecast
10.1. Introduction
10.1.1. Key Findings
10.2. Market Value Forecast, by Supplement, 2017-2031
10.2.1. Proteins/Amino Acids
10.2.2. Vitamins
10.2.3. Enzymes
10.2.4. Electrolytes & Minerals
10.2.5. Others
10.3. Market Value Forecast, by Application, 2017-2031
10.3.1. Performance Enhancement/Recovery
10.3.2. Joint Disorder Prevention
10.3.3. Others
10.4. Market Value Forecast, by Distribution Channel, 2017-2031
10.4.1. Veterinary Hospital Pharmacies
10.4.2. Retail Pharmacies
10.4.3. Others
10.5. Market Value Forecast, by Country, 2017-2031
10.5.1. U.S.
10.5.2. Canada
10.6. Market Attractiveness Analysis
10.6.1. By Supplement
10.6.2. By Application
10.6.3. By Distribution Channel
10.6.4. By Country
11. Europe Equine Supplement Products Market Analysis and Forecast
11.1. Introduction
11.1.1. Key Findings
11.2. Market Value Forecast, by Supplement, 2017-2031
11.2.1. Proteins/Amino Acids
11.2.2. Vitamins
11.2.3. Enzymes
11.2.4. Electrolytes & Minerals
11.2.5. Others
11.3. Market Value Forecast, by Application, 2017-2031
11.3.1. Performance Enhancement/Recovery
11.3.2. Joint Disorder Prevention
11.3.3. Others
11.4. Market Value Forecast, by Distribution Channel, 2017-2031
11.4.1. Veterinary Hospital Pharmacies
11.4.2. Retail Pharmacies
11.4.3. Others
11.5. Market Value Forecast, by Country/Sub-region, 2017-2031
11.5.1. Germany
11.5.2. U.K.
11.5.3. France
11.5.4. Spain
11.5.5. Italy
11.5.6. Rest of Europe
11.6. Market Attractiveness Analysis
11.6.1. By Supplement
11.6.2. By Application
11.6.3. By Distribution Channel
11.6.4. By Country/Sub-region
12. Asia Pacific Equine Supplement Products Market Analysis and Forecast
12.1. Introduction
12.1.1. Key Findings
12.2. Market Value Forecast, by Supplement, 2017-2031
12.2.1. Proteins/Amino Acids
12.2.2. Vitamins
12.2.3. Enzymes
12.2.4. Electrolytes & Minerals
12.2.5. Others
12.3. Market Value Forecast, by Application, 2017-2031
12.3.1. Performance Enhancement/Recovery
12.3.2. Joint Disorder Prevention
12.3.3. Others
12.4. Market Value Forecast, by Distribution Channel, 2017-2031
12.4.1. Veterinary Hospital Pharmacies
12.4.2. Retail Pharmacies
12.4.3. Others
12.5. Market Value Forecast, by Country/Sub-region, 2017-2031
12.5.1. China
12.5.2. Japan
12.5.3. India
12.5.4. Australia & New Zealand
12.5.5. Rest of Asia Pacific
12.6. Market Attractiveness Analysis
12.6.1. By Supplement
12.6.2. By Application
12.6.3. By Distribution Channel
12.6.4. By Country/Sub-region
13. Latin America Equine Supplement Products Market Analysis and Forecast
13.1. Introduction
13.1.1. Key Findings
13.2. Market Value Forecast, by Supplement, 2017-2031
13.2.1. Proteins/Amino Acids
13.2.2. Vitamins
13.2.3. Enzymes
13.2.4. Electrolytes & Minerals
13.2.5. Others
13.3. Market Value Forecast, by Application, 2017-2031
13.3.1. Performance Enhancement/Recovery
13.3.2. Joint Disorder Prevention
13.3.3. Others
13.4. Market Value Forecast, by Distribution Channel, 2017-2031
13.4.1. Veterinary Hospital Pharmacies
13.4.2. Retail Pharmacies
13.4.3. Others
13.5. Market Value Forecast, by Country/Sub-region, 2017-2031
13.5.1. Brazil
13.5.2. Mexico
13.5.3. Rest of Latin America
13.6. Market Attractiveness Analysis
13.6.1. By Supplement
13.6.2. By Application
13.6.3. By Distribution Channel
13.6.4. By Country/Sub-region
14. Middle East & Africa Equine Supplement Products Market Analysis and Forecast
14.1. Introduction
14.1.1. Key Findings
14.2. Market Value Forecast, by Supplement, 2017-2031
14.2.1. Proteins/Amino Acids
14.2.2. Vitamins
14.2.3. Enzymes
14.2.4. Electrolytes & Minerals
14.2.5. Others
14.3. Market Value Forecast, by Application, 2017-2031
14.3.1. Performance Enhancement/Recovery
14.3.2. Joint Disorder Prevention
14.3.3. Others
14.4. Market Value Forecast, by Distribution Channel, 2017-2031
14.4.1. Veterinary Hospital Pharmacies
14.4.2. Retail Pharmacies
14.4.3. Others
14.5. Market Value Forecast, by Country/Sub-region, 2017-2031
14.5.1. GCC Countries
14.5.2. South Africa
14.5.3. Rest of Middle East & Africa
14.6. Market Attractiveness Analysis
14.6.1. By Supplement
14.6.2. By Application
14.6.3. By Distribution Channel
14.6.4. By Country/Sub-region
15. Competition Landscape
15.1. Market Player - Competition Matrix (by tier and size of companies)
15.2. Market Share Analysis, by Company, 2018
15.3. Company Profiles
15.3.1. Zoetis
15.3.1.1. Company Overview (HQ, Business Segments, Employee Strength)
15.3.1.2. Product Portfolio
15.3.1.3. SWOT Analysis
15.3.1.4. Strategic Overview
15.3.2. Boehringer Ingelheim International GmbH
15.3.2.1. Company Overview (HQ, Business Segments, Employee Strength)
15.3.2.2. Product Portfolio
15.3.2.3. SWOT Analysis
15.3.2.4. Strategic Overview
15.3.3. Bayer AG
15.3.3.1. Company Overview (HQ, Business Segments, Employee Strength)
15.3.3.2. Product Portfolio
15.3.3.3. SWOT Analysis
15.3.3.4. Strategic Overview
15.3.4. Equine Products UK LTD
15.3.4.1. Company Overview (HQ, Business Segments, Employee Strength)
15.3.4.2. Product Portfolio
15.3.4.3. SWOT Analysis
15.3.4.4. Strategic Overview
15.3.5. Purina Animal Nutrition LLC.
15.3.5.1. Company Overview (HQ, Business Segments, Employee Strength)
15.3.5.2. Product Portfolio
15.3.5.3. SWOT Analysis
15.3.5.4. Strategic Overview
15.3.6. Vetoquinol S.A.
15.3.6.1. Company Overview (HQ, Business Segments, Employee Strength)
15.3.6.2. Product Portfolio
15.3.6.3. SWOT Analysis
15.3.6.4. Strategic Overview
15.3.7. Kentucky Equine Research
15.3.7.1. Company Overview (HQ, Business Segments, Employee Strength)
15.3.7.2. Product Portfolio
15.3.7.3. SWOT Analysis
15.3.7.4. Strategic Overview
15.3.8. Plusvital Limited
15.3.8.1. Company Overview (HQ, Business Segments, Employee Strength)
15.3.8.2. Product Portfolio
15.3.8.3. SWOT Analysis
15.3.8.4. Strategic Overview
15.3.9. Lallemand Inc.
15.3.9.1. Company Overview (HQ, Business Segments, Employee Strength)
15.3.9.2. Product Portfolio
15.3.9.3. SWOT Analysis
15.3.9.4. Strategic Overview
15.3.10. Virbac
15.3.10.1. Company Overview (HQ, Business Segments, Employee Strength)
15.3.10.2. Product Portfolio
15.3.10.3. SWOT Analysis
15.3.10.4. Strategic Overview
List of Tables
Table 01: Global Equine Supplement Products Market Size (US$ Mn) Forecast, by Supplement, 2017-2031
Table 02: Global Equine Supplement Products Market Value (US$ Mn) Forecast, by Application, 2017-2031
Table 03: Global Equine Supplement Products Market Value (US$ Mn) Forecast, by Distribution Channel, 2017-2031
Table 04: Global Equine Supplement Products Market Value (US$ Mn) Forecast, by Region, 2017-2031
Table 05: North America Equine Supplement Products Market Value (US$ Mn) Forecast, by Supplement, 2017-2031
Table 06: North America Equine Supplement Products Market Value (US$ Mn) Forecast, by Application, 2017-2031
Table 07: North America Equine Supplement Products Market Value (US$ Mn) Forecast, by Distribution Channel, 2017-2031
Table 08: North America Equine Supplement Products Market Size (US$ Mn) Forecast, by Country, 2017-2031
Table 09: Europe Equine Supplement Products Market Value (US$ Mn) Forecast, by Supplement, 2017-2031
Table 10: Europe Equine Supplement Products Market Value (US$ Mn) Forecast, by Application, 2017-2031
Table 11: Europe Equine Supplement Products Market Value (US$ Mn) Forecast, by Distribution Channel, 2017-2031
Table 12: Europe Equine Supplement Products Market Size (US$ Mn) Forecast, by Country/Sub-region, 2017-2031
Table 13: Asia Pacific Equine Supplement Products Market Value (US$ Mn) Forecast, by Supplement, 2017-2031
Table 14: Asia Pacific Equine Supplement Products Market Value (US$ Mn) Forecast, by Application, 2017-2031
Table 15: Asia Pacific Equine Supplement Products Market Value (US$ Mn) Forecast, by Distribution Channel, 2017-2031
Table 16: Asia Pacific Equine Supplement Products Market Size (US$ Mn) Forecast, by Country/Sub-region, 2017-2031
Table 17: Latin America Equine Supplement Products Market Value (US$ Mn) Forecast, by Supplement, 2017-2031
Table 18: Latin America Equine Supplement Products Market Value (US$ Mn) Forecast, by Application, 2017-2031
Table 19: Latin America Equine Supplement Products Market Value (US$ Mn) Forecast, by Distribution Channel, 2017-2031
Table 20: Latin America Equine Supplement Products Market Size (US$ Mn) Forecast, by Country/Sub-region, 2017-2031
Table 21: Middle East & Africa Equine Supplement Products Market Value (US$ Mn) Forecast, by Supplement, 2017-2031
Table 22: Middle East & Africa Equine Supplement Products Market Value (US$ Mn) Forecast, by Application, 2017-2031
Table 23: Middle East & Africa Equine Supplement Products Market Value (US$ Mn) Forecast, by Distribution Channel, 2017-2031
Table 24: Middle East & Africa Equine Supplement Products Market Revenue (US$ Mn) Forecast, by Country/Sub-region, 2017-2031
List of Figures
Figure 01: Global Equine Supplement Products Market Revenue (US$ Mn) Forecast and Y-o-Y Growth (%) Projection, 2017-2031
Figure 02: Global Equine Supplement Products Market Value Share, by Supplement, 2018
Figure 03: Global Equine Supplement Products Market Value Share, by Application, 2018
Figure 04: Global Equine Supplement Products Market Value Share, by Distribution Channel, 2018
Figure 05: Global Equine Supplement Products Market Value Share, by Region, 2018
Figure 06: Global Equine Supplement Products Market Value Share Analysis, by Supplement, 2021 and 2031
Figure 07: Global Equine Supplement Products Market Revenue (US$ Mn) Forecast and Y-o-Y Growth (%) Projection, by Protein/Amino Acid, 2017-2031
Figure 08: Global Equine Supplement Products Market Revenue (US$ Mn) Forecast and Y-o-Y Growth (%) Projection, by Vitamins, 2017-2031
Figure 09: Global Equine Supplement Products Market Revenue (US$ Mn) Forecast and Y-o-Y Growth (%) Projection, by Enzymes, 2017-2031
Figure 10: Global Equine Supplement Products Market Revenue (US$ Mn) Forecast and Y-o-Y Growth (%) Projection, by Electrolytes & Minerals, 2017-2031
Figure 11: Global Equine Supplement Products Market Revenue (US$ Mn) Forecast and Y-o-Y Growth (%) Projection, by Others, 2017-2031
Figure 12: Global Equine Supplement Products Market Attractiveness Analysis, by Supplement, 2022-2031
Figure 13: Global Equine Supplement Products Market Value Share Analysis, by Application, 2021 and 2031
Figure 14: Global Equine Supplement Products Market Revenue (US$ Mn) Forecast and Y-o-Y Growth (%) Projection, by Performance Enhancement& Recovery, 2017-2031
Figure 15: Global Equine Supplement Products Market Revenue (US$ Mn) Forecast and Y-o-Y Growth (%) Projection, by Joint Disorder Prevention, 2017-2031
Figure 16: Global Equine Supplement Products Market Revenue (US$ Mn) Forecast and Y-o-Y Growth (%) Projection, by Others, 2017-2031
Figure 17: Global Equine Supplement Products Market Attractiveness Analysis, by Application, 2022-2031
Figure 18: Global Equine Supplement Products Market Value Share Analysis, by Distribution Channel, 2021 and 2031
Figure 19: Global Equine Supplement Products Market Revenue (US$ Mn) Forecast and Y-o-Y Growth (%) Projection, by Veterinary Hospital Pharmacies, 2017-2031
Figure 20: Global Equine Supplement Products Market Revenue (US$ Mn) Forecast and Y-o-Y Growth (%) Projection, by Retail Pharmacies, 2017-2031
Figure 21: Global Equine Supplement Products Market Revenue (US$ Mn) Forecast and Y-o-Y Growth (%) Projection, by Others, 2017-2031
Figure 22: Global Equine Supplement Products Market Attractiveness Analysis, by Distribution Channel, 2022–2031
Figure 23: Global Equine Supplement Products Market Value Share (%), by Region, 2021 and 2031
Figure 24: Global Equine Supplement Products Market Attractiveness Analysis, by Region, 2022-2031
Figure 25: North America Equine Supplement Products Market Size (US$ Mn) Forecast and Y-o-Y Growth (%) Projection, 2017-2031
Figure 26: North America Equine Supplement Products Market Value Share Analysis, by Supplement, 2021 and 2031
Figure 27: North America Equine Supplement Products Market Attractiveness Analysis, by Supplement, 2022-2031
Figure 28: North America Equine Supplement Products Market Value Share Analysis, by Application, 2021 and 2031
Figure 29: North America Equine Supplement Products Market Attractiveness Analysis, by Application, 2022-2031
Figure 30: North America Equine Supplement Products Market Value Share Analysis, by Distribution Channel, 2021 and 2031
Figure 31: North America Equine Supplement Products Market Attractiveness Analysis, by Distribution Channel, 2022–2031
Figure 32: North America Equine Supplement Products Market Value Share Analysis, by Country, 2021 and 2031
Figure 33: North America Equine Supplement Products Market Attractiveness Analysis, by Country, 2022-2031
Figure 34: Europe Equine Supplement Products Market Size (US$ Mn) Forecast and Y-o-Y Growth (%) Projection, 2017-2031
Figure 35: Europe Equine Supplement Products Market Value Share Analysis, by Supplement, 2021 and 2031
Figure 36: Europe Equine Supplement Products Market Attractiveness Analysis, by Supplement, 2022-2031
Figure 37: Europe Equine Supplement Products Market Value Share Analysis, by Application, 2021 and 2031
Figure 38: Europe Equine Supplement Products Market Attractiveness Analysis, by Application, 2022-2031
Figure 39: Europe Equine Supplement Products Market Value Share Analysis, by Distribution Channel, 2021 and 2031
Figure 40: Europe Equine Supplement Products Market Attractiveness Analysis, by Distribution Channel, 2022–2031
Figure 41: Europe Equine Supplement Products Market Value Share Analysis, by Country/Sub-region, 2021 and 2031
Figure 42: Europe Equine Supplement Products Market Attractiveness Analysis, by Country/Sub-region, 2022-2031
Figure 43: Asia Pacific Equine Supplement Products Market Size (US$ Mn) Forecast and Y-o-Y Growth (%) Projection, 2017-2031
Figure 44: Asia Pacific Equine Supplement Products Market Value Share Analysis, by Supplement, 2021 and 2031
Figure 45: Asia Pacific Equine Supplement Products Market Attractiveness Analysis, by Supplement, 2022-2031
Figure 46: Asia Pacific Equine Supplement Products Market Value Share Analysis, by Application, 2021 and 2031
Figure 47: Asia Pacific Equine Supplement Products Market Attractiveness Analysis, by Application, 2022-2031
Figure 48: Asia Pacific Equine Supplement Products Market Value Share Analysis, by Distribution Channel, 2021 and 2031
Figure 49: Asia Pacific Equine Supplement Products Market Attractiveness Analysis, by Distribution Channel, 2022–2031
Figure 50: Asia Pacific Equine Supplement Products Market Value Share Analysis, by Country/Sub-region, 2021 and 2031
Figure 51: Asia Pacific Equine Supplement Products Market Attractiveness Analysis, by Country/Sub-region, 2022-2031
Figure 52: Latin America Equine Supplement Products Market Size (US$ Mn) Forecast and Y-o-Y Growth (%) Projection, 2017-2031
Figure 53: Latin America Equine Supplement Products Market Value Share Analysis, by Supplement, 2021 and 2031
Figure 54: Latin America Equine Supplement Products Market Attractiveness Analysis, by Supplement, 2022-2031
Figure 55: Latin America Equine Supplement Products Market Value Share Analysis, by Application, 2021 and 2031
Figure 56: Latin America Equine Supplement Products Market Attractiveness Analysis, by Application, 2022-2031
Figure 57: Latin America Equine Supplement Products Market Value Share Analysis, by Distribution Channel, 2021 and 2031
Figure 58: Latin America Equine Supplement Products Market Attractiveness Analysis, by Distribution Channel, 2022–2031
Figure 59: Latin America Equine Supplement Products Market Value Share Analysis, by Country/Sub-region, 2021 and 2031
Figure 60: Latin America Equine Supplement Products Market Attractiveness Analysis, by Country/Sub-region, 2022-2031
Figure 61: Middle East & Africa Equine Supplement Products Market Size (US$ Mn) Forecast and Y-o-Y Growth (%) Projection, 2017-2031
Figure 62: Middle East & Africa Equine Supplement Products Market Value Share Analysis, by Supplement, 2021 and 2031
Figure 63: Middle East & Africa Equine Supplement Products Market Attractiveness Analysis, by Supplement, 2022-2031
Figure 64: Middle East & Africa Equine Supplement Products Market Value Share Analysis, by Application, 2021 and 2031
Figure 65: Middle East & Africa Equine Supplement Products Market Attractiveness Analysis, by Application, 2022-2031
Figure 66: Middle East & Africa Equine Supplement Products Market Value Share Analysis, by Distribution Channel, 2021 and 2031
Figure 67: Middle East & Africa Equine Supplement Products Market Attractiveness Analysis, by Distribution Channel, 2022–2031
Figure 68: Middle East & Africa Equine Supplement Products Market Value Share Analysis, by Country/Sub-region, 2021 and 2031
Figure 69: Middle East & Africa Equine Supplement Products Market Attractiveness Analysis, by Country/Sub-region, 2022-2031
Figure 70: Boehringer Ingelheim International GmbH Animal Health Business Revenue (US$ Mn) and Y-o-Y Growth (%), 2016–2018
Figure 71: Boehringer Ingelheim International GmbH R&D expenditure (US$ Mn) and Y-o-Y Growth (%), 2018
Figure 72: Boehringer Ingelheim International GmbH Breakdown of Net Sales, by Product Segment, 2018
Figure 73: Boehringer Ingelheim International GmbH Breakdown of Net Sales, by Region, 2018
Figure 74: Bayer AG Animal Health Revenue (US$ Mn) and Y-o-Y Growth (%), 2016–2018
Figure 75: Bayer AG R&D Expenses and Marketing & Sales Expenses (US$ Mn), 2017–2018
Figure 76: Bayer AG Breakdown of Net Sales, by Business Segment, 2018
Figure 77: Bayer AG Breakdown of Animal Health Segment Net Sales, by Region, 2018
Figure 78: Zoetis Revenue (US$ Mn) and Y-o-Y Growth (%), 2016–2018
Figure 79: Zoetis R&D expenditure (US$ Mn) and Y-o-Y Growth (%), 2016-2018
Figure 80: Zoetis Breakdown of Net Sales, by Species, 2018
Figure 81: Zoetis Breakdown of Net Sales, by Business Segment, 2018
Figure 82: Vetoquinol S.A. Revenue (US$ Mn) and Y-o-Y Growth (%), 2015–2017
Figure 83: Vetoquinol S.A. Breakdown of Net Sales, by Region, 2017
Figure 84: Virbac Revenue (US$ Mn) and Y-o-Y Growth (%), 2016–2018
Figure 85: Virbac R&D Expenses (US$ Mn) and Y-o-Y Growth (%), 2016-2018
Figure 86: Virbac Breakdown of Net Sales, by Business Segment, 2018
Figure 87: Virbac Breakdown of Net Sales, by Region, 2018
Copyright © Transparency Market Research, Inc. All Rights reserved
Trust Online

Equine Supplement Products Market